


 Arguments


Recent Comments
Prev 2360 2361 2362 2363 2364 2365 2366 2367 2368 2369 2370 2371 2372 2373 2374 2375 Next
Comments 118351 to 118400:
-
chris at 22:10 PM on 31 May 2010Working out climate sensitivity from satellite measurements
shawnhet at 03:55 AM on 30 May, 2010 You haven’t really addressed my points shawnhet, except (incorrectly) point #5. Perhaps I can make my points clearer. It’s also helpful to address this paper in its wider context since (as we both know) while we’re ostensibly addressing a scientific paper, there’s some interesting “non-science” stuff going with this work and how it’s publicised blogospherically! I’m going to do the latter in a second post – that way if the moderators consider that I’m straying from the science or my post induces a series of follow up non-science posts, it (and they) can be deleted. ONE: Your first point is confused isn’t it? One the one hand you say: ”S&B (and I)are not talking about the long-term feedback response (ie climate sensitivity),…” ...which we can all agree with, since that’s obvious by reading the paper and Spencer and Braswell (S&B) state this explicitly. But then you say: ”However, for a given set of long-term feedbacks S&B predict a less sensitive climate than if short term variations are governed by noise(in S&B's terms).” That odd dichotomy (the paper both isn’t and is about climate sensitivity) is a good example of the confusion that can arise from Spencer’s style of “science by insinuation” (where you say one thing in a scientific paper, and something different on a blog?) I can’t think of another reason how you can simultaneously conclude two incompatible things – one certainly can’t arrive at that conclusion from reading S&B’s paper. TWO: Your first point is correct. S&B state that their “linear striations” don’t have anything necessarily to do with climate sensitivity (the equilibrium surface temperature response to radiative forcing). They find some “linear striations” in an analysis of short term TOA radiation/temperature relationships but don’t quite know what they mean, although they consider that they might have a physical basis. That’s fine. The next step, scientifically-speaking, is to establish what these “striations” are and what they really mean (if anything) in relation to TOA radiative transfer. THREE: I’d say that’s where the science stands on S&B(2010). However it’s perfectly acceptable (scientifically-speaking) to make a presumption about what this might mean, and within that model to assess potential consequences. Lin et al (2010) do this in a couple of papers (cited here). They use S&B’s “linear striations” to parameterize a fast feedback parameter [f(s)] of a radiative transfer model and find that if one uses a model that bears some realism to the real world (i.e. one in which there is a non-zero “inertia” or “memory” in the climate system), that S&B’s “linear striations” are entirely compatible with a real world climate sensitivity consistent with the wealth of independent data (Lin et al find a “best” value for the climate sensitivity of 3.1 oC). Your assertion "You'll note that they had to "add" something to make sense of what Spencer found." isn’t correct. They’aren’t “making sense of what Spencer found”. They are taking an interpretation of S&B’s “linear striations” at face value and addressing how this might affect real world climate sensitivity -
F. Murdoch at 21:37 PM on 31 May 2010Could global brightening be causing global warming?
@RSVP You cannot compare the increase in forcing to the increase in GHG's. After all, at equilibrium the effective forcing would be 0, regardless of the concentration of GHG's. -
PaulK at 20:53 PM on 31 May 2010There's no empirical evidence
Riccardo #98 You wrote: "it's not clear to me what you mean by "the assumptions in your version of the heat balance equation". Which assumptions did "I" make? Did you find something wrong?" I used the term "your version" to be simply descriptive, not pejorative. Strictly we have covered three versions of the heat equation:- Schwartz version:- dH/dt = F * exp(-t/tau) "Your version":- dH/dt = F(t)−λΔT "My version":- dH/dt = -f(t) "Your version" makes the same assumptions that are built into the Schwartz model, and then one additional assumption, which is the curtailment of higher order temperature terms in the exponential expansion (or in the derivative form of S-B apploied to Ts - it comes to the the same thing). I wasn't suggesting that this is "wrong":- each of these versions is founded on its own assumptions. I am claiming that my solution is more general than Schwartz, and hence more general than "your version". Where are we going with this? With real-world data (CO2), over a wide variety of assumptions imposed on "my version", the rise in OLR cannot be reconciled with the IPCC assertions and assumptions. This whole conversation started because, as I stated, the "hand-waving" arguments about CO2 being the primary driver, BUT thermal emissions overwhelm the OLR response don't hold water for the long equilibration times asserted by the IPCC . -
Marcus at 20:49 PM on 31 May 2010Could global brightening be causing global warming?
Consider this though HR. Sunspot numbers have been dropping marginally since 1979-so the amount of radiative energy-in W/Square meter, have been dropping over that time period. So for there to have been even a small rise in radiation at the earth's surface means that there must have been a change in Earth's albedo (reduced aerosols, reduced cloud cover etc etc.) However, as John pointed out-all these things also contribute to the retention of IR radiation as it heads out to the upper atmosphere. So a reduction in clouds & aerosols should-if I understand it correctly-have little effect on the *net* radiation balance-because they mostly offset each-other. The fact that the amount of IR radiation detected in the stratosphere has dropped-in *spite* of the reduction in heat retaining clouds & aerosols gives even greater credence to the idea that it must be increasing GHG emissions which are trapping the heat in the lower atmosphere. Now, I accept that I could have the total wrong end of the stick, but it makes sense to me. What say you, John? -
Marcus at 20:43 PM on 31 May 2010Could global brightening be causing global warming?
Either way, Ed Davies, what RSVP hasn't factored in is that we're *not* just talking about CO2-it represents *all* GHG emissions-& CH4 is a more potent GHG gas, & has risen at a sharper rate than CO2. It could also explain why it leveled off modestly around 1980-the leveling off of methane emissions (but they've started to climb again!) -
Ed Davies at 19:33 PM on 31 May 2010Could global brightening be causing global warming?
"Interesting to see Fig 2 showing that GHG forcing has tripled in the last century when GHG concentration has only increased by a factor of 1.5." Given that the zero point of this graph is, rather obviously, the effective forcings in 1880 don't you think it's an imaginative leap, to put it mildly, to say that the GHG forcing has tripled? -
RSVP at 18:18 PM on 31 May 2010Could global brightening be causing global warming?
Bern I was talking about 250 ppm vs 380 ppm... a factor of 1.5 roughly. The units in Figure 2 depict energy per square meter, not concentration. In terms of the relationship between concentration and energy, concentration is the independent variable, while energy is the dependent variable. Energy normally increases as the square root of a linear change in the independent variable. -
HumanityRules at 18:05 PM on 31 May 2010Could global brightening be causing global warming?
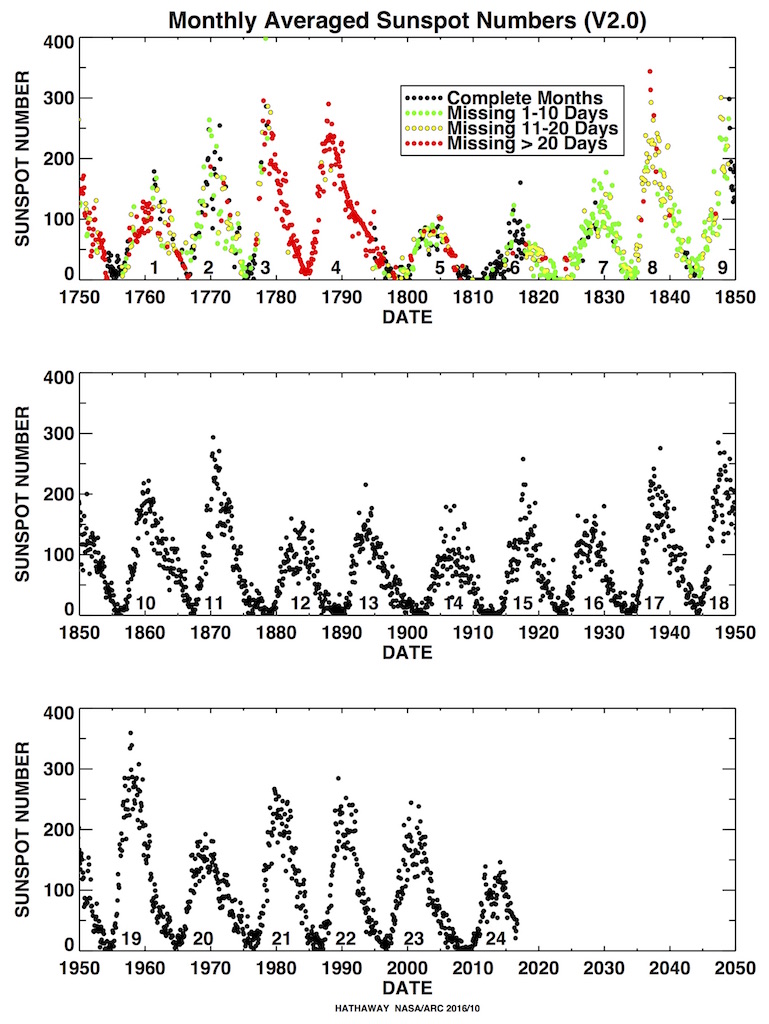
So what does figure 1 tell us? How much of the sun's energy is reaching the surface? This must be of some importance to temperature change? 3.Bern I think it's reduced methane. -
Bern at 17:35 PM on 31 May 2010Could global brightening be causing global warming?
RSVP: the 1900 GHG value in Fig 2 is ~0.2, while the 2000 value is ~2.7 or so. That seems like much more than a tripling to me! It's rather scary to see the GHG forcing was growing exponentially from ~1940 through to the late 1980s or so, where it seems to have tapered off dramatically. Does anyone have any idea why the sudden drop in the rate of increase c.1990? Is it to do with changing patterns of energy use, or something else? -
RSVP at 17:12 PM on 31 May 2010Could global brightening be causing global warming?
Interesting to see Fig 2 showing that GHG forcing has tripled in the last century when GHG concentration has only increased by a factor of 1.5. -
MikeCoombes at 15:31 PM on 31 May 2010Working out climate sensitivity from satellite measurements
Thanks Riccardo for the comment For example, think about downwelling and upwelling and mixing of ocean waters. These movements are not well know and may produce a large unaccounted variability in the short run but tend to average out over longer periods. But we have a hundred years of data to average over. The change in energy from the sun between summer and winter over a hemisphere (N or S) is approximately constant and much larger than most other factors and the consequent temperature change is also large (I would guess about 20C - much more at the poles and less near the equator -) and also roughly constant but with more variability for the reasons you mentioned. I guess I should just try to calculate it. I recall Open Mind had a few blogs on how much various orbital factors affected how much sunlight a hemisphere received. -
villabolo at 15:22 PM on 31 May 2010Could global brightening be causing global warming?
Did not Lord Monckton make an argument once for Global Cooling? You know, the one based on a falsified version of an UAH globally averaged satellite based temperature chart, conveniently cut off at 1998 to show an artefactual drop in temperature? Pray tell, Lord Monckton, which is it? Global Cooling or Global Warming through whatever means? -
johnd at 13:11 PM on 31 May 2010There's no empirical evidence
cherrypicked at 11:46 AM, just to add to my earlier post to help get it into perspective and hopefully not further confuse the matter, temperature drops about 7oC for every 1000m increase in altitude above sea level, that is about 1oC for every 140m increase in height, all other things being equal. -
johnd at 12:40 PM on 31 May 2010There's no empirical evidence
cherrypicked at 11:46 AM, the qualification "or" will apply if you consider how conditions can change given IR radiation is always from the warmer body to the cooler. The relative differences in state between the surface and the atmosphere can be that the surface can be warmer than the atmosphere, OR both the surface and the atmosphere are in equilibrium, OR the surface is cooler than the atmosphere. It is always going to be one OR the other depending on all the variables that combine to produce the climate that exists on this planet. -
cherrypicked at 11:46 AM on 31 May 2010There's no empirical evidence
It can't be a bit of both as you suggest. Warming the atmosphere can only lead to warming the surface if at least some of the warming is directed downwards. Specifically, radiative trapping produces (some) surface radiative forcing. But that is not what Evans said. He said it is one *or* the other. He didn't say it's a bit of both. Also, the sentence makes no sense if we substitute "or" for "and", so it is unlikely a typo. However, "caused by" would fit. -
jfbarsoum at 11:22 AM on 31 May 2010Skeptical Science now a Nokia app
For those of you with other phones (Pre, Android, etc.) you might consider using a good RSS reader app as a stop-gap. There are XML RSS feeds for both the ARguments and the Blog, so if you can read those feeds using a mobile reader, you're golden. -
cherrypicked at 10:58 AM on 31 May 2010There's no empirical evidence
Thank you for the detailed article. I have a question? In the section, co2 traps heat, you quote Evans 2006: The results lead the authors to conclude that "this experimental data should effectively end the argument by skeptics that no experimental evidence exists for the connection between greenhouse gas increases in the atmosphere and global warming." Yet the opening sentence in the link you provide, Evans states: "The earth's climate system is warmed by 35 C due to the emission of downward infrared radiation by greenhouse gases in the atmosphere (surface radiative forcing) or by the absorption of upward infrared radiation (radiative trapping)." It is the use of the conjunction "or" that I am querying. Which is it? Is it surface radiative forcing, or is it radiative trapping? I am *not* suggesting the above statement in some way invalidates Evans' proof, but it does cast doubt on the mechanism responsible for the warming. For completeness, I must point out that this sentence does not appear in the linked article - only the abstract.Response: "Which is it? Is it surface radiative forcing, or is it radiative trapping?"
A little from column A, a little from column B. Greenhouse gases both absorb upward infrared radiation which warms the atmosphere, and also scatter or reemit infrared radiation in all directions, some of which heads back to Earth. -
Bern at 10:56 AM on 31 May 2010Skeptical Science now a Nokia app
doug: Are we talking a phone OS flame war, or a PC OS flame war, or both? Shall we have a flame war about what to have the flame war about? :-P John: very cool, more exposure for this wonderful site. Good to hear an update about the Android app - I await it with bated breath... Hmm, I'm pretty sure that shouldn't be "baited breath"... oh, no, a grammar flame war! :-D -
johnd at 09:41 AM on 31 May 2010Websites to monitor the Arctic Sea Ice
Just to appreciate the difficulties in estimating ice volume, and the need for caution about drawing conclusions from relatively small changes in estimates, the accuracy that applies to measurements made needs to be taken on board. The acknowledged error involved in measuring ice thickness ABOVE the waterline is plus/minus 50mm. Because only about 10% of the ice is above the waterline this error multiplies to plus/minus 500mm which is very significant when first year ice is generally less than 2m thick, meaning less than 200mm freeboard and multi-year ice about 3m thick, meaning 300mm freeboard. All other estimates such as density have their own inbuilt errors, but the error involved in estimating actual ice volume comes down to this relatively large error involved in simply measuring the sea ice freeboard. Even as new technology and techniques improve the accuracy of measuring the ice freeboard, it will be still subject to a factor of 10. Even once that improved accuracy been established, it doesn't change the fact that all measurements obtained in the past will still have those large inbuilt errors which have to be taken into account when comparisons are made with any historical data. -
Berényi Péter at 09:25 AM on 31 May 2010Websites to monitor the Arctic Sea Ice
#22 Riccardo at 06:47 AM on 31 May, 2010 you're just playing war games No, it's the US Navy's job, not mine. And they do play it all the time. It includes verifying the forecast systems operated by smart guys using independent means. I reckon they send out patrols to check model forecast occasionally, ordered to report back their findings. Understanding the ice thickness distribution and its variability is important in both short-term operational forecasts and longer-term climate studies. Model-derived ice thickness fields are useful in obtaining a large-scale, but detailed picture of ice distribution and, more importantly, an understanding of its temporal variability. #25 michael sweet at 08:11 AM on 31 May, 2010 the other is a derived number by a web blogger with unknown error bars You must refer to my attempt. But you are overestimating my role by saying the numbers are derived by me. The algorithm I have run is actually pretty straightforward, the curves come from the PIPS 2.0 24 hour forecast maps. As there are no error bars supplied by PIPS, of course I could not pull out one from thin air. All I can say is errors introduced by the transformation are negligible. Casting doubts does not contribute to understanding. As for sea ice volume, please check the article Has Arctic sea ice returned to normal?, this site.What the science says...
BTW, ice volume graph provided by the Polar Ice Center does not have error bars either.Sea ice extent tells us what about the state of the sea ice at the ocean's surface, not what's happening below. Arctic sea ice has been steadily thinning, even in the last few years while extent increased slightly. Consequently, the total amount of Arctic sea ice in 2008 and 2009 are the lowest on record.
-
Riccardo at 08:17 AM on 31 May 2010Climate sensitivity is low
here is a more readable formatting of Lin 2010. ;) -
michael sweet at 08:11 AM on 31 May 2010Websites to monitor the Arctic Sea Ice
I would point out that one estimate of volume is from ice scientists who have estimated their error and the other is a derived number by a web blogger with unknown error bars. You have to choose how you determine what data is worth considering. The difficulty in determining ice volume is one reason why NSIDC uses ice extent. The ice extent is a firmer number than the ice volume. With luck NSIDC will comment on this in their next monthly report. -
Riccardo at 07:53 AM on 31 May 2010Websites to monitor the Arctic Sea Ice
Marcel, as i understand it they both "assimilate" data. Each day PIPS restart the forecast with actual data if their previous forecast was out more than a certain threshold. It's about the same process used for PIOMASS. I think the difference lies in the details. Apart from being the more recent of the two, PIOMAS includes a so called thickness and enthalpy distribution sea ice model which takes into account the rheology of ice and ice ridging. Apparently PIPS does not. I'm not able to go any further on these details, we should ask a specialist. -
Peter Hogarth at 07:36 AM on 31 May 2010Climate sensitivity is low
I am not sure this paper has been mentioned yet. See Lin 2010. Obtains 3.1K for sensitivity, constraining the estimates a little to between 2.8K and 3.7K -
Marcel Bökstedt at 07:14 AM on 31 May 2010Websites to monitor the Arctic Sea Ice
Hmm.. lets just leave what WUWT writes out of this equation. And it's best that BP does not annoy the Navy, they can be nasty if they decide to retaliate. It would still be interesting to explain the differences between the estimates of ice volume. Could it be that the fact that PIPS is essentially a forecast makes it less reliable? (Maybe PIOMAS can use data obtained later than the fact to estimate ice thickness?) -
Riccardo at 06:47 AM on 31 May 2010Websites to monitor the Arctic Sea Ice
Berényi Péter, it's not about what I think but what THEY say, at least in the published papers. Maybe you have access to secret informations, do you? If not, you're just playing war games, not science. I know you can do much better than blindly follow people at WUWT, be skeptical of what they say there too. -
Berényi Péter at 06:44 AM on 31 May 2010Websites to monitor the Arctic Sea Ice
#19 michael sweet at 05:27 AM on 31 May, 2010 The red color shows ice AT LEAST 5 meters thick. Much of that ice was 10 or more meters thick (some was over 30 meters thick) in past years. You cannot integrate it as 5 meters thick.This results in underestimating the ice volume in past years Perhaps it was. But there is not much red in any PIPS map. For example the one for 14 September 1999 does not have any. -
Berényi Péter at 06:30 AM on 31 May 2010Websites to monitor the Arctic Sea Ice
#16 Marcel Bökstedt at 02:12 AM on 31 May, 2010 The difference between the navy data and PIOMAS is striking, even if the graph above of navy data only covers one particular date (is that correct BP?) Yes, that's correct. It is only for 28 May. I could do it for the entire year, but a huge amount of data (about 250 MB) is required to be downloaded and I am not sure the Navy would tolerate it :) Anyway, I've also did it for 14 September, the day Arctic sea ice extent was lowest in 2007. At that time of the year ice volume inside 70N is about all there is. Interesting to note that mid September ice volume was lowest in 2008, not in 2007. The low in 1999 is also unheard of.
#17 Riccardo at 03:06 AM on 31 May, 2010
PIPS is designed to predict ice concentration essentially near the ice edge and it is tested against this field
I don't think so. For submarines armed with strategic nuclear missiles ice thickness is a deciding factor anywhere in the Arctic. They simply can not do their job if the ice above is too thick.
The Navy also have its own devices to monitor ice conditions including submarines, spy satellites, aircraft and drift buoys. PIPS do have a sophisticated data assimilation facility developed in more than twenty years.
Moderator Response: [Sph] Bad images removed.
At that time of the year ice volume inside 70N is about all there is. Interesting to note that mid September ice volume was lowest in 2008, not in 2007. The low in 1999 is also unheard of.
#17 Riccardo at 03:06 AM on 31 May, 2010
PIPS is designed to predict ice concentration essentially near the ice edge and it is tested against this field
I don't think so. For submarines armed with strategic nuclear missiles ice thickness is a deciding factor anywhere in the Arctic. They simply can not do their job if the ice above is too thick.
The Navy also have its own devices to monitor ice conditions including submarines, spy satellites, aircraft and drift buoys. PIPS do have a sophisticated data assimilation facility developed in more than twenty years.
Moderator Response: [Sph] Bad images removed. -
Peter Hogarth at 06:15 AM on 31 May 2010Why Greenland's ice loss matters
FerdiEgb at 06:30 AM on 29 May, 2010 michael sweet at 01:06 AM on 31 May, 2010 easily beat me to a response on similar lines. We see the same Winter variance/Summer "clipping" to just above melt point over the Arctic sea ice. -
michael sweet at 05:27 AM on 31 May 2010Websites to monitor the Arctic Sea Ice
BP: I just looked at the Navy website. The red color shows ice AT LEAST 5 meters thick. Much of that ice was 10 or more meters thick (some was over 30 meters thick)in past years. You cannot integrate it as 5 meters thick. This results in underestimating the ice volume in past years. This alone is probably enough to explain the difference between you and PIOMAS. -
michael sweet at 04:16 AM on 31 May 2010Websites to monitor the Arctic Sea Ice
WUWT has integrated the colors of other peoples ice data unsuccessfully in the past (note here that BP got a lower value than WUWT). While BP has done an interesting analysis, I would not say that the US Navy has said what they think the ice volume is. BP has said what HE thinks the ice volume is based on the Navy graph. This type of analysis has many hidden errors since the Navy graph is not intended for this use. I agree with Riccardo, PIOMAS is intended for this use and will have lower error. PIOMAS undoubtedly has a high resolution map of the Navy graph that they consider in their analysis (unless the Navy gets their data from PIOMAS). -
Riccardo at 03:06 AM on 31 May 2010Websites to monitor the Arctic Sea Ice
Marcel Bökstedt, sometimes happens that critical thinking efficiency drops to zero. A post on WUWT is enough to spread the(ir) "truth". I do not have the answer to your question, obviously, but it should be noticed that PIPS is designed to predict ice concentration essentially near the ice edge and it is tested against this field (see for example here and here). On the contrary, PIOMAS is designed and tested to calculate volume. I'm not that surprised that the two do not match. -
Riccardo at 02:19 AM on 31 May 2010Volcanoes emit more CO2 than humans
JSFarmer, apart of Ian Plimer, (professor of mining geology and director of a few mining companies in Australia) and Mark Durkin (director of the infamous "The Great Global Warming Swindle") I don't think you can find many others disagreeing with your question #1. As for question #2, i've never heard criticism on the numbers. -
Marcel Bökstedt at 02:12 AM on 31 May 2010Websites to monitor the Arctic Sea Ice
The difference between the navy data and PIOMAS is striking, even if the graph above of navy data only covers one particular date (is that correct BP?) According to PIOMAS, there has been a loss of around 9000 km^3 of ice in this period 1999-2010. The navy data shows almost no loss of ice, certainly much less than 9000 km^3. Does anyone have any idea about what is going on here? -
muoncounter at 01:59 AM on 31 May 2010On temperature and CO2 in the past
In #16, Mr. Camel states: "could not find any declaration that the CO2 concentration was driving the temperature changes" However, Riccardo stated this: "... starting about a couple of centuries ago, the system has been suddenly pushed out of its shell and moved to a completely different domain. The slope of the [temp-CO2] curve is hugely different, indeed almost flat, which suggests that the driver of the climate is different from anything seen in half a million years." (Italics added). Perhaps if one drops back a bit and asks "What has driven this hugely different behavior of the temp-CO2 system?" See the following graph:Notes: 1. De-seasoned atmospheric CO2 from 3 widely-spaced sample stations (Mauna Loa, Barrow and Palmer, Antarctica) 2. Composite Law Dome Ice Core (3 sample locations) Ice core air age used as time axis. 3. Carbon emission data Trailing 5 years (residence time?) summed and expressed in gigatons. Looks like a trend to me (pardon the shameless extrapolation into the future). So let's turn the question back on the reader: What explains the relationship between increased burning of fossil fuels and increased atmospheric CO2? And what else do you offer for Riccardo's hugely different driver?
-
Riccardo at 01:48 AM on 31 May 2010It's the sun
JSFarmer, look yourself. The picture is from a NASA site. -
JSFarmer at 01:41 AM on 31 May 2010Volcanoes emit more CO2 than humans
Sorry to ask such a basic question, but the threads get too complicated for me. The rebuttal argument was very concise for this topic and I'm curious if there is any dispute. I took a quick look aound and didn't find one. Regardless of the other effects of volcanoes, or what happens to the gasses, does anyone dispute the numbers stated in the response that: 1. Volcanoes emit around 0.3 billion tonnes of CO2 per year. 2. Human CO2 emissions are around 29 billion tonnes per year. ? Thanks -
michael sweet at 01:06 AM on 31 May 2010Why Greenland's ice loss matters
FerdiEgb, The surface summer temperatures in Greenland are limited in their rise by the phase change of ice to water. The massive ice sheet creates it's own temperature. That does not mean that melt is less, only that there is not a large temperature response. Other measures are required to obtain an accurate picture of the situation. The rising melt line shows the situation more clearly. -
muoncounter at 00:11 AM on 31 May 2010Websites to monitor the Arctic Sea Ice
Its been noted elsewhere that summer arctic ice loss is accelerating. Has anyone noticed a systematic asymmetry between the summer minimum and winter maximum ice extents? Both are decreasing, but the accelerating rate of decrease in the summer outpaces the somewhat linear decrease in the winter ice extent.
Here's a graph:
Notes: Ice extent from month-by-month data files for the years 1979-2009; expressed as a percentage of 1979 values, hence 1979=0. "Summer min" is the average of the 3 months of least extent (which are Aug-Sep-Oct), while winter max is the average of the corresponding three months (Feb-Mar-Apr) for each year in the dataset. Rather than plot these data as a time series, I've found it far more interesting to plot such data vs. a relevant independent variable on the 'x-axis'. In this case, I've used temperature: LOTI for latitude N64-N90, adjusting those temperature index values so that 0 falls at 1979. Note that this index is in hundredths of deg C.
Hope that explanation of relatively minor data manipulation and presentation was vaguely comprehensible!
The best-fit functions for each season (the central curves in each set of three) are shown with +/- 1 stdev, as labeled. The two seasonals intersect at 1979, which is (0,0) as explained above. I couldn't resist the forward projection, but its only 2 years. I suppose this is a symptom of the formation of short-lived "new ice" each winter and the loss of longer-lived "old ice". So don't buy the claim that ice area is recovering based on a couple of cold winters. -
Berényi Péter at 22:49 PM on 30 May 2010Websites to monitor the Arctic Sea Ice
#13 tobyjoyce at 18:57 PM on 30 May, 2010 After dipping into WUWT, a lot is been spouted about the U.S.Navy monitoring of Arctic Ice I have checked it. The claim May arctic ice volume inside 70N has grown by 25% since 2008 is bogus. The actual growth is only 13.6%. Here is the US Navy Polar Ice Prediction System. As it makes forecasts only for the next 24 hours, I suppose it can not be too far from reality and they must have some means to check it. Submarines, perhaps? Ice over the Arctic having some strategic military relevance, they must not be badly off the mark I suppose. Except if it were classified and public version is only for confusing the enemy :) Anyway. They do not publish tabular data, just pictures like this one: [img src="http://www7320.nrlssc.navy.mil/pips2/archive/pips2_thick/2010/pips2_thick.2010053000.gif">Moderator Response: [Sph] Bad images removed -
Riccardo at 22:44 PM on 30 May 2010There's no empirical evidence
PaulK, it's not clear to me what you mean by "the assumptions in your version of the heat balance equation". Which assumptions did "I" make? Did you find something wrong? I understand we're back to the beginning but I'm a bit lost with this discussion. -
JSFarmer at 22:15 PM on 30 May 2010It's the sun
Thanks.. I clicked on the link. It was a little more difficult for me to undestand- lots of acronyms. But I will try. It talks about TSI (Total Solar Irradiance) and a debate over how to measure it. I tried to gleen sunspot info from it. It appears to use sunspot activity to reconstruct TSI. TSI corrolates to sunspots. The argument is complicated for me- trying to focus on sunspot activity, the skeptic claim is that it is increasing. The science response says it is decreasing. (confirmed by corrolating TSI in the other link) Is that correct- sunspot activity is decreasing? -
PaulK at 19:08 PM on 30 May 2010There's no empirical evidence
Riccardo #95, Erratum. I should have written ALSO equal to -F*exp(-t/tau). (A Taylor expansion of this form and then curtailment of the higher order terms yields your form of the heat equation.) -
tobyjoyce at 18:57 PM on 30 May 2010Websites to monitor the Arctic Sea Ice
After dipping into WUWT, a lot is been spouted about the U.S.Navy monitoring of Arctic Ice. Where does the Navy monitoring fit in with the civilian monitoring? -
PaulK at 18:26 PM on 30 May 2010There's no empirical evidence
Riccardo #95, Effectively, yes. Or at least it would be the same if one were to accept the assumptions in your version of the heat balance equation (and change the sign convention on the perturbation). With these assumptions, it is ALSO equal to -F*exp(t/tau) - the perturbation from a single impulse forcing. -
philipm at 18:08 PM on 30 May 2010Latest GRACE data on Greenland ice mass
John, what's the baseline for the ice mass anomalies? I looked for this in Velicogna 2009 but maybe missed it. Meanwhile AMSU-A is still looking scary. I was rash enough to blog about it in April and it's still not disappointing. The thing is, we aren't meant to obsess about short-term changes because natural variability will overwhelm the long-term trend if we look at too short a period, but natural variability should be pushing temperatures down not up over this period. I'm expecting someone to steal Spencer's email any day now. -
Riccardo at 17:43 PM on 30 May 2010Working out climate sensitivity from satellite measurements
MikeCoombes, on a yearly bases you would need to account for the internal movements of heat, someone (inappropriately, in my opinion) calls them "internal forcings". For example, think about downwelling and upwelling and mixing of ocean waters. These movements are not well know and may produce a large unaccounted variability in the short run but tend to average out over longer periods. -
Riccardo at 17:29 PM on 30 May 2010On temperature and CO2 in the past
jyyh, this is a good point, the distribution of the density of points is not uniform. It's higher at the two extremes, expecially in the cold phase region. This means that the climate system "prefers" to stay in the cold phase and sometimes switched to the warm phase, the two more stable phases. They are called stable attractors. -
Paul D at 16:32 PM on 30 May 2010Skeptical Science now a Nokia app
Well done, the more of this sort of thing the better. -
kdkd at 16:26 PM on 30 May 2010Robust warming of the global upper ocean
Ken #67 The one thing you always ignore in raising this argument is the importance of measurement error, although you will always report the bottom end of the uncertainty to try and support an "AGW isn't terribly important" position. An explicit acknowledgment of the size of error terms, and accounting for the full range of possible values (not cherry picking the range at which you will consider) is important. The other area your argument is deficient, which we've been through before is that you will only consider data at very short time durations. In order to improve the validity of your argument you need to consider longer time durations which would fit the definition of "climate". At the moment, you're really looking at "weather" and claiming that it's climate.

Prev 2360 2361 2362 2363 2364 2365 2366 2367 2368 2369 2370 2371 2372 2373 2374 2375 Next


