


 Arguments


Recent Comments
Prev 2367 2368 2369 2370 2371 2372 2373 2374 2375 2376 2377 2378 2379 2380 2381 2382 Next
Comments 118701 to 118750:
-
Marcus at 19:51 PM on 13 June 2010Is the long-term trend in CO2 caused by warming of the oceans?
The Ville. In answer to your above question. Its true that a decline in the C13/C12 ratio could be attributed to either vegetation or fossil fuel use-but that's not what is being claimed here. The claim is that warming has caused the oceans to liberate the CO2 stored as HCO3 (even though the CO2 *precedes* the warming by a good couple of decades!) CO2 liberated from a purely inorganic source like this should not impact the long-term ratio of C13/C12, yet Mauno Loa data shows that the C13/C12 ratio is definitely declining-so ocean sinks *cannot* be the source! Its also unlikely to see how modern vegetation can be the source, as plants are a net CO2 sink-even in warmer climates. Its only in periods of extended droughts when trees become a net releaser of CO2. Even then all available evidence suggests that, even under these conditions, the trees don't release enough CO2 to account for such a significant rise in CO2 (to levels unseen since before the Quaternary Era!) -
Riccardo at 19:41 PM on 13 June 2010How climate skeptics mislead
Berényi Péter, could you please explain how did you build the graph you show? -
Marcus at 19:41 PM on 13 June 2010How climate skeptics mislead
@ actually thoughtful. Is that the best that these guys can come up with? Well I can easily debunk 3 out of 4 of these arguments without even breaking a sweat: 1) Antarctic Ice Sheet: though it's true that total ice sheet *thickness* has increased slightly since the 1970's, ice sheet *mass* (as measured by the GRACE satellites) has actually been *shrinking*. All of the increased thickness has been *inland* & restricted to the Eastern half of the continent. This increase in inland thickness-at high altitude-is consistent with warming-induced changes to precipitation in the Southern Ocean, the same precipitation which has caused a significant increase in calving of the sea-ice. 2) Warming from 1900-1939 vs 1970-2009: From 1900-1939, the planet warmed at a rate of +0.08 degrees per decade, which isn't surprising given that sunspot numbers increased at an average rate of 9.9 per decade over that same period. From 1970-2009, the warming rate was +0.16 degrees per decade, at a time when sunspot numbers *fell* at an average rate of 9 per decade-so its an "apples & oranges" comparison! 3) Negative effect from clouds: as has been pointed out numerous times before, clouds act as both a negative & positive forcing. Yes they increase the Earth's albedo, but they also act to trap more IR radiation as it heads out to space. Lindzen suggested that an increase in the Iris Effect would provide a negative feedback for CO2 induced warming-by reducing the clouds that help trap IR radiation in the lower atmosphere. However, the CERES satellites showed that the Iris effect lets more radiation *IN* than it lets *OUT*, thus providing a modest *positive* forcing. I'd debunk argument number 4 too, except I don't understand what you mean by the question! -
Marcus at 19:25 PM on 13 June 2010How climate skeptics mislead
If UHI is as strong as you claim, BP, then why are ground station measurements (+0.17 degrees per decade since 1979) so close to those calculated by satellite measurements (+0.14 to +0.16 degrees per decade since 1979). The reality is that the entire premise of Spencer's argument is totally false-which is that adjustments aren't frequently made to account for UHI effect. Indeed, Spencer himself has a habit of failing to adjust his own satellite data to account for diurnal drift, so maybe he wrongly assumes that those on the ground are making the same basic error (which is why his readings are +0.02 degrees per decade cooler than those provided by RSS). Of course, even *if* the adjustments were not being made, several studies have shown that the difference between so-called "good" & "bad" stations is absolutely negligible. -
Berényi Péter at 18:20 PM on 13 June 2010How climate skeptics mislead
#15 ProfMandia at 13:17 PM on 13 June, 2010 How much has the population grown over the oceans? Dear prof, I was talking about UHI, which obviously occurs only in land records. Oceans is another issue which should be discussed separately. I am sure you would not be happy either if at an exam a student in reply to a specific question would start talking about something else. The only legitimate way for you to refute Dr. Spencer's finding (which I have moved a step further by quantifying the effect) is to point out specific errors in the specific study. Simple handwaving or changing of topic would not do.
Of course it is only a first approximation, so the actual numbers may be slightly different. Proper correction may be variable over time and space as well, since population growth was uneven. Also, the huge decrease in number of GHCN stations after 1990, especially urban ones is not taken into account here.
There is certainly room for improvement but it would be nice to see the guys who are responsible for it doing their job instead of someone with no time and resources.
Simple handwaving or changing of topic would not do.
Of course it is only a first approximation, so the actual numbers may be slightly different. Proper correction may be variable over time and space as well, since population growth was uneven. Also, the huge decrease in number of GHCN stations after 1990, especially urban ones is not taken into account here.
There is certainly room for improvement but it would be nice to see the guys who are responsible for it doing their job instead of someone with no time and resources.
-
actually thoughtful at 17:50 PM on 13 June 2010How climate skeptics mislead
Some recent posts, this one included, seem to be aiming for the low end of the food chain (WUWT). So you are fighting deniers - simple, easily refuted arguments. But there are skeptic sites - like The Air Vent and The Blackboard for example - that present arguments that are both more sophisticated and more honest. Recent topics there that have left me wondering are: 1) Given little change to the entire antarctic ice sheet - how much of the arctic ice sheet is due to wind and currents - ie seasonal variation. 2) They point to the warming trend from the 1900-1930s (not sure of the dates here) - but it is a trend that lasted as long as the current, and has a similar slope. 3) Negative response from cloud cover 4) They invoke trends longer than we have had decent instrumentation that account for some of the warming. These folks acknowledge that first order CO2 forcing. They question the extent of negative feedbacks. While the balance of evidence and logic seem to support AGW - I sometimes think people are "cherry picking" the easy/dumbest things the true deniers say, and lumping all questions about the logic and science in with the low quality points - leaving some valid counter-arguments unexamined. -
RSVP at 17:46 PM on 13 June 2010How climate skeptics mislead
It is not the amount of data that makes a theory true. For centuries people believed that the Earth was flat based on a multitude of "evidence". Data on its own does not lead to the truth and can be very misleading indeed if applied to a false hypothesis. And as long as alternative theories are not openly discussed, we are all that much poorer. Furthermore, the comment about false readings taken from weather stations due to air conditioners, carparks and parking lots is a strawman if there ever was one. -
Paul D at 17:32 PM on 13 June 2010Is the long-term trend in CO2 caused by warming of the oceans?
I'm thinking that it might be useful to grade 'fingerprints' into primary and secondary (or more) classes? So that a secondary fingerprint is dependent on a primary fingerprint for its validity? eg. on it's own a secondary fingerprint may not indicate a specific scenario, but in a broader sense does in this case indicate increasing CO2 emissions from a source. -
chris at 17:11 PM on 13 June 2010Monckton Chronicles Part IV– Medieval Warm Period?
Passing Wind at 15:15 PM on 12 June, 2010”Abraham is using this devise to deflect the fact that Monckton accurately cited paper about regarding the MWP and to paint Monckton as dishonest for not having contacted them.”
But we’ve already seen that Monckton hasn’t “accurately cited paper about regarding the MWP” (sic). That’s the point isn’t it Passing Wind? If you’re going to cite something is support of an assertion the cited article should properly support that interpretation.”Anyone writing an academic paper is entitled to take a written work as it stands. Even if they are claiminbg the earth is flat. If this were not the case, people could publish anything they wanted, then claim you misrepresented them for quoting it because they have changed their mind, or the opinion they expressed is no longer the "company line".
That’s an astonishing misrepresentation of ethical and honest scientific communication. If one makes a specific statement [“….. the Medieval Warm Period was real, was global, and was warmer than the present. That is the scientific consensus…”], then the papers one cites in support of this statement must be an honest depiction of the state of the relevant science. It’s simply unacceptable to choose old papers that seem to support a position without considering subsequent work, or to pretend that a tiny set of papers that doesn’t represent the “scientific consensus”, does. Ignorance (and contrived ignorance) is no excuse whatsoever. Assessing the evidence properly is always done by those that try to communicate the science. If you're uncertain of the relevance of a paper in the context of the field you look at the set of papers that later cite it. There are scientific databases for this; alternatively you use Google Scholar. That way you establish whether the paper has remained valid and properly represents the issue being addressed. Everyone who attempts an honest communication of the science does this. For scientists and honest communicators it’s second nature, and it's simply not possible to do or communicate science otherwise. Not doing so is cheating and an insult to one’s audience. Your understanding of basic issues of scientific ethics seems to be askew on this..... -
caerbannog at 16:54 PM on 13 June 2010How climate skeptics mislead
(From 12 above) #11 David Horton at 11:26 AM on 13 June, 2010 how do I explain that to the glaciers? No need to explain them, they are not sentient. Just filter out soot from smoke. And the satellites. What about the satellite MSU data? Soot problems there, too? -
caerbannog at 16:49 PM on 13 June 2010How climate skeptics mislead
Regarding the "global warming is caused by air conditioning" meme mentioned above... ...It should be noted that many air conditioners function as heat pumps during the winter. So it would seem to me that thermometers located near air-conditioning/heat-pump exhaust outlets should demonstrate, on average, a "cold bias" during the winter months. Has anyone involved with the surfacestations project considered this? -
Philippe Chantreau at 16:33 PM on 13 June 2010How climate skeptics mislead
BP, that blog post from Spencer seems to be only a blog post. Is it published? If not, why not? Considering it is not open for comments, it is conveniently shielding itself from even "blog review." If that's all there is to it, I am unimpressed. What does real science say about UHI and how it's dealt with in the data? Doesn't SkS have a post on that, linking real science papers? Why would it deserve less credence than Spencer's? How much scrutiny have you applied (as a genuine skeptic would) to this blog post? As much as you do to so-called "pro-AGW" peer-reviewed science articles? You cite it but do not provide any kind of critical analysis, where is your skepticism? What exactly is the "warm bias" on the graph and how is it calculated? How does this explain the SST increase? Thingadonta has a very wordy post that equally fails to impress me. Skeptics are concerned with exaggeration eh? What does one find on skeptic blogs? Stuff like this: http://wattsupwiththat.com/2010/05/25/the-western-snowpack-is-137-of-normal/ Averaging percentages, without giving it much thought. Talk about exaggeration. How convenient. What would happen if so-called "pro-AGW" serious sites like RC did the same kind of abysmally stupid maths? Oh, the uproar. But, of course, that's never going to happen because the standards are different on RC. And this is just one in a long history icluding carbonic snow, and what not. What a joke. But there is more. What do we find in that thread? uncritical rants. How many "skeptics" apply their skepticism to the o.p.? I counted 2 before deciding that, since I have only one life to live, filling even a tiny amount of my time with the kind of stupidity found there could be a mortal sin. It's not like I don't have better things to do. They just go on ranting about how much snow they had this winter. Where is the subtantive discussion on data? Why is none of the regulars there addressing the stupid maths? Why is nobody saying tha the 137% figure is misleading? On the 2008 science blog of the year? That's what GW skepticism is, mostly (I should say overwhelmingly). I'm as unimpressed as ever. The worst part of it, and the one that applies even to the better quality skeptic contributors here, is the double standard. One-sided skepticism is no skepticism at all. Especially when it has mouthfuls of "bias" to spray on everybody. I'll just keep looking at what real scientists, doing real work, publish. I can't understand a lot of it, and it certainly isn't perfect. Yet it is still a better use of my time than "skeptic" internet stuff like the Spencer's post you linked. -
caerbannog at 16:17 PM on 13 June 2010Is the long-term trend in CO2 caused by warming of the oceans?
Gallopingcamel, give it up, for the following reasons: 1) We know how much carbon has been burned by human activity over the past few decades, and if all the carbon-dioxide produced had remained in the atmosphere, atmospheric CO2 levels would be much higher than they are now. So we *know* that the external environment (oceans, soils, etc) have acted as a net carbon *sink*, not a source. This is straightforward middle-school arithmetic. 2) The falling pH of the oceans indicates that the oceans have been *absorbing*, not releasing, CO2. This is straightforward freshman chemistry. Consult almost any freshman college chemistry textbook for more details about this. 3) Atmospheric O2 concentrations have been falling (not enough to cause any problems, but enough to measure), and they have fallen in a manner completely consistent with the amount of fossil-fuels burned by humans. 4) C14/C12 ratios up to 1950 (beginning of atmospheric testing) track human fossil-fuel use up to that date very nicely. Even with C14 contamination due to nuclear testing, the C14/C12 ratio over time gives us plenty of evidence that humans have put lots of fossil-fuel carbon into the atmosphere. After atmospheric nuclear testing ceased, the C14/C12 ratio began declining from the "nuclear testing spike" in a manner consistent with fossil-fuel combustion. We have plenty of C14/C12 data preceding and following atmospheric nuclear testing to show that humans were dumping lots of fossil-fuel carbon into the atmosphere. So like I said, gallopingcamel, just give it up. Or better yet, sign up for an introductory Earth-science course at your local community college instead of wasting your time (and your brain cells) on Anthony Watts idiocy. -
citizenschallenge at 15:13 PM on 13 June 2010How climate skeptics mislead
penguindreams I really like how you explained that so I'm going to repeat it (the rest of your post also made sense.) ~ ~ ~ ~ ~ ~ ~ at 09:50 AM on 13 June, 2010 I like E. O. Wilson's term consilience. Evidence converges towards one conclusion from a wide variety of directions. Any given line (every line) has some possibilities for error. But those possibilities and routes of error are different between the different lines. There is consilience between lines of evidence as wildly different as sea level, global thermometer networks, and the times of flowers blooming in the spring. (And many, many, more.) They all have sources of error, but each source of error could as easily point to cooling as warming. Yet there is consilience that the earth is warming. -
Sean A at 15:04 PM on 13 June 2010How climate skeptics mislead
thingadonta, it doesn't seem like you understand how science works. Bias gets filtered out. Results are independently replicated and verified&mdash if they're not, they get tossed out. Good scientists are highly skeptical and put ideas "through the wringer" before *cautiously* starting to accept them as possible, provisional descriptions of reality. Nothing is ever "settled" in science, if new data comes along, or a better explanation that fits the data, the old ideas get tossed out the window. What you've described is nothing like science. Science is not about "consensus building". That sounds like politics, or simply personal opinion. The IPCC is decidedly conservative. Their conclusions are toned down, not exaggerated. -
citizenschallenge at 15:02 PM on 13 June 2010How climate skeptics mislead
MattJ #1 You are doing the scientists a disservice - it is not like they are the ones that located those weather stations. There were other entities doing that and many of those station were established before global climate became a central issue. Another red herring! ~ ~ ~~ ~ ~ ~ The scientist worked with the data available to them - -
monckhausen at 14:50 PM on 13 June 2010How climate skeptics mislead
Skeptics do mislead. That's a real oxymoron - a very kind labelling of somebody who cheats but expects people like us and the scientists to play by the rules. Derek, FoGT -
Sean A at 14:44 PM on 13 June 2010How climate skeptics mislead
We've got multiple, independent sources of temperature data, both surface and satellite based, that are in pretty good agreement. Objectively, the trend is significant warming. So can we at least agree that global warming is real? -
Sean A at 13:30 PM on 13 June 2010Is the long-term trend in CO2 caused by warming of the oceans?
gallopingcamel #40, there are 3 different articles on RC, including that one, that explain how we know that the increase in CO2 is due to fossil fuel burning. Isotope ratios are just part of it. From direct measurements, the amount of CO2 in the oceans is increasing. -
thingadonta at 13:30 PM on 13 June 2010How climate skeptics mislead
Your argument still misses the point. Skeptics are primarily concerned about exageration. Even the more extreme skeptics concede that c02 causes warming, the question is how much (negative /positive feedbacks), and that necessarily means exageration on various levels is a key issue. They key quesiton is overall climate sensitivity, and urban surface temperatures, for example, are being used to bolster up higher climate sensitivity estimates and formulate policy. Urban heat islands are not melting glaciers, but skeptics contend that glaciers are melting largely naturally, and superficially enhanced urban surface temperatures are being used to falsely bolster the case for higher climate sensitivity. There is another isuse skeptics are concerned about which your arguemnt doesn't mention or understand in the slightest. I would call it a 'manufactured' or 'superficial consensus'. Now before you stop reading, this doesnt mean conspiracy, it is simply human bias, or noble cause corruption. Some people's basic philosophical position is to bring 'order' and 'consensus' to a chaotic world, but skeptics contend this can be a dangerous or two-sided basic philosophical foundation, because inconsistency and disorder (chaos) is a fundamental principle of both nature and society, which means it is very easy for a 'manufactured consensus' to ignore the scientific reality (change/disoder/chaos). Skeptics contend that 'manufactured consensus' goes on all the time, and is very dfficult to eliminate, as in "The Hithchikers Guide to the Galaxy" when two war lords are at the table and one of them mutters something which turns out to be offensive to the other's mother without realising it, and all out war in unleashed. It happens (almost) without intent. Skeptics contend that claiming a 'consensus of evidence' with current climate data is a form of noble cause distortion/corruption. Whenever something crops up which doensn't fit the model, some research is carried out which inevitably comes up with an angle which 'makes' it fit, but in many cases such a 'fit' is entirely ambiguous. The bandwagon followers then proclaim, 'it turns out that is supports strong AGW etc etc', when the data makes no such conclusion. Skeptics contend this happens frequently. Therefore, there is no 'consenus of evidence', and overall climate sensitivity is still rightly debated. People in other fields such as anthrolopolgy and physics understand this process a bit better it seems. No one claims that 'dark matter' for example is a given because the data is still ambiguous. Anthrolopoloigsts consistenly find bones of hominids exactly fitting the model they were trying to prove, until somone finds another set of bones which leads to a different interpretation. They accept this sort of human bias, but they dont want to change the economy because of it. Becuase of this frequent distortion of 'consensus', skeptics are always trying to pick holes and weaknesses in the arguments, which is entirely reasonable given the process of human bias above. But your argument suggests all such is misguided. We should trust the funding and peer review process, the scientists. I think the diasgreements come from a different perspective of basic human nature, and a learned lack of faith in the current peer review process. I'll give some concrete examples, off the top of my head. There is no evidence that volcanism was stronger in the Cretaceous and that is why the c02 levels were higher and T was warmer. It is a superficial consensus focred to fit into the 'model'. Possibilities ignored include continental configuration and changes to ocean currents. There is no evidence that oceans acidified dramatically fast during mass extinction events and coral reefs collapsed in short periods of time, the process appears to be very slow, meaning we don't know how ocean chemistry responds to very short term c02 rises. Evidence ignored includes the oceans not diverging more than 0.6pH in the last 300 million years, which implies they are strongly buffered to c02 changes (eg dissolution/precipitaiton of carbonate sediments in the subsurface, which is larger in area than all the worlds coastal shelfs). To say that coral reefs will 'become eroding structures in 30 years' by ignoring this sort of doubt is simply following a constantly manufactured consensus. I am not using these examples as particually good examples of underlying doubts, just examples of where ambiguous data is made/manufactured to fit into a general model. It goes on all the time. We dont know cloud cover during the Little Ice Age or the MWP and how this affected T. We dont know overall climate sensitvity. Many other examples could be given. Skeptics will continue to focus on small pieces, big pieces, the big picture and the small picture, for as long as there is human bias, and until we have very strong confidence in overall climate sensivity, which even the politically charged, 'we exagerate for political reasons' IPCC, is unsure about. -
ProfMandia at 13:17 PM on 13 June 2010How climate skeptics mislead
Berényi Péter: How much has the population grown over the oceans? Must be a lot of UHI there because T trends over those regions are pretty close to those over land. Why does this dead horse keeping trying to get up? Scott A. Mandia, Professor of Physical Sciences Selden, NY My Global Warming Blog -
mothincarnate at 12:10 PM on 13 June 2010How climate skeptics mislead
That's more or less my general argument; that there are so many lines of evidence and impacts that the argument of AGW is pointless, meaningless and provokes inaction in the face of so many issues. One thing that I'd like to say, however; I wouldn't say that "species are becoming extinct". More accurate would be to say that current extinction rates are being further exaggerated by climate change. We know that our land change use is already having a massive impact on biodiversity, but with climate change impacting on distribution (tending to shift further from the equator) and ecological cues (ie. first bloom, nesting etc), this is having a detrimental effect on species and community fitness. Then acidification of surface waters... These are happening, regardless of the first comment here "not much warming is left" of which I'm happy to provide a list of papers. Cheers, Tim -
Uncle Pete at 12:10 PM on 13 June 2010How climate skeptics mislead
Actually air conditioners do at least contribute to global warming, as most of them are in the US and they suck up untold Megawatts of electric power , which in turn is mainly generated by coalfired powerstations. :) -
Berényi Péter at 11:31 AM on 13 June 2010How climate skeptics mislead
#11 David Horton at 11:26 AM on 13 June, 2010 how do I explain that to the glaciers? No need to explain them, they are not sentient. Just filter out soot from smoke. -
David Horton at 11:26 AM on 13 June 2010How climate skeptics mislead
"Not much warming is left. " Phew, there's a relief. But how do I explain that to the glaciers? -
Berényi Péter at 11:15 AM on 13 June 2010How climate skeptics mislead
#6 Dan at 10:04 AM on 13 June, 2010 It is hard to worry much about "sloppy" surface data No, it is not hard. Just criticism is largely misplaced.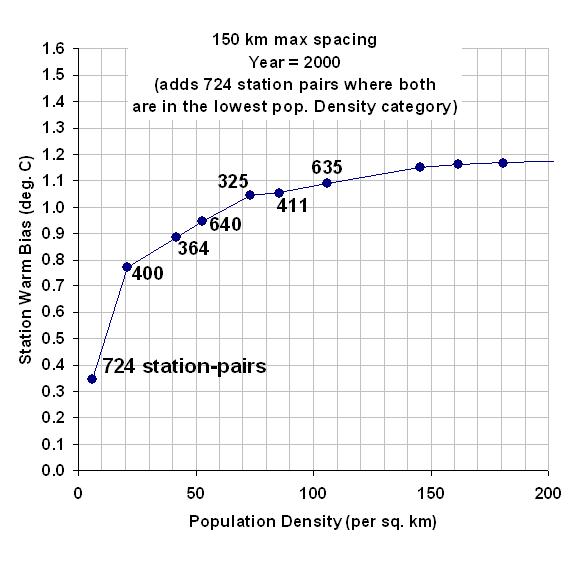 The Global Average Urban Heat Island Effect in 2000 Estimated from Station Temperatures and Population Density Data
by Roy W. Spencer, Ph. D.
You can see, as UHI is roughly proportional to the logarithm of population density, the problem gets really serious only with stations in the least densely populated areas.
UHI effect is roughly logarithmic with
ΔT = 0.23×log(0.66×d)
where d is local population density per km2.
As global population density between 1900 and 2008 has increased fourfold, in first approximation this effect alone can explain about a 0.23×log(4) ~ 0.32°C increase in global average surface temperature during this period as measured by meteorological stations.
However, as relative abundance of stations flagged rural in GHCN has increased recently, the actual figure must be higher (because at low population density the curve is steeper).
Not much warming is left.
The Global Average Urban Heat Island Effect in 2000 Estimated from Station Temperatures and Population Density Data
by Roy W. Spencer, Ph. D.
You can see, as UHI is roughly proportional to the logarithm of population density, the problem gets really serious only with stations in the least densely populated areas.
UHI effect is roughly logarithmic with
ΔT = 0.23×log(0.66×d)
where d is local population density per km2.
As global population density between 1900 and 2008 has increased fourfold, in first approximation this effect alone can explain about a 0.23×log(4) ~ 0.32°C increase in global average surface temperature during this period as measured by meteorological stations.
However, as relative abundance of stations flagged rural in GHCN has increased recently, the actual figure must be higher (because at low population density the curve is steeper).
Not much warming is left.
-
Marcus at 11:08 AM on 13 June 2010How climate skeptics mislead
@ Dan (post #7). I think This video really highlights the point you're making about people padding their resumes to make themselves sound more credible on this issue. Like the guy says (ok, so I'm paraphrasing here)-"would you go see a GP to get brain surgery done? NO-then why do we trust weathermen or Classics Graduates for their OPINIONS on climate change?" -
Marcus at 10:56 AM on 13 June 2010Monckton Chronicles Part IV– Medieval Warm Period?
No, PW, Monckton's presentations are loaded with FALSEHOODS-not errors. He KNOWS that what he is presenting is WRONG, but continues to give the presentations anyway. Just look at his initial reaction to Abraham's criticisms-he refused to admit a single error (even the obvious ones) & instead focused on ad-hominem attacks of Abraham (all the while demanding a level of respect that he has failed to show to others-the HYPOCRITE). Compare that to Abraham's very calm & measured rebuttal of Monckton, & its all too easy to see who the con-man is, & who the genuine scientist, following correct lines of inquiry, is-its just a shame that you can't figure it out. For the record, I personally don't like Al Gore that much, but his presentation in "An Inconvenient Truth" was not filled with the deliberate lies & misrepresentations that Monckton uses. Indeed, his documentary involves interviews with the *actual* scientists in the field-something Monckton would *never* do, because he KNOWS they won't support his outlandish claims. Also, I've yet to hear Gore attack his detractors in the same venomous, ad-hominem way that Monckton attacks his detractors. You also hilariously claim that if people want to believe Monckton's lies, then that's *their* business. Yet when those people who choose to believe him control our ability to take action to reduce the world's Greenhouse Gas emissions, I'd say it actually becomes *everyone's* business. Your assertion is akin to saying "oh sure that cult leader is encouraging his flock to commit murder, based on his misrepresentation of the bible, but it's *their* right to believe him". What complete & errant nonsense. So I applaud Abraham's efforts in debunking Monckton, because then maybe more people will treat his message with a little more *genuine* skepticism. However, when I read the posts of people like yourself, PW, who desperately try to defend Monckton-even after all his LIES are laid bare-I realise that some people who are only "skeptical" when it suits their interests. Lastly, in spite of your claim above, its obvious to anyone reading that you have a VENDETTA against Abraham because he has attacked your beloved Monckton. From the moment you started commenting on these posts, you've shown a barely restrained HATRED of Abraham-using the most pedantic things to attack his credibility on-whilst letting Monckton completely off the hook. Again, this makes me doubt your self-proclaimed "neutrality" in this matter-a view I'll continue to hold until you can provide something approaching GENUINE PROOF that Abraham has deliberately sought to mislead his audience. -
Tenney Naumer at 10:49 AM on 13 June 2010How climate skeptics mislead
This is an excellent post because it is both clear and succinct. -
scaddenp at 10:30 AM on 13 June 2010Increasing CO2 has little to no effect
TOP - because H2O is FEEDBACK. Any forcing,= that raises the temperature of atmosphere will increase the water content and thus the GHG effect from it. If you want to know about the FORCING due to increase in anthropogenic gases then you need to filter out the feedback. -
Dan at 10:20 AM on 13 June 2010How climate skeptics mislead
Keep up the good work. You're doing a great service. By the way, another common method (this is not news, I'm sure) by which climate skeptics mislead is by bluffing credentials and experience. It is as effective as twisting facts, but safer, because they are rarely challenged. People are too busy and too aware of their own lack of science training to find out things. It is usually fairly effective to believe an expert. So, self-appointed climate rebels who feel that AGW is all a hoax spend a fair bit of their argument with falsehoods about their own positions as "renowned" scientists, the smartest and the first, etc., when the opposite is usually true. The British have a good word for it: puffery. A complete nobody in climate science can look into the TV camera and say "I am one of the few people qualified to speak about climate change", and people believe the next malarkey that comes out of his mouth. Amazing. The deniers get away with arguing from (falsely attributed) authority because the future of the planet is not important enough for the rest of us to challenge personal claims. That could be embarrassing. -
TOP at 10:05 AM on 13 June 2010Increasing CO2 has little to no effect
Curious but when showing changes in absorbtion of infrared why is the contribution from H2O always filtered out? It would seem to me that this would become more positive as the atmosphere warms. -
Dan at 10:04 AM on 13 June 2010How climate skeptics mislead
It is hard to worry much about "sloppy" surface data weather collection when we see results like this: http://www.skepticalscience.com/Is-the-US-Surface-Temperature-Record-Reliable.html Quote: "The work of surfacestations.org is useful in clarifying one point - microsite influence has imparted little to no warming bias in the U.S. temperature record." -
villabolo at 09:59 AM on 13 June 2010How climate skeptics mislead
John Cook says: "Skeptics claim thermometers are unreliable because surroundings can influence the reading. They reinforce this by showing photo after photo of weather stations positioned near warming influences like air conditioners, barbeques and carparks. The Skeptics Handbook goes so far as to say "the main 'cause' of global warming is air conditioners"." I remember in grade school seeing a wall unit air conditioner running full blast on a hot summer day with a shimmering appearance right outside the window that gave the impression of something rising up right from behind the A/C. That was the hot air exhaust. The fact is that hot air rises immediately, not after it travels 20 or more feet horizontally to swirl around the thermometer. -
penguindreams at 09:50 AM on 13 June 2010How climate skeptics mislead
I like E. O. Wilson's term consilience. Evidence converges towards one conclusion from a wide variety of directions. Any given line (every line) has some possibilities for error. But those possibilities and routes of error are different between the different lines. There is consilience between lines of evidence as wildly different as sea level, global thermometer networks, and the times of flowers blooming in the spring. (And many, many, more.) They all have sources of error, but each source of error could as easily point to cooling as warming. Yet there is consilience that the earth is warming. mattj: I haven't read a lot of the 19th century literature about collecting surface air temperatures and sea surface temperatures, but some. I think it's quite a stretch to condemn people 100 years ago for not having collected their data in ways that we in 2010 wish they would have. If you read their work, they were clearly trying to collect the best possible observations, in the best possible way, as they understood it at the time, and for the purposes they were collecting the data at the time. 30, 70, 130 years later, we're trying to do different things with the data, in different ways. That's our problem. Calling them 'sloppy' for not anticipating our interests and methods doesn't strike me as fair to anybody, or useful for anything. -
gallopingcamel at 09:47 AM on 13 June 2010Is the long-term trend in CO2 caused by warming of the oceans?
caerbannog (#39), As you point out there was a huge spike in C14 in the 1960s which swamps any changes due to increased burning of fossil fuels. I guess that idea won't fly. doug_bostrom (#21), That article you linked is the one I must have read earlier. I forgot that it concerned C13/C12 ratio. As that article is six years old I tried to find something more recent: http://wattsupwiththat.com/2008/01/28/spencer-pt2-more-co2-peculiarities-the-c13c12-isotope-ratio/ Now I am really confused. -
Berényi Péter at 09:38 AM on 13 June 2010How climate skeptics mislead
neglecting the full picture Scientific approach is not about pictures and it is definitely not holistic. Whenever pieces of the full picture don't withstand analytic scrutiny, those pieces should be abandoned, even if they seem to be consistent with multiple lines of evidence. This is the nature of the scientific method. Techniques suggested by the way people contemplate on Rorschach figures may be indispensable heuristic tools, but as soon as a hypothesis is formed, one should switch from vision to cold logic.
-
ProfMandia at 09:19 AM on 13 June 2010How climate skeptics mislead
John, It is a good idea that you keep recycling this theme lest some get lost in the straws. I keep stating that there are three conclusions: 1) An overwhelming majority of international climate experts agree about much of the tenets of AGW and are honest. 2) An overwhelming majority of international climate experts are ignorant about their own expertise in a sudden and collective manner. (Claims of group think included.) 3) These scientists have all agreed to conspire to delude the billions of folks on the planet and just a very tiny percentage of them (and mostly oil-funded and unpublished) are trying to save us all from this mass hoax. Common sense and a sense of probability should lead one to the likely correct choice above. Scott A. Mandia, Professor of Physical Sciences Selden, NY My Global Warming Blog -
MattJ at 09:17 AM on 13 June 2010How climate skeptics mislead
This article is good, but I think it misses at least one important point. True, other lines of evidence do support global warming, but scientists did themselves and the world a disservice by such sloppy methods for gathering surface temperature data. The sarcastic rejoinder "global warming is caused by air conditioning", is all too potent a tool for a political PR slogan. Remember: science alone cannot stop global warming. Radical political action is needed as well. Such action will happen: the question is whether it will happen now, with little bloodshed, or later, with massive bloodshed and loss of life due to emerging diseases and vanishing habitat. -
chris at 03:53 AM on 13 June 2010Monckton Chronicles Part IV– Medieval Warm Period?
Passing Wind at 15:15 PM on 12 June, 2010 You suggest in relation to the graphs Monckton showed as a backdrop to his assertion that ""....the Medieval Warm Period was real, was global, and was warmer than the present. That is the scientific consensus.....", that "..he was absolutely correct in using them.” Since at least 6 of the graphs don't support his assertion at all it's difficult to understand your approval, unless you consider that it's immaterial what one shows when asserting blatant falsehoods. Let's look at one of these in more detail. Monckton shows a sketch of broad climate regimes attributed both to” Dansgaard (1969)” and to “Schonweise” [sic] “(1995)”. The Dansgaard paper was written 40 years ago at a time when our understanding of past climate was poor in detail and before the major warming of the last 30-odd years that we obviously have to consider when assessing (as Monckton claims to be doing) the relationship between present temperatures and the MWP. However Schonwiese (1995) is rather more recent. This presumably refers to a book [Schonwiese, C.D. (1995): Klimaanderungen, Daten, Analysen, Prognosen. Springer Verlag, Berlin] which I can't access. It isn't from the single paper that Christian Schonwiese wrote in 1995 as can be easily determined by inspection: Schonwiese C D and Bayer D (1995) Some statistical aspects of anthropogenic and natural forced global temperature-change Atmosfera 8, 3-22 Luckily we can look at a paper Dr. Schonwiese wrote in 1997 which contains a slightly modified version of the graph that Monckton shows (see top middle graph in Figure 2 of the article at the top of this thread). What can we conclude about Dr. Schonwiese's understanding and depiction of the relationship between current temperatures and temperatures during the MWP in 1997? The graph is shown in Figure 1 of: Schonwiese CD (1997) Anthropogenic and natural signals in climate variations Naturwissenschaften 84, 65-73 This graph shows essentially the same sketch as depicted in Monckton’s Powerpoint slide, but extends the temperature to the present as well as predicting 100 years into the future. The MWP has a temperature max ~15.4 oC. It’s not easy to determine what the current temperature is since Schonwiese has a rapidly rising temperature squashed into the right hand side of the plot and it’s not completely obvious where the current temperature becomes the projected temperature. However current temperatures seem to be in the range ~15.7 - ~16.3 oC. Incidentally he considers that temperatures will continue to rise in the 100 years (from 1997) to around ~ 19 oC although he labels a range between 17.5 – 20.5 as uncertain (“unsicherheit”). In other words it’s very difficult indeed to consider that Dr. Schonwiese’s work from the mid-1990’s could be used to support the assertion that the MWP was warmer than now. Again the opposite interpretation seems warranted from Monckton’s supposed source. Likewise it would seem that Dr. Schonwiese was rather concerned in 1997 about very significant warming in the coming decades. Note that we can’t use this figure to say anything about the global nature of the MWP since it’s clear that the sketch refers to Northern hemisphere temperatures. If we’re not totally certain (since Dansgaards and Schonwiese’s figure copied by Monckton is obviously a sketch) we could look at Dr. Schonwiese’s more recent work. In a paper published earlier this year [*] he assess likely anthropogenic contributions to warming since 1860. The total warming is around 0.8-0.9 oC globally (1.0-1.1 oC in the NH).; Schonwiese determines that pretty much all of this (less around 0.2 oC natural contributions) is due to anthropogenic greenhouse forcing, somewhat tempered by atmospheric aerosols. If we add this temperature rise to the temperature around 1860 in the Dansgaard/Schonwiese sketch that Monckton shows, then the current temperature is around 16-16.1 oC compared to 15.4 oC at the MWP max. [*]Schonwiese CD, Walter A, Brinckmann S (2010) Statistical assessments of anthropogenic and natural global climate forcing. An update. Meteorologische Zeitschrift 19, 3-10. In other words the Dansgaard/Schonwiese graph that Monckton shows in support of his bogus assertion actually supports the conclusion that the MWP was significantly cooler than now. Now, most people might say that it’s difficult to draw major conclusion about past temperatures from a sketch. However you (Passing Wind) have asserted that Monckton is ”absolutely correct” in using this to accompany his bogus assertion about what the scientific evidence shows. -
Doug Bostrom at 03:36 AM on 13 June 2010Monckton Chronicles Part IV– Medieval Warm Period?
PW, while the debate is about politics the science leading to that debate is quite separable from that discussion and in fact will more or less continue on its trajectory regardless of what happens in the political arena. -
Doug Bostrom at 03:33 AM on 13 June 2010There is no consensus
Daniel, while it may be true that 20% of earth scientists have problems with the concept of anthropogenic warming, the number of scientists who have published work supplying a strong workable alternative hypothesis that meshes well with a complicated web of other findings not even necessarily directly related to issues of climate is essentially nil. An opinion is not science. -
caerbannog at 03:00 AM on 13 June 2010Is the long-term trend in CO2 caused by warming of the oceans?
You would expect a rise in C14 if vegetation was responsible. The reason C14 isn't a reliable indicator now is due to nuclear weapons tests in the 50s/60s. As a method for distinguishing fossil-fuel carbon from carbon taken up by living (or recently living) vegetation, the C14 method is still useful. It is true that atmospheric nuclear tests added C14 to the atmosphere -- but that means the amount of C14 present in living vegetation has been boosted, making it even easier to differentiate living sources of carbon from (completely C14-depleted) fossil sources. The boosted C14 background level, if anything, might make it *easier* to detect the introduction of C14-depleted carbon. Furthermore, the impact of nuclear testing on atmospheric C14 concentrations has been well-studied, allowing scientists to make the necessary calibrations/adjustments for C14 dating. But in the case of fossil fuels vs living vegetation, we don't need to do any fine-grained dating calculations, because we know that fossil-fuel carbon is completely C14 depleted (no need for hair-splitting calculations re: C14 concentrations). That is, either the material has C14 or it doesn't. Furthermore, the last atmospheric nuclear test was conducted over 35 years ago, so there haven't been any really recent nuclear perturbations of atmospheric C14 concentrations. -
Philippe Chantreau at 01:46 AM on 13 June 2010Monckton Chronicles Part IV– Medieval Warm Period?
PW, why did you not check Monckton's claims in the first place? That would have been a better way to sort things out. -
Paul D at 01:05 AM on 13 June 2010Is the long-term trend in CO2 caused by warming of the oceans?
Re caerbannog. Yeah, just looked at the New Scientist myth busting page and fossil fuels are distinguished from veg by the lack of C14. Thanks for that snippet. You would expect a rise in C14 if vegetation was responsible. The reason C14 isn't a reliable indicator now is due to nuclear weapons tests in the 50s/60s. http://www.newscientist.com/article/dn11638-climate-myths-human-co2-emissions-are-too-tiny-to-matter.html -
Paul D at 00:54 AM on 13 June 2010Is the long-term trend in CO2 caused by warming of the oceans?
Yes but Marcus, is not the CO2 stored in the ocean a mixture of vegetation and non-vegetation sources? That's what is bugging me a bit about the C13/C12 issue. -
Passing Wind at 00:12 AM on 13 June 2010Monckton Chronicles Part IV– Medieval Warm Period?
Marcus, Clearly you are uncomfortable unless you are pigeonholing opponents. If I wanted to make easy points I would have posted on what you call a "denialist" blogs and sat back to bask is glory because nobody there would have questioned my arguments at all. For the record, my view is that the science is far from settled, and both sides are manifestly overstating the certainty of their case. Monckton is showman and not a scientist, so a) it doesn't surprise me if his presentation contains errors, and b) I would not turn to a showman for anything other than entertainment. He is no more credible and just as error prone as Al Gore. What galls me is how Abraham's claims have been swallowed whole by the pro AGW blogs - errors and all. How many people that are posting congratulatory comments have bothered to fact-check even one single claim Abraham has made? I'll bet you that some of those, "I'll swallow whatever claims my side makes guys", have for the first time actually looked at some of the underlying questions because of these exchanges we have been having. What about all those people that think Monckton is presenting a true and factual show without cross-checking his claims, I hear you ask? If they want to believe showmen, that's there problem. I don't, and I doubt you do. I am demanding a higher level of accountability and scrutiny from all sides. Right now Abraham is in my sights because he stuck his head up to attach Monckton. When Monckton releases his promised rebuttal, I will scrutinize his work too, only doubly so, because I will check his rebuttal against his original claims as well. Like it or not, AGW is as much a political debate as it is a debate about the science. -
daniel at 00:04 AM on 13 June 2010There is no consensus
Clearly this article shows that approximately 1 in every 5 earth scientists could not say that AGW was a fact. Also that 1 in every 4 non-climatoligists could not say that AGW was a fact. I know that's not a majority for the anti-AGW view and you could say that it is a general consensus for the pro-AGW view but when expressed this way (rounding to the nearest integer of course) I believe the true extent of dissent is portrayed. What is frustrating is that in the media the word "consensus" is used often with the catch phrase "a handful of dissenters" or "deniers" or "trouble makers" or something like that, but that is clearly not the case. ~20% is not an insignificant figure. I also make the point that those of us in fields other than the earth sciences who criticise climate science for poorly collected and presented data coupled with poorly argued conclusions (in my/our opinion of course), specifically on AGW, would not have a high level of respect for the publications that come from climatology and to a lesser extent earth sciences on this issue. You are not providing much of an argument to us by quoting phrases like "peer-review" and "consensus" when refering to climate science. If wikipedia's explanation of the peer-review process is accurate then in light of the figures given in the article above, the "peer-review" process in the field of climatology (or more widely in earth sciences) may be a very biased excercise indeed. Here is a link to the article: The wikipedia article seems to imply that only a few reviewers are needed as a minimum and the editor of a journal does not need a consensus amongst them since their role is advisory only. The wikipedia article implies that only "experts in the field" would be invited to review and so the survey results provided in the article above reveals an obvious potential for group think during the peer-review process. A survey of scientists outside of these disciplines would be much appreciated. How often is it said that climatology is a relatively new field? Well then... let some of the professors in the more distant fields of Physics, Chem, Mathematics and Statistics "Peer-review" these articles and we will see what kind of conlcusions are published then. It is ultimately a discipline on trial and I would ask the question "Are experts from other disciplines even bothering to spend time critiquing publications on climate science or are the police left to police themselves?" You may then say that the list of endorsing scientific organisations in the article above implies that the level of dissent in a broader scope of disciplines is roughly matched by the survey. Then please provide figures of % endorsed of worldwide scientific organisations etc. and I will be more willing to accept that. However, if the level of dissent within these sci. orgs is greater than that portrayed in the survey above then the picture of a "handful of dissenters" in my opinion may fall apart. Only the heads or a majority of the higher management of these organisations need to support the AGW view in order for the entire sci. org. to be listed. Many dissenters within these organisations may not be speaking out about their position on AGW even in private to their colleagues due to the potential for work place friction on this highly emotive issue. They may also be fearing dis-favour with their own organisational heads/management, who have already made their position offically known. I'm not talking about a conspiracy just the complications of work place issues that arise when speaking out about this subject. Sure majority rules and you may have it.. but don't tell me you have an overwhelming consensus until you can provide the overall numbers. -
Marcus at 23:56 PM on 12 June 2010Is the long-term trend in CO2 caused by warming of the oceans?
I think the point, The Ville, is that CO2 released from non-vegetation sources (such as the CO2 stored in oceans) will release CO2 in virtually equal levels of C-12 & C-13. Whereas the CO2 from burning fossil fuels will have a signficantly higher level of C-12 rather than C-13. Not surprisingly, there is strong evidence that, until the mid-20th century, levels of C-12 & C-13 versions of CO2 have remained about equal, but over the last 60 years, the levels of 12-CO2 have risen sharply, whilst levels of 13-CO2 have remained largely unchanged. The only difference is the significant increase in burning of fossil fuels. Either way, though, it definitely shows that the ocean can't be the source of the CO2. -
Marcus at 23:48 PM on 12 June 2010Monckton Chronicles Part IV– Medieval Warm Period?
Like I said, PW, warmer in the Sargasso Sea does not imply warmer across the entire ocean-nor does it say *anything* about land-surface temperatures in that same region, or globally (after all, in the first part of the 21st century, Ocean temperatures cooled slightly whilst land-surface temperatures continued to rise). Keigwin is rightly circumspect in his conclusions, but Monckton happily misrepresents his work by turning this warming in one corner of the world's oceans into proof that the entire planet was warmer than in the present day. Yet rather than deal with this-& all of other Monckton's gross misrepresentations (like those highlighted by Chris above)-you'd rather Crucify Abraham for saying "Significantly Warmer" rather than "Warmer" in his e-mail to Keigwin. It's clear that you're being so pedantic as a desperate bid to deflect attention away from Monckton-who rightly deserves to be hung out to dry for his constant bastardization of Climate Science.
Prev 2367 2368 2369 2370 2371 2372 2373 2374 2375 2376 2377 2378 2379 2380 2381 2382 Next


