


 Arguments


Recent Comments
Prev 2393 2394 2395 2396 2397 2398 2399 2400 2401 2402 2403 2404 2405 2406 2407 2408 Next
Comments 120001 to 120050:
-
Arkadiusz Semczyszak at 19:08 PM on 4 May 2010What causes Arctic amplification?
Work Screen & Simmonds 2010, is so short - a rather fundamental conclusions. Its advantage, however, is a references. But whether the writers really benefited from - such as - this work: Chylek, P., Folland, C. K. & Lesins, G. Dubey, M. K. & Wang, M. Arctic air temperature change amplification and the Atlantic multidecadal oscillation. Geophys. Res. Lett. 36, (2009); ? "Analyzing temperature records of the Arctic meteorological stations we find that (a) the Arctic amplification (ratio of the Arctic to global temperature trends) is not a constant but varies in time on a multi-decadal time scale, (b) the Arctic warming from 1910-1940 proceeded at a significantly faster rate than the current 1970-2008 warming, and (c) the Arctic temperature changes are highly correlated with the Atlantic Multi-decadal Oscillation (AMO) suggesting the Atlantic Ocean THERMOHALINE CIRCULATION is linked to the Arctic temperature variability on a multi decadal time scale." Recall it: Chylek et al. 2006 - Greenland warming of 1920–1930 and 1995–2005; write that instrumental measurements indicate a large and rapid heating of the coast of Greenland in the decade of 1920. The average annual temperature has risen when the 2 to 6 degrees C in less than 10 years. "Temperature increases in the two warming periods are of a similar magnitude, however, the rate of warming in 1920–1930 was about 50% higher than that in 1995–2005." This rapid increase in temperature, while CO2 emissions to the atmosphere was 9-fold lower than in 2003 (Marland et al., 2006) speak of a natural cause of such a powerful warming. The same is here, only :http://ocean.am.gdynia.pl/p_k_p/pkp_19/Marsz-Stysz-pkp19.pdf "... the STRONG CORRELATION between the sea surface temperature (SST) in the region of the Gulf Stream delta and anomalies in surface air temperature (SAT) in the Arctic over the period 1880-2007. SEA ICE MAY EITHER INCREASE OR LIMIT THE HEAT FLOW FROM THE OCEAN TO THE ATMOSPHERE." "THE GENESIS OF THE 'GREAT WARMING OF THE ARCTIC' IN THE 1930S AND '40S IS THE SAME AS THAT OF THE PRESENT DAY." Really worth reading the two works. Are long and ... full of very interesting calculations - in contrast to the Screen & Simmonds 2010, but ... Marsz, also 2009 but by: Present warming - oceanic climate control; said: "Changes in SST in the Sargasso Sea, explains about 70% of the variability of SAT anomalies in the NH in the period 1880-2008 and 68% of the variability of global SAT anomalies [...]. In times of growth of SST in the Atlantic and North Atlantic sea sector of the Arctic, associated with INTENSIFICATION of the INTENSITY of THERMOHALINE CIRCULATION [!], there is an increase in air temperature in the NH. This increase is particularly strong in the higher latitudes - the Arctic and temperate zone." And I'll be back again also to FIG 11 - maps from this work: K.E. Trenberth, J. Fasullo, L. Smith, 2005: Trends and variability in column-integrated atmospheric water vapor. Climate Dynamics 24: 741–758; The largest increase in humidity over the past decades, we see it is in a place where the return of energy by the Gulf Stream ... Here the difference - in relation to the whole Arctic - is significant. The largest increase in humidity over the past decades in a place where we see the return of energy by the Gulf Stream ... Here the difference - in relation to the whole Arctic - is significant. The balance of energy resulting from the local greenhouse effect caused by water vapor - "positives" are often strongly underestimated. Conclusion. As Frank said - it's energy imports determines the current scale and pace of rising temperatures in the Arctic. -
SoundOff at 14:15 PM on 4 May 2010Rain in the Canadian High Arctic in April?
Arctic Oscillation, when very negative, as it was this past mid winter, produces extreme cold spells east of the Rockies, over Europe and eastern Asia. That’s exactly what we saw in January & February. The mild winter in most of Canada would be better explained by the the recent El Niño. NSIDC - Effects of the Negative Phase of the Arctic Oscillation -
philipm at 14:12 PM on 4 May 2010Skeptical Science talk at University of Qld on May 7
I am at UQ (though not in something climate related). I hope I can catch up with you when you are here. I have a talk titled "Sceptical of the Sceptics" that I give sometimes. It's great to have material like yours to point people to. How about allowing the ice cubes to drift past while you wait for questions? -
philipm at 11:55 AM on 4 May 2010Skeptical Science talk at University of Qld on May 7
John, great to have you at UQ. You should get a good audience. RSVP: check out my blog where I examine AMSU-A satellite data for the near surface layer since 1999. There is no known natural cause for a sharp upward trend over that period. We are coming out of a deep solar low that someone in The Australian little more than a year ago told us presaged an ice age, and our current position vs. ENSO should be the end of the cooling phase before the negative SOI phase a few months back results in warming. So what do I find? Over the first 4 months of the year, vs. the same period for the last 11 years, there's a warming trend of 5.8K per century. If humans aren't causing that, tell us what is. But be quick, because it's pretty damn worrying. Now switch to channel 9, 17km altitude, plot the 20 year average and all years. You will find every year 1999-2010 is well below the 20-year average. There is clear space between the average and the other curves. The only known mechanism that causes troposphere warming and stratosphere cooling is an increased greenhouse effect (specifically well-mixed gases like CO_2 -- water vapour can't do this, because its concentration is so low in the upper atmosphere).Response: Phillip, are you based at UQ? Thanks for the link to your blog post - we seem to be cut from the same cloth because I've been geeking out over the UAH satellite data and SOI data on a semi-regular basis (every couple of days, I have a peek) - currently, I've included the latest UAH screengrab in my slideshow but I may drop it as the talk is getting a little bloated (sadly, I don't think I'll be able to fit in my Greenland ice cubes). -
johnd at 11:28 AM on 4 May 2010What causes Arctic amplification?
doug_bostrom at 09:56 AM, predictions are one thing, observations are another, with many predictions based on such observations as your linked article indicates. However understanding the physical mechanisms involved is another thing, and as in the article, scientists are just beginning to study some of those physical mechanisms. As an example, despite most CFC's being released in the NH, the ozone hole is generally over the South Pole. This thought to be because the ozone layer over the Arctic stays warmer by about 10 degrees than the that over the Antarctic. That is what happens and is measured and accounted for, but is there any understanding of why it is so? Is it the surface climate changing conditions in the stratosphere, or vice versa? What is not happening at one pole may be of as much importance as what is happening at the other, such being more likely to be revealed more by developing understanding of said physical mechanisms. It seems to me that in many cases the cart is before the horse, with assumptions being made simply because data correlates more so than an understanding of why it correlates, or if even relevant. -
Ned at 10:53 AM on 4 May 2010Why are there fewer weather stations and what's the effect?
Berényi Péter, you are once again making very strong assertions based on a rather poorly conceived analysis. I applaud your interest in trying things out for yourself, but you really ought to put a little more effort into understanding what other people have done first rather than just leaping to the conclusion that they're wrong. As far as I can tell, your analysis completely ignores the spatial distribution of stations, which makes any conclusions essentially worthless. Tamino, Zeke Hausfather, Ron Broberg, and the other bloggers who have worked on this (Nick Stokes at moyhu.blogspot.com, Joseph at Residual Analysis, the Clear Climate Code team, etc.) all correctly understood that you can't just look at nonspatial averages of station anomalies. They all implemented some form of spatial gridding. The fact that temperature trends are spatially autocorrelated over long distances means that a gridded analysis will be robust to changes in the station population that would bias the trend in a more naive, lumped analysis. The scenario you've constructed is not a good match for reality. -
Doug Bostrom at 09:56 AM on 4 May 2010What causes Arctic amplification?
Johnd, it sounds as though you're not familiar with predictions concerning the response of each hemisphere to an increasingly deranged energy budget. Here's a helpful summary incorporating reasonably recent findings.
-
Riccardo at 09:54 AM on 4 May 2010What causes Arctic amplification?
Frank, "transfer of heat from summer to winter" this happens all the time and will continue to happen untill there will be some ice around there. It's just heat capacity and latent heat at play, they both tend to stabilze temperature. But these heat fluxes can be pushed one way or another by a change in ice volume and extention. I can't see any big surprise here. What is new in the paper is its relative amount with respect to the atmospheric flux. But as always happen with cutting edge research, it might well not be the last word. -
Pete Dunkelberg at 09:43 AM on 4 May 2010Rain in the Canadian High Arctic in April?
# 5 Soundoff "This anomalous weather must be credited to the recent El Niño, ...." Think Arctic Oscillation. -
Frank2396 at 09:27 AM on 4 May 2010What causes Arctic amplification?
Mspelto: Serreze 2009 was interesting. My point was that transport of energy from air to ice or water is controlled by the temperature differential between the source and sink for energy. How can increased transported of energy be responsible for a lack of temperature rise before some rise has occurred? On the other hand, once the ice cover is gone, surface air temperature will certainly be moderated by ocean temperature and ocean temperature is buffered by melting of nearby sea ice. I completely agree that increased open water in fall will lead to the ocean warming the air for longer than usual in autumn, but I don't believe this phenomena applies to winter. Videos show that ice coverage in the Arctic Ocean has reached equilibrium by early December and that most of the increase in sea ice coverage in winter occurs south of 70 degN (and isn't included in Screen's calculations). These event appear to be too far south to be the cause of warming at 85-90 degN. Figure 1 in Serreze shows that future Arctic Amplification is projected to be maximal near the summer solstice and minimal near the winter solstice. If these changes are driven by changes in sea ice - as Screen asserts - they should be maximal in the fall and minimal in the winter and spring - when changes in sea ice are occurring far away. If changing ice-albedo is the most critical factor in temperature change, that should be maximal when insolation is maximal. Riccardo suggests that there is a bigger effect in the winter because the difference between ocean and air is greatest in winter. As the ice at 85 degN thickens, energy is transferred through the ice cover to the air. 334 J/kg*917 kg/m^3 = 3*10^8 J/m^2 per meter of ice frozen. If thinner sea ice means that an addition meter of sea ice more is melting and freezing every season (180 days), the heat flux amounts to +20 W/m^2 (+5 degK at 250 degK)the winter and -20 W/m^2 (-4 degK) in the summer. If Screen had data showing that an average of 1 additional meter of sea ice was melting and refreezing every year at 85 degN compared with two decades earlier, he would have a mechanism for a 2 degC/decade rise in temperature that depends on sea ice. Without mechanistic details, he is simply engaging in undisciplined speculation about possible reasons for correlation. (Notice that a discussion of mechanism directs attention away from changes in sea ice coverage to changes in the thickness of sea ice melted and refrozen each season. "Arctic Amplification" driven sea ice by Riccardo's mechanism turns out the be simply a transfer of heat from summer to winter, amplifying global warming in the winter and negating it in the summer.) Figure 1 in Serreze shows that future Arctic Amplification is projected to be maximal near the summer solstice and minimal near the winter solstice. If these changes are driven by changes in sea ice - as Screen asserts - they should be maximal in the fall and minimal in the winter and spring - when changes in sea ice are occurring far away. If changing ice-albedo is the most critical factor in temperature change, that should be maximal when insolation is maximal. -
johnd at 09:23 AM on 4 May 2010What causes Arctic amplification?
I understand that this topic deals specifically with the Arctic, but to be put into perspective with regards to Global warming, then should it not be compared to what is happening concurrently at the Antarctic, or perhaps more accurately, what is not happening at the Antarctic? The average temperatures and trends of each hemisphere are very different with an obvious warming bias in the northern hemisphere and closer to no change in the southern hemisphere. Warming due to CO2 is supposed to be global but if each hemisphere, and each polar region are examined individually, then obviously there are other factors to be considered, like long term cycles that will reverse over time. Certain factors may be in play in the Arctic to produce amplification, but what is happening at the Antarctic that either enhances or offsets them that will be reflected in the global situation? -
Riccardo at 08:21 AM on 4 May 2010Where is global warming going?
suibhne, infrared photovoltaic detectors work like photovoltaic solar panels and could in principle be used to produce electricity. Whatever the type of IR detector used, radiation from the atmosphere can, and indeed is, measured. It's energy, no doubt. -
suibhne at 08:10 AM on 4 May 2010Where is global warming going?
KR You made my point for me, the "back radiation" cannot do any work. This means it cannot be described as heat. I see you followed my version of the Alamo at Deltoid. Two reasons for the pause in my contributions; 1. The article by H=>Z has still not been published. 2. While you can have a rational discussion with Sylas, Arthur Smith and Stu there are others on that site who simply want to hurl abuse behind the safety of the internet. Thank goodness for a site like Skeptical. While I have not fundamentally changed my position it is not the same as it was say two months ago. All the best. -
KR at 07:49 AM on 4 May 2010Where is global warming going?
To clarify my previous comment: the EPA document, Volume 3, Comment 3-45 and Response 3-45 on page 38 is a direct response to the issues in Gerlich and Tscheuschner (2009). -
KR at 06:50 AM on 4 May 2010Where is global warming going?
suibhne, take a look at the EPA response, particularly Volume 3, Comment 3-45 and Response 3-45 on page 38. You're welcome to take it up with the EPA, but the vast scientific consensus is that G&T are full of, um, hot air... As to the 324 back radiation discussion, AGAIN!!! - I would love to put that energy to work, preferably in my car. Unfortunately, that's part of the sea-level radiative balance, and there are no cold sinks to divert it to, no opportunity to extract work from it. See the definition of "work", under "Zero work", for this situation. 'Nuf said, suibhne. We went around and around on this under the "Is CO2 a pollutant" thread, you've had the same argument on other blogs, and in each case you've repeatedly refused any physics not from G&T, changed the subject, or just left the discussion midstream when it became clear that nobody found your arguments persuasive. You seem to have a basic misunderstanding of 'zero work' situations of steady state systems, and repeated raise issues of 'work' when there is zero net energy flow. That's really a freshman physics error, and if you don't/won't get it, there's nothing anyone here can say to you... My apologies for the harshness of my reply; I'm more than willing to have a discussion, but you haven't shown a willingness for that. It's quite frankly not worth my time. -
Chris G at 05:31 AM on 4 May 2010What causes Arctic amplification?
Frank's post has been pretty well covered already, but I'll add, or restate, a couple of points in ways that I think are simpler. Others can correct me if I'm too far off. We are talking about an amplification of warming. Frank seems to be proposing some mechanism that moves more heat into the arctic region when the region is warmer, than it did when the region was relatively cooler. That is counter-intuitive for me. The primary factor we are looking at is ice loss and regain. Frank's post is all about temperature, but in a phase change, there are large changes in energy with little or no change in measured temperature. When ice melts in the summer, there can be large changes in energy with very little change in temperature. This energy is released as the water freezes, and we see a positive temperature anomaly, in the fall/winter, compared to historical points when the water was already frozen in that place and time of year. -
suibhne at 05:24 AM on 4 May 2010Where is global warming going?
KR Yes Ive read Arthur Smiths paper and still prefer G&Ts version of reality. One thing for me sums up the departure of AGW advocates from reality is the figure of 324W/m2 Back Radiation. Why is this huge magnitude of photons not put to some useful work? If this could be shown I would have to reconsider the whole issue. -
Philippe Chantreau at 05:06 AM on 4 May 2010Rain in the Canadian High Arctic in April?
I've dealt with METARs a lot during my days as a pilot and flight instructor. They are automated reports from stations that rely on sensors. Pilots learn to not rely too extensively on reports from unmanned stations, especially for some indications. The station "looks" at a rather small extent of sky, so sky cover may be different from reality. Visibility is ground visibility (normally measured in a direction parallel to the runway axis from the station location) and may not be the same as the slant range visibility that matters when looking for the runway treshold in an instrument approach. Some stations have a precipitation discriminator (type2 if I recall, it usually figures in the remark section of the aviation METAR), others don't. Even the ones that have it can experience temporary malfunctions of the sensor. Some types of precipitation are more likely to "confuse" the sensors, like heavy fog that falls as very fine drizzle (especially below freezing), or freezing rain. The stations are a great tool, but they're only robots and ill-equipped to give an accurate rendition of what goes on in complex weather situations. You could have a cold layer near the ground just a couple of hundred feet thick, with layers of various and higher temperatures as altitude increases, leading to all sorts of variations in precipitation. What was described by Geo-Guy certainly reflects one of these types of situations evolving over time, seen from the ground. It's all weather. I would not put too much trust in such minute amounts of precip as were reported in the METARs linked by John and other posters. -
KR at 04:56 AM on 4 May 2010Where is global warming going?
Take a look at the Arthur Smith paper. I've spent a number of hours on G&T (sigh - time I'll never get back, time that would have been better spent with a decent beer); Smith's paper is only 9 pages and very clear. G&T say that there is no such thing as a radiative greenhouse effect. They are quite simply wrong. The magnitudes and numbers for heating via LW radiation trapping and total radiative imbalances are well established by numerous sources; not much I can add there. -
suibhne at 04:38 AM on 4 May 2010Where is global warming going?
KR On G&T ....G&T's major confusion seems to be about "heat radiation", aka thermal radiation, emitted by anything above 0K...... I think G&T have been misunderstood on this point. They say radiation can go from a lower temperature body to a higher temperature body. However they say HEAT cannot go from a lower temperature body to a higher temperature body. This is simply stating the "bleedin" obvious in terms of standard thermodynamics. -
suibhne at 04:29 AM on 4 May 2010Where is global warming going?
KR On the thought experiment. Like all these gross simplifications it is fetched pretty far. But then so are calculations about the Earths atmosphere that ignores Oceans and so on. I thought it would be interesting though to get a simple value for the Earths thermal capacity or the amount of energy required to increase its temperature by one degree c. A slightly more realistic one for the Oceans gives 30years for a rise of one degree. Assumptions 10% imbalance in radiative equilibrium and using the value of surface radiation 168 w/m2. Both calculations show a large value of thermal inertia. -
Phila at 04:08 AM on 4 May 2010Rain in the Canadian High Arctic in April?
#4 CoalGeologist "It is a "double edged sword" to use single events as providing proof that AGW is occurring, when certain other rare "events" such as this past cold, snowy winter in the eastern U.S. could potentially be cited as proof that AGW is a "hoax"." Without condoning citing single events as "proof" of AGW, I think the difference is that cold, snowy winters are consistent with AGW. While it may be an error to make too much of, say, a heat wave, it's an error of an entirely different type to claim that if it gets cold in the Northern Hemisphere in winter, then AGW must be a hoax. One results from confusion; the other is an attempt to produce it. -
iskepticaluser at 03:48 AM on 4 May 2010What causes Arctic amplification?
A recent technical paper, entitled An Initial Estimate of the Cost of Lost Climate Regulation Services Due to Changes in the Arctic Cryosphere and sponsored by the Pew Charitable Trusts, provides another warning of just how strong the feedback effects of a melting arctic may already be. From the summary: “. . . the combined heating effect from the loss of sea ice and snow and the increased release of methane from permafrost in 2010 is roughly equal to releasing an additional 3 billion metric tons [my emphasis] of carbon dioxide into the atmosphere. For comparison, this equals 42 percent of current annual U.S.emissions of greenhouse gases.” -
KR at 03:32 AM on 4 May 2010Where is global warming going?
In regards to G&T's more outrageous points, I find Arthur Smiths rebuttal quite clear. Even a single layer of IR scattering (absorbance/emisison) atmosphere can be very simply shown to produce a greenhouse effect, and a more realistic thick layer with temperature gradients and convection will be even more effective. G&T's major confusion seems to be about "heat radiation", aka thermal radiation, emitted by anything above 0K. In section 3.9.3 their misunderstanding (amazing if it isn't intentional) is quite evident, and leads to their claim that heat radiation and energy flow balancing somehow contradicts the 2nd law of thermodynamics. This is a clear attempt on their part to confuse heat flow (net energy changes) with heat radiation. -
Ron Crouch at 03:24 AM on 4 May 2010Rain in the Canadian High Arctic in April?
I had hoped to do this all in one post but there were some technical difficulties with the Environment Canada website. #10 Berényi Péter Your last point surrounding the Metar report for Alert on Apr 3, 2009. Although the Metar report clearly states rain with no accumulation it is unsupported by either hourly reports from Alert airport which only reports ice crystals, or Alert Autonomous which shows a trace of snow. -
Geo Guy at 03:13 AM on 4 May 2010Rain in the Canadian High Arctic in April?
Interesting post and just goes to show that climate doesn't always fall into neat organized categories. In 1973 I was working in Uranium City in northern Saskatchewan (north shore of Lake Athabasca). At 8:00 pm on New Year's eve (73-74)it was -40 F (we hadn't switched to metric then). When we left the festivities at about 12:45 am New Year's day, the temperature had sored to +40F! By 10:00 am later that morning it had dropped to about - 10F. I am sure there are many other oddities in the weather, especially in areas that are isolated as in Northern Canada, that go unreported. Certainly rain in April is not that far fetched - it may have happened 20 km away from the weather station in the past but simply went unreported. Having worked in isolated areas of Canada in the past I can assure you that things such as thunder showers in winter happen, although not that frequently. Calgary (where I currently live) has had significant snow falls in August and golf weather in January, all which seem to be linked to where the jet stream is located. I guess what this can tell us is climate and climate change is a multi-faceted process contingent not upon one single parameter but rather it is the result of the interaction of many parameters. -
Doug Bostrom at 02:45 AM on 4 May 2010Skeptical Science talk at University of Qld on May 7
RSVP points out that certain organisms with large populations and short reproductive cycles can benefit in certain circumstances from a change of climate, usually by chewing through a local ecosystem ill-prepared for fast changes. From this we are to derive comfort. Thank you, RSVP. I will welcome my case of West Nile encephalitis or whatever little critters may adapt their way into my province as Good News. -
Ron Crouch at 02:34 AM on 4 May 2010Rain in the Canadian High Arctic in April?
My apologies the link to the daily data for Isachsen for June 1975 should point here. -
Riccardo at 02:15 AM on 4 May 2010Why are there fewer weather stations and what's the effect?
Berényi Péter, I know Spencer blog posts and they are not related to station drop out nor with your analysis. The replications I was talking about are on the effect of the dropping of stations and they have done it properly, contrary to your analysis. -
Ron Crouch at 02:15 AM on 4 May 2010Rain in the Canadian High Arctic in April?
#10 Berényi Péter While the Metar report you supplied for Clyde River Apr 18, 1973 clearly states rain it also shows no accumulation. In contrast the Environment Canada Daily and the Environment Canada Hourly records indicate no precipitation at all. Now the Metar report you supplied for Pond Inlet for Apr 25, 1985 clearly states "fog,rain,snow" with an accumulation of .1 cm. The Environment Canada Daily and the Environment Canada Hourly records clearly indicate snow on that date with total precipitation registering .6 mm. Moving on to Isachsen on June 7, 1975 The Metar report indicates fog with no accumulation of precipitation. On June 4, 1975 the Metar report does indicate "rain,snow" with no accumulation. So let's see what Environment Canada has to say about those dates on a daily basis. Well June 7 shows rain accumulation of .3 mm and June 4 shows the same with a trace of snow. So moving on to the hourly report for June 7 it indicates drizzle and fog throughout the day. Now on June 4 the hourly report indicates rain and snow changing to rain late in the evening. So yes the claim that June 7, 1975 being the first recorded rainfall at Isachsen is incorrect as it clearly took place three days earlier on June 4. So we'll have to give David Phillips at least an "E" for effort on that one. Now for the final item which is May 1988 in Alert. The Metar record supplied shows a total of 4 cm precipitation for the month and shows no precipitation on the 21st and .1 cm on the 22nd. So what do the Environment Canada records say. Well it shows a .2 mm accumulation of rain on May 21 followed by a trace of rain on May 22. So in conclusion, seeing that we are dealing with Canadian Climate Records then it is only appropriate when doing an analysis that we use the official Canadian documents from Environment Canada. Other than the small blurb that David had over June 7, 1975 for Isachsen, I'd say the climate record contentions are fairly spot on. -
Tom Dayton at 01:45 AM on 4 May 2010Why are there fewer weather stations and what's the effect?
Berenyi Peter, I'll try to be clearer: In the real data analyses, the missing/dropped/discontinued data do not contribute to the overall average trend, because those data are ... missing. In contrast, in your math experiment, the data you dropped did contribute to the overall average trend. -
Berényi Péter at 01:42 AM on 4 May 2010Why are there fewer weather stations and what's the effect?
#37 Tom Dayton at 00:16 AM on 4 May, 2010 Every month, more get added as the data dribble in. They do dribble. Records updated in GHCN (v2.mean) between 2010-03-19 & 2010-05-03 according to year:2005: 9
Data earlier than 2005 are not even dribbling.
2006: 11
2008: 13
2007: 14
2009: 213
2010: 1292 -
Juergen Wanninger at 01:33 AM on 4 May 2010Flowers blooming earlier now than any time in last 250 years
If I'm reading the diagram correctly, the botanical spring has moved two or three days forward within the last 250 years. Aren't you aware, that this will show that earth has NOT warmed since that time in any way? Due to earth's axis precession once in 25800 years, the seasons will move completely through our calender in that time. So spring for example should move forward for about 3.6 days in a 250 years period. So I think the result of this paper is the confirmation of a little COOLING of earth within the last 250 years. Quite a good argument for climate scepticals! Isn't it? -
Rob Honeycutt at 01:13 AM on 4 May 2010Rain in the Canadian High Arctic in April?
I have to agree with CO2 (#14). Hail is formed by rising moisture in thunderheads that can sometimes reach over 50,000 feet high. Such storms only form in the presence of warm moist unstable air (summer). One would expect it to be warm at the surface when getting hail. -
Tom Dayton at 00:16 AM on 4 May 2010Why are there fewer weather stations and what's the effect?
Berenyi Peter, you are incorrectly assuming that your purely mathematical experiment is an analog of the actual station dropout data. In your experiment, you split the data at an exact midpoint of time, and deliberately and perfectly split lower-trending from higher-trending data. Those choices of yours are what led to--indeed, forced--the existence of the regression to the mean that you found, purely due to the math. You might just as well have removed all the lower-than-average anomalies and expressed shock that the remaining anomalies are higher-than-average. It's the combination of lower with higher that defines the average! In contrast, the real data analyses' station discontinuation point is not at the time midpoint, but long after. Also, the discontinued data are not selected for discontinuation because they trend lower or higher. Indeed, the majority are discontinued only temporarily. Every month, more get added as the data dribble in. -
CO2 at 00:01 AM on 4 May 2010Arctic Sea Ice (Part 1): Is the Arctic Sea Ice recovering? A reality check
CBDunkerson at 04:32 AM on 13 April, 2010 I've used identical arguments when discussing sea ice extent. We also have to differentiate between the arctic and the antarctic. Antarctica's sea ice is unimpeded, the arctic is not. Once the arctic sea ice reaches its limits east and west, the only growth area's are south and north. -
CO2 at 23:47 PM on 3 May 2010Rain in the Canadian High Arctic in April?
HumanityRules #7 Hail is formed in severe thunderstorms reaching great hight. The surface temperature has no more to do with this than creating the conditions that formed the thunderstorm to begin with, which may be 20,30 or 40 degrees C. Are we talking climate change? -
Berényi Péter at 23:22 PM on 3 May 2010Why are there fewer weather stations and what's the effect?
#35 Riccardo at 17:13 PM on 3 May, 2010 I cannot see the rationale of the station selection criterion The rationale, as I have already stated, is the fact that dropped stations have slightly higher warming trend prior to dropout than the rest. the very same results has been replicated several times Yes, but all of them have found the right answer to the wrong question. Except Roy Spencer of course, who did something entirely different. He actually collected some more data, which is the proper thing to do anyway. He uses ISH data from ftp://ftp.ncdc.noaa.gov/pub/data/noaa/ but says they are only accessible for ".gov or .edu domains". He may be right. He checks CRUTem3NH against it and finds no serious difference, provided an increasing urban heat island effect is not taken into account. Satellite data are not used in this analysis. However, there ara also several follow-up articles on his website including Spurious Warming in the Jones U.S. Temperatures Since 1973 and The Global Average Urban Heat Island Effect in 2000 Estimated from Station Temperatures and Population Density Data His population density / station warm bias graph is particularly interesting.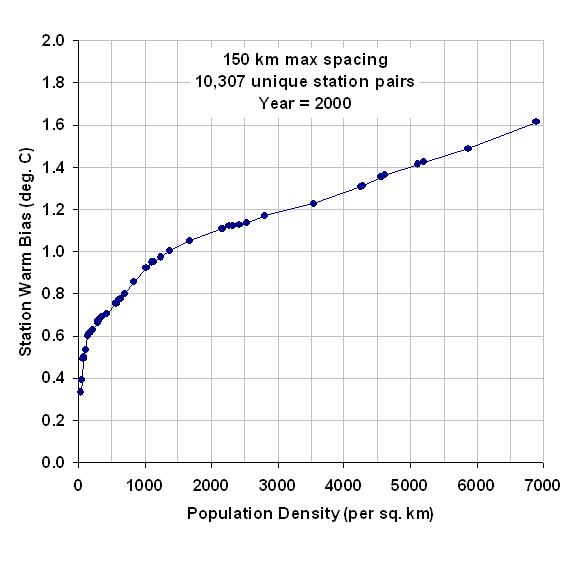 This effect alone can be responsible for a good portion of "Arctic Amplification" (because population density is pretty low there).
-
Dennis at 22:39 PM on 3 May 2010Rain in the Canadian High Arctic in April?
Re: CoalGeologist #4 wrote "It is a 'double edged sword' to use single events as providing proof that AGW is occurring, when certain other rare "events" such as this past cold, snowy winter in the eastern U.S. could potentially be cited as proof that AGW is a 'hoax'." The Eastern U.S. this past winter may indeed be categorized as "snowy," but -- depending on how you categorize "Eastern U.S.," it is debatable to call it "cold" (or, more accuirately, "colder"). While Washington, D.C., had record snowfall totals from December through February, March recorded the forst time since record keeping began that the temperature did not drop below freezing (even overnight). I leave up to the scientists if increased precipitation is linked to a warming world. However, ceteris paribus, higher temperatures are. So, I agree with coal geologists, and have found that the AGW-is-a-hoax crowd have ignored the temperature record int he evidence. -
Mythago at 21:34 PM on 3 May 2010Rain in the Canadian High Arctic in April?
I won't profess to having had time to go through reams and reams of data but to my mind it is possible for all unique or rare or even bizarre events as being nothing more than pure fluke chances of something having happened. Micro-climates exist all over the place. Here in North Oxfordshire we got a massive winter snowfall compared with the last 15 years that I can recall. Is that bizarre? Is that proof that AGW is not happening or is happening? I firmly believe that we have influenced the natural cycles of climate change, which would normally take millennia to occur, by pumping out massive amounts of all manner of polluting gases (AGW gases) and it is obvious that the climate is warming from very basic evidence but I really despair when one-off events are even hinted at as evidence to prove or disprove what is a very obvious trend which is already being proven and is based on global scale, long term evidence. I reckon someone was fishing by putting out the bait and you were conscientious enough to want to genuinely want to answer in as honest a way as possible. However beware the origin of this item. They may seem all interested and curious on the outside but on the inside they are possibly looking for a fight. I bet they try to use some of your article to suggest something alternative and argumentative later on elsewhere. The sceptics are getting desperate for an argument that they can say disproves AGW and will dig as deep as is possible and use whatever tactic is readily available. As the old saying tells us, 'There are lies, damn lies and statistics'. The lists you quote are incontrovertible evidence but they prove nothing unless you try to say they do with some argument, no-matter how well founded, that shows reasonable proof of a pattern or trend. That's when the sceptics strike with counter evidence. Its all a silly game and as far as I am concerned its a waste of time. Lets just put down the charts and tables and get on with abandoning fossil fuels and start being realistic about the planets ability to sustain us as a species. AGW! Its happening. We need to prepare for the worst case scenario and no amount of tables and charts and nit-picking over micro details will stop it happening. Have a nice day. Kev C. -
HumanityRules at 21:17 PM on 3 May 2010Rain in the Canadian High Arctic in April?
Ron, Just to prove I can do something as boring as you in the name of enlightenment I decided to have a look at some of those high Canadian records. I choose Eureka because from the map it looked like the closest to the site of this rain. The max temp in Apr 2010 was -4.7oC (-5.2oC on the weekend in question). So I checked for some other 'high' temps in Apr at Eureka. Here's a few of the balmiest Apr days (year, day in Apr, temp oC) 2010 23rd -4.7 1948 28th -5.0 1951 30th -6.1 1953 25th -3.3 1961 19th -6.7 1971 26th -2.8 1975 28th -5.0 1979 12th -3.1 (these are not all of them, just the warmest in a particular year and I reached my boredom threshold in the mid 80's) While unusual it looks like the temps in 2010 aren't unique. It's a shame the records don't go back further because my understanding is that the 1930's and 1940's were a period of warmer arctic temperatures. Going through the record I noticed all forms of precipitation are rare in Eureka in Apr (average for whole of Apr is 3.5mm). Apr 2010 had 15mm of precipitation. Hope this helps to stop people going off the deep end :) -
Berényi Péter at 20:36 PM on 3 May 2010Rain in the Canadian High Arctic in April?
There is a METAR record for Clyde, Nunavut, 1973 April 18, 20:00 AST (70.48 N, 68.52 W) indicating some rain. Same for Pond Inlet, Nunavut (72.70 N, 77.97 W) on 1985 April 25 01:00 EST and several more on 1995 April 27 Unfortunately Isachsen, Nunavut (78.78 N, 103.53 W) has only reported on 15 & 16 April 2010, so the anecdotic claim about April's rain on 24/25 is not supported by hard evidence. There was some rain there indeed on 1975 June 7 as claimed by the article. However, it could not be the earliest recorded rainfall on that spot, for there was also some rain there three days erlier. And of course there was no rain at all in May, 1988 at Alert, Nunavut (82.50 N, 62.33 W). On the other hand, there was some rain there last year on April 3 (maximum temperature for the day is -32 °C!). That much about reliability of press releases. -
JMurphy at 20:13 PM on 3 May 2010Rain in the Canadian High Arctic in April?
RSVP, your Spanish examples are no doubt uncommon but hardly bizarre, I believe. Barcelona's 'maximum number of snow days in a month' (4) occurred in Feb 1938. Mallorca's maximum, (3) occurred in Jan 1985. The overall picture for the last Spanish Winter doesn't suggest any particularly bizarre events. In fact, the only unusual snow events occurred in A Coruña (Airport), Santander, Madrid (aerodrome of Cuatro Vientos), Toledo, Valencia (Manises airport) and Seville (Airport), where the number of days of precipitation in the form of snow surpassed the previous maximum values for January. On checking those stations, though, you will notice that accurate readings only began in, respectively, 1971, 1945, 1982, 1966 and 1951. (I haven't included Santander because although readings began back in the 20s, it is still showing 1956 as the heaviest year). Since most other places I have checked show a maximum snowfall around the 1930s or 50s, it can be perhaps claimed that the above stations may well have been higher then also, if only accurate readings had been taken at the time. You can check them all here. Uncommon weather indeed but not bizarre, surely ? -
wanderers2 at 19:40 PM on 3 May 2010Rain in the Canadian High Arctic in April?
I was fortunate, as a 19-year-old, to get a job in the Canadian High Arctic (as an assistant carpenter/plumbers/electrician's helper). Yes that meant I visited places like Eureka, Resolute, Mould Bay, and Alert (Weather Station Isaachsen had already been closed by that time). Sighting narwhals from the air (thank you De Havilland Canada for building the incomparable twin otter) was fun. Encountering a polar bear on the ground (me carrying no gun and hiking alone and therefore illustrating the stupidity of my youth) was not. But seeing thousands of nesting murres, or the occasional snowy owl or snow bunting. That experience drove me towards a lifelong pursuit of ecology. Recently I have returned to the arctic, where I consistently see, and hear, from aboriginal persons, hunters, ornithologists, and others: that trends are all congruent with what is expected or projected by climate models. John, you do a great service with this website, and the best part of it is to provide access to the primary literature that others might have a hard time finding. If I had one request it would be to further synthesize some of the recent phenological papers. Thank you. -
HumanityRules at 19:36 PM on 3 May 2010Rain in the Canadian High Arctic in April?
So normal April temps at Resolute and Eureka are -20oC. Apr 24th and 25th 2010 temperature was around -10oC (as high as -6oc). Seems rain wasn't the only strange weather that weekend. -
Argus at 19:12 PM on 3 May 2010Skeptical Science talk at University of Qld on May 7
RSVP is right here, of course. Nature adapts all the time, and it works faster than we may think sometimes. I sense a kind of anxiety with many of the debaters on this site. They are always so worried, verything is so alarming all the time, and status quo seems to be the only desirable future. -
HumanityRules at 19:08 PM on 3 May 2010Rain in the Canadian High Arctic in April?
If you want bizarre weather come to Melbourne. One summer day we had temperatures over 30oC followed by an evening hailstorm! How is the rain recorded? What was the temperature on the day? -
Berényi Péter at 17:46 PM on 3 May 2010What causes Arctic amplification?
#12 HumanityRules at 12:32 PM on 3 May, 2010 a little sceptical that there is a linear trend There are issues here indeed. Arctic sea ice extent reconstruction for the first half of 20th century at Cryosphere Today is higly problematic. The following book is a must-read for all serious students of the topic (even if it is mentioned at WUWT). Arctic Ice by Nikolai Nikolaevich Zubov, Moscow, 1943 (English translation 1963). -
Riccardo at 17:31 PM on 3 May 2010What causes Arctic amplification?
Frank, there is a very good reason for the warm water effect having a larger effect in winter, it's air temperature. Relative to the winter-summer temperature difference, water temperature is almost constant and not far from air temperature in summer. I'd also like to point out that the authors are smart enough to not confuse correlation with causation. Indeed their conclusions don't rely on the correlation but on the physics of the process. The correlation has been properly used to rule out other effects. It always surprises me when people think that reputable scientists (authors and referees) could make such trivial mistakes. Betting on a trivial mistake in a published paper, good chances are that we're missing something. -
Riccardo at 17:13 PM on 3 May 2010Why are there fewer weather stations and what's the effect?
In this blog are used to the strong but not supported claims by Berényi Péter. This is just one more example. Indeed, I cannot see the rationale of the station selection criterion nor how any reasonable judgement can be done on the global average temperature trend without proper gridding and averaging. Taking subsets and subsets of subsets is no easy task and the fact that the very same results has been replicated several times using different methodologies makes me think that the only possible conclusion from Peter's mathematics is that his selection criterion is biased.
Prev 2393 2394 2395 2396 2397 2398 2399 2400 2401 2402 2403 2404 2405 2406 2407 2408 Next


