


 Arguments


Recent Comments
Prev 234 235 236 237 238 239 240 241 242 243 244 245 246 247 248 249 Next
Comments 12051 to 12100:
-
Philippe Chantreau at 05:57 AM on 13 June 2019The Scientific Method
The argument about the null hypothesis is specious. It is normally applicable to statistical studies used to infer a causative mechanism. In the case of atmospheric CO2, there is a clear and very well studied physical mechanism that is independent of any statistical relationship. Physics predict that increasing CO2 concentration would cause warming, that hypothesis is not derived from correlating the recent observed warming with observed rise in CO2 concentration. Assuming that physics will not work as expected and attempting to find another explanation for the observed warming is going beyond what logical inferrence would call for. Nonetheless, this has been done, and studied ad nauseam, as pretty much all other possible forcings have been explored. I would expect that the attribution litterature in the IPCC contains volumes on that.
-
Eclectic at 05:55 AM on 13 June 2019Medieval Warm Period was warmer
A further reply to comment #250
The scientific study Kopp et al 2016 [published in the Proceedings of the NAS ] indicates that the fall in MSL was about 10 cm (not 50 cm) during the MWP to LIA transition. The poster at #250 had wildly exaggerated the sea level fall.
-
Eclectic at 05:44 AM on 13 June 2019The Scientific Method
TVC15 @58 , in view of comments elsewhere . . . it seems your adversarial friends are projecting themselves everywhere, most remarkably.
1. They should read the philosopher Popper ~ they have failed to understand the basic concept of Null Hypothesis. In view of the patently obvious sea level rise & ice melt, it is fair to say Global Warming now is the Null Hypothesis . . . and they themselves need to refute it.
2. The various methodologies of temp measurement are a strength, not a weakness.
3. It is statistically valid to use a variety of locations. (And scientist Nick Stokes has demonstrated the validity of using as few as as 61 sites worldwide.)
4. Data is often reviewed & adjusted quite openly, in order to reduce errors that are detected. That's the proper way of conducting science.
5. The global mean sea level is rising, and ice is melting, and plants & animals are changing their location as the temperature rises. All this is physical evidence of ongoing global warming. No "perception" is required.
6. The Little Ice Age and the Medieval Warm Period are both only very minor wiggles in average world temperature (and the 21st Century temperature is still rising and is distinctly above the MWP & the Holocene Maximum). The LIA and MWP are quite trivial and not in any way "inconvenient". How could anyone think them inconvenient ?
Apparently the plants & animals are more intelligent than your denialist "friends" ! ;-)
-
Daniel Bailey at 05:28 AM on 13 June 2019The Scientific Method
As a short answer, demand source citations (to credible sources) for each of those claims.
They won't furnish any because they don't have any.
That means no need to rebut each and every claim. If you feel like it, pick one and demolish it; an example:
"ignores "inconvenient" data points like the "Little Ice Age" and the "Medieval Warming Period" in data analysis"
The Little Ice Age and the Medieval Warming Period were not ignored. The Trump Administration placed them in their appropriate context, back in 2017:

Advice: Don't play their game. Make them play yours.
-
TVC15 at 03:36 AM on 13 June 2019The Scientific Method
Hi Skeptical Science,
I'm dealing with some very difficult deniers and I was hoping to gain some insight on how to deal with such deniers.
This is what a denier I'm dealing with states over and over.
See the cornerstone of the scientific method and legitimate science- refuting the null hypothesis. AGW fails miserably in this regard and is thus not legitimate science.
AGW;
1. fails to refute the null hypothesis
2. compares temp data over time using four different temp measurements
3. fails to have consistent measuring locations over time
4. has intentionally altered or "adjusted" data to meet their hypothesis, rather than realizing the data refutes their hypothesis.
5. uses bogus statistical analysis to create the perception of warming
6. ignores "inconvenient" data points like the "Little Ice Age" and the "Medieval Warming Period" in data analysis.
AGW is bogus, junk science.
-
Daniel Bailey at 00:37 AM on 13 June 2019Climate's changed before
Agreed with MA Rodger.
No Venus-syndrome for the Earth:
"With the more realistic physics in the Russell model the runaway water vapor feedback that exists with idealized concepts does not occur. However, the high climate sensitivity has implications for the habitability of the planet, should all fossil fuels actually be burned.
Furthermore, we show that the calculated climate sensitivity is consistent with global temperature and CO2 amounts that are estimated to have existed at earlier times in Earth's history when the planet was ice-free.
One implication is that if we should "succeed" in digging up and burning all fossil fuels, some parts of the planet would become literally uninhabitable, with some time in the year having wet bulb temperature exceeding 35°C.
At such temperatures, for reasons of physiology and physics, humans cannot survive, because even under ideal conditions of rest and ventilation, it is physically impossible for the environment to carry away the 100 W of metabolic heat that a human body generates when it is at rest. Thus even a person lying quietly naked in hurricane force winds would be unable to survive.
Temperatures even several degrees below this extreme limit would be sufficient to make a region practically uninhabitable for living and working.
The picture that emerges for Earth sometime in the distant future, if we should dig up and burn every fossil fuel, is thus consistent with that depicted in "Storms" — an ice-free Antarctica and a desolate planet without human inhabitants"
So no runaway. But Hansen notes that it won't take a runaway to basically completely eradicate civilization as we know it. Supported by this:
"While dominated by anthropogenic forcing in these recent times, solar variability in prior eras caused much larger relative influences.
The early Sun was approximately 70% as bright as at the present when it joined the main sequence about 4.6 billion years ago with a current rate of increase in luminosity of 0.009% per million year (Hecht 1994). At this rate, it will take 10 million years for the background solar brightness to increase by the 0.1% typical of a solar-cycle variation, and another 3.5 billion years for heating from the Sun to create Earth-surface conditions similar to those of the present-day Venus; although additional effects, such as feedback from enhanced ocean evaporation, may accelerate this warming and make the Earth uninhabitable (at least to present-day complex lifeforms) in about one-billion years."
-
Daniel Bailey at 00:23 AM on 13 June 2019Climate change: sea level rise could displace millions of people within two generations
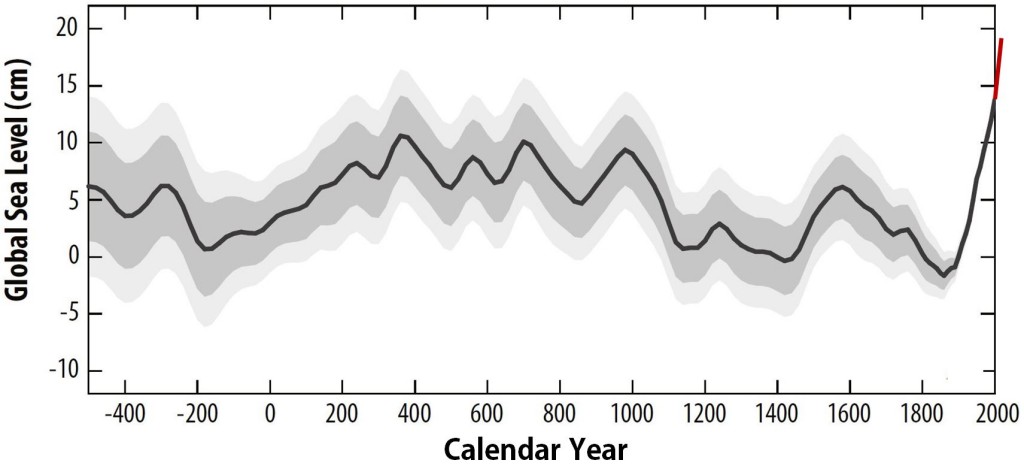
That graphic is from Kopp et al 2016. From that paper:
"The 20th century rise was extremely likely faster than during any of the 27 previous centuries"
Extremely likely = 95%.
We know that in the early 20th Century, about one-third of the observed warming is from human activities. This corresponds well to the observations from Kopp et al 2016. However, since 1950, pretty much all of the observed warming is from human activities. Thus, the closer we get to the present the greater the human-driven component of the knock-on effects of that warming (like SLR from land-based ice sheet mass losses due to that warming) becomes.
Per Slangen et al 2016,
Anthropogenic forcing dominates global mean sea-level rise since 1970
"the anthropogenic forcing (primarily a balance between a positive sea-level contribution from GHGs and a partially offsetting component from anthropogenic aerosols) explains only 15 ± 55% of the observations before 1950, but increases to become the dominant contribution to sea-level rise after 1970 (69 ± 31%), reaching 72 ± 39% in 2000 (37 ± 38% over the period 1900–2005)"
Takeaways:
1. Although natural variations in radiative forcing affect decadal trends, they have little effect over the twentieth century as a whole
2. In 1900, sea level was not in equilibrium with the twentieth-century climate, and there is a continuing, but diminishing, contribution to sea-level change from this historic variability
3. The anthropogenic contribution increases during the twentieth century, and becomes the dominant contribution by the end of the century. Our twentieth-century number of 37 ± 38% confirms the anthropogenic lower limit of 45%
4. This would increase even further if increased ice-sheet dynamics were considered to be a consequence of increased anthropogenic forcing (to 83% in 2000) and if reservoir storage and groundwater extraction were included (to 94% in 2000)
5. Our results clearly show that the anthropogenic influence is not just present in some of the individual contributors to sea-level change, but actually dominates total sea-level change after 1970
-
higgijh at 23:56 PM on 12 June 2019Climate change: sea level rise could displace millions of people within two generations
This is an interesting post and it's good to know that people in the field are continuing to collect information and re-think climate change and sea level rise in particular. However, the earth could also be hit by an asteroid large enough to wipe out civilized life - there are still rocks out there that haven't been detected. There are a couple of things about the asteroid problem that are different: (1) there's not much we can do about an asteriod threat and, (2) those predicting possible asteriod threats put some fairly good error bars on their predictions. Thing is, you can always predict possible disaster ... like maybe a volcano suddenly building under Seattle, but if you can't put error bars on the prediction then the prediction is worthless. Seems like this post suggests high risk with associated extremely high and completely unquantified uncertainty.
Note the error bars on the graph of reconstructed sea level and how those bars diminish to zero at present day. That graph does not say that sea level is currently higher than it's been in 2500 years. It says that sea level might be higher than it's been in 2500 years with the uncertainty large in the far past. Peaks in things like sea level and climate temperature will be naturally diminished when tracked, via proxies, far into the past because the measurement methods do a natural averaging. Averaging always diminishes peaks and toughs.
-
MA Rodger at 21:50 PM on 12 June 2019Climate's changed before
TVC15 @735,
I think I would respond to such a silly comment by asking for the name of this man they are talking about, this because such knowledge may assist in sorting out why they are asking such silly questions.
But a more direct approach, but more involved could be:-
There is perhaps a philisophical aspect to the "runaway greenhouse effect." CO2 emissions/CO2 levels that are directly due to man's actions will result in an elevated global temperature and this will result in a further CO2 emissions that are NOT directly due to mankind, this extra CO2 resulting in yet further warming.
So when would that "further warming" be considered as "runaway"?
If human emissions totalled 4,000 Gt(C) before we stopped, which is eight-times what we've done so far, that would increase global temperature by perhaps +6ºC which would cause natural emissions of let's say another 4,000Gt(C). These "feedback" natural emissions from a 1,200ppm CO2 world would cause further warming, resulting a total of say +9ºC in a 2,400ppm CO2 world. And then the warming would stop. So is +6ºC with +3ºC of that feedback, is that "runaway"?
Consider if the physics were such that it didn't stop there, that creating CO2 levels of 1,200ppm would result in say 40,000Gt(C) extra CO2 in the atmosphere - roughly 20,000ppm - which is all the carbon in the oceans & soils (but the rocks would still contain the bulk of the planet's carbon), the temperature would ratchet up to who-knows what temperature and all would see this as runaway warming.
But at some level it would stop. Any runaway system will eventually stop. Always it will stop somewhere.
The important thing is whether the runaway effect is so significant that it presents a "wheels-fallen-off" situation. Back in the days of the Hadean or Archean, there may well have been far more than 24,000ppm CO2. Such levels are argued because of the faint young sun paradox. But the Hadean earth was not back-then a "wheels-fallen-off" situation because there was no humans requiring a climate compatable with their needs, while a return to the Hadean climate today would obviously be a "wheels-fallen-off" situation.
But the physics isn't like that. While a directly-human-caused 1,200ppm CO2 world would result in an additional CO2 boost from warmer oceans & Arctic, any resulting additional temperature rise will be limited so a result like Venus or the Hadean is an impossibility. But that additional CO2 boost will be big enough to make what is an already-very-very-difficult situation for humanity very-very much worse. I would suggest that the increase in suffering from that additional CO2 boost would be enough for some to call it a "runaway" situation.
But some may disagree. Boosting a warming of +6ºC up to +9ºC perhaps would not constitute "runaway" if human civilisation will have been ajudged to have already suffered that "wheels-fallen-off" situation without the additional natural feedbacks.
I don't know if that is helpful in the response set out @735.
-
Eclectic at 16:11 PM on 12 June 2019Climate's changed before
TVC @735 , there's no scientific study [to my knowledge] supporting "Runaway" greenhouse effect being possible on Earth. I think those friends of yours are suffering from a fantasy life of runaway strawman arguments.
Perhap they misunderstood something they heard somewhere.
-
Eclectic at 16:03 PM on 12 June 2019Medieval Warm Period was warmer
RBF @250 , your "facts" sound a bit confused.
You are suggesting that the sealevel fell two feet over several centuries from the Medieval Warm Period until the depths of the Little Ice Age. Please cite your supporting source for your extraordinary statement ! (And over a total cooling of about half a degree Celsius ~ truly remarkable ! )
-
TVC15 at 15:20 PM on 12 June 2019Climate's changed before
Can you guys help me to understand how to respond to these types of claims?
CO2 levels were 24,000 ppm CO2 for nearly 3 Billion years and there was no runaway greenhouse effect.
CO2 levels were 8,000 ppm CO2 for several Million years and there was no runaway greenhouse effect.
CO2 levels were 2,000 ppm CO2 for several Million years and there was no runaway greenhouse effect.
So, why would 1,200 ppm CO2 over a few centuries cause a runaway greenhouse effect?
It wouldn't. It's just fear-mongering alarmism by a man who makes his money proffering this nonsense.
Thanks!
Moderator Response:[PS] Just a little bit effort with the search button would find the answers to most of these as would a read of the IPCC WG1.
-
RBFOLLETT at 14:41 PM on 12 June 2019Medieval Warm Period was warmer
Wow, a hundred answers, but I think most of them missed the obvious. Everyone keeps focusing on the mythic global mean temperature that they say they can measure into the decimals (BS). They have been talking about sea level rise for the past 30 years almost within every sentence that contains the words global warming. So take a look at sea levels during the Medievil Warm Period then. Historical sea level charts show sea levels almost a foot higher than today and better yet actual History and living proof confirms historic Sea Ports miles inland from current sea shores. Actual physical empirical EVIDENCE that establishes sea levels much higher than today in the Medieval Warm Period, no science, no theory, no BS, just ABSOLUTE PROOF. The same goes for the the Mini Ice Age Cooling, sea level was down almost a foot from what it is today, again no BS, just Absolute Proof. Surely to God the Scientists are not now disputing the link between warming and sea level rise? What does it take to accept actual physical empirical evidence over scientific theory? Why go back tens of thousands of prehistoric years ago to predict what’s going to happen in the next hundred years, when you have historical evidence from the last 2000 years. Obvious cycles of warming and cooling are there in the sea level charts, a $10 tide gauge proves we have been warming for the last 250 years with another foot to go before we reach the levels of 450 years ago. Man (and the Polar Bears) have already survived a much warmer Earth, it’s a fact not a theory.
Moderator Response:[DB] "So take a look at sea levels during the Medievil Warm Period then"
Sea levels are extremely likely (95%) higher know than at any point in the past 2,700 years.
Thank you for taking the time to share with us. Skeptical Science is a user forum wherein the science of climate change can be discussed from the standpoint of the science itself. Ideology and politics get checked at the keyboard. As this venue is based on credible evidence for claims and using the scientific method at all times, the onus is on each participant to be able to cite credible sources for claims made. Your above claims about past sea levels with respect to those in the modern era are without merit and demonstrably false.
Please take the time to review the Comments Policy and ensure future comments are in full compliance with it. Thanks for your understanding and compliance in this matter.
Off-topic snipped.
-
RedBaron at 08:41 AM on 12 June 2019State of the climate: Heat across Earth’s surface and oceans mark early 2019
@swampfox,
You make an interesting hypothesis. However, your hypothesis lacks any evidence for it, and has quite a bit of evidence against it. So I would suspect you are a very very long way from supporting your assertions.
More importantly as it applies to agriculture though, those who claim moving their cattle daily is indeed biomimicry are obtaining spectacularly better results than those who fence their cattle near streams and leave them there.
There are huge improvements to both the animals and the grasses and forbs of the prairie and even a measurable increase in carbon sequestration of the soil when managed holitically with our new understanding of grassland ecology.
We have fossilized paleosoil evidence:
Cenozoic Expansion of Grasslands and Climatic Cooling
We have observational evidence from YellowStone how predators forced herbivores away from lingering near rivers and how that improves ecosystem function.
In agriculture using biomimicry we have measurable evidence from modern tallgrass prairies:
and from drier shortgrass prairie:
Effect of grazing on soil-water content in semiarid rangelands of southeast Idaho
Notice on the last two that there was even an improvement over the controls without any grazing.
We even have evidence that many prairie grasses will simply die out if not periodically grazed or burned. This due to the grasses going moribund and choking on old material.
Fire is a big component to the success of grasslands, large or small. Controlled burns, with a permit, are recommended every 4–8 years (after two growth seasons) to burn away dead plants; prevent certain other plants from encroaching (such as trees) and release nutrients into the ground to encourage new growth. A much more wildlife habitat friendly alternative to burning every 4–8 years is to burn 1/4 to 1/8 of a tract every year. This will leave wildlife a home every year and still accomplish the task of burning. The Native Americans may also have used the burns to control pests such as ticks. If controlled burns are not possible, rotational mowing is recommended as a substitute.
One of the newer methods available is holistic management, which uses livestock as a substitute for the keystone species such as bison. This allows the rotational mowing to be done by animals which in turn mimics nature more closely. Holistic management also can use fire as a tool, but in a more limited way and in combination with the mowing done by animals.[1]
So the weight of the evidence leads one away from the understanding you have and towards the new more modern understandings we recently discovered in just the last few decades.
-
nigelj at 07:40 AM on 12 June 2019Climate change: sea level rise could displace millions of people within two generations
Island nations in the Carribean, Pacific and SE Asia are at particular risk from rising seas, and many of these are near the tropics so also at risk from more heatwaves. People from the Caribbean could probably be accommodated in the Americas, but the numbers at risk in places like Indonesia, Malasia and Taiwan is larger and going to cause some real refugee problems, especially for adjacent potential destination countries like Australia, China, Myanmar, Vietnam which are also particulary vulnerable to sea level rise and already have huge population pressures of their own.
It's not going to be easy to resolve such issues on top of exising refugee problems caused by natural disasters, economic and political problems. Climate change could tip all this so it spirals out of control.
-
TVC15 at 05:30 AM on 12 June 2019Climate's changed before
Much appreciated MA Rodger, Electric and Scaddenp!
-
One Planet Only Forever at 01:51 AM on 12 June 2019Lobbying against key US climate regulation ‘cost society $60bn’, study finds
Related to my comment @3, and another exercise in improving my understanding by practising the presentation of it, is the following alternative presentation of the same fundamental abductive reasoned 'explanation of what can be seen to be going on'.
Competition for status judged by popularity and profitability is likely to develop harmful results because it encourages a narrower more selfish worldview. And narrower more selfish worldviews tend to excuse actions perceived to be personally beneficial but are understandably harmful to Others. Self interest can easily develop harmfulness. And those developed harmful results will resist correction. The more popular and profitable an activity becomes the more powerfully it can and will resist losing developed perceptions of status (resisting correction).
Divisiveness in societies develops when misleading marketing creates a large enough group of supporters for a harmfully incorrect understanding that increases or prolongs the popularity or profitability of an unsustainable harmful activity. Good helpful people are not on 'both sides of those harmful divides'.
Regarding the climate science divide, the Good Helpful people include those who try to raise awareness of the extreme but possible levels of harm that could be done to the future of humanity by a lack of rapid correction of the harmful popular and profitable activity that has developed. Evaluations pointing out the harm done to the current day generation by the lack of correction in the past, such as this report, are also helpful. This study points out the future harm done by the lack of correction by people in the past.
The Other side includes people who try to maintain harmfully developed ultimately unsustainable perceptions of status (even people trying to come up with more gradual reductions of the rate of harm done in attempts to maintain developed perceptions of status and prosperity). It also includes people who try to argue that doing harm to the future generations of humanity can be justified by of any of the following harmful misleading marketing claims:
- The highest status people being required to give up some of their status to help Others is an unjustified demand. It incorrectly implies that all Winners are 'deserving' and therefore are immune to correction that would reduce their perception of status (Perception of status needs to be corrected to be based solely on helpfulness to improving awareness and understanding to develop sustainable improvements for the future of humanity, with associated sacrifices/loses of incorrectly developed perceptions of status).
- One person's actions are insignificant, leading to one region's actions being considered insignificant, or leading to the claim that 'someone else has to behave better first' which is a claim that can only be justifiably applied to the ones with the highest status. The highest status should lead by example even if they will lose some developed perceptions of status if they behave better (Failing to behave better because of the excuse that their peers may not behave better is a lousy excuse).
- The current generation is not being harmed at this moment. Even the evaluation reported is about harm done to a future population (now the current day population) by the lack of correction by a previous generation (then the current generation that was not 'harmed in their moment by the lack of correction').
- There is uncertainty regarding 'how much harm is being done in the future'. Demanding absolute certainty, to the satisfaction of people who do not want change or correction, before correction is required is the classic harmful activity defence.
- Monetary evaluations of harm done to the future generations are justified by a monetary comparison that says it is more costly for the current generation to stop harming the future generations than the calculated harm done to the future, with the future harm discounted. Harm to the future generations cannot be justified. (One person, or sub-set of humanity, benefiting by harming another person or sub-set (the future of humanity is the largest 'sub-set'), is not acceptable, no matter what a monetary evaluation says. Contributing to harming the future of humanity is undeniably inexcusable).
-
swampfoxh at 00:49 AM on 12 June 2019State of the climate: Heat across Earth’s surface and oceans mark early 2019
I plan to chat with EliVA about it today
-
swampfoxh at 00:46 AM on 12 June 2019State of the climate: Heat across Earth’s surface and oceans mark early 2019
RedBaron
But the rest of your observations are demonstratively "right on" and I am pleased to see it in print. Thank you.
-
swampfoxh at 00:38 AM on 12 June 2019State of the climate: Heat across Earth’s surface and oceans mark early 2019
RedBaron
Don't think grazers have much to do with it. Bison never stomped through sixfoot prairie grass, head down, liable to run into a predator, they stayed along the rivers where there was water. The reason the white man killed off most of them was that the railroads ran close to the river floodplain and hundreds of riflemen could ride in open coaches and shoot the poor hapless creatures. There are thousands of square miles of the "Great American Desert" with hardly a creek, these areas were fostered by rainfall, not creeks. Those vast grasslands never saw a ruminant. Those grasses lived and died in soil delivered by the effects of the last ice age. Had the plow not dug the place up in a frantic attempt at dry land farming, it would still be a grassland and were it not for mining the Ogallala Aquifer, it would still be the Great American Desert...mostly empty of Bison more than a mile or two from the scarce rivers.
-
One Planet Only Forever at 14:00 PM on 11 June 2019Lobbying against key US climate regulation ‘cost society $60bn’, study finds
Detailed analysis like this is an important improvement of awareness and understanding of what is really going on. But, as proven by the climate science case, there are limits to the 'uptake' of improvements of awareness and understanding of what is really going on, especially when that improvement would require corrections of developed perceptions of status or developed perceptions of personal opportunity to enjoy life.
The problem is not things like 'lobbying' or 'money in politics'. Those are just examples of actions that can be helpful or harmful to the development of a sustainable and improving future for humanity.
The problem is the success of harmful actions.
Social systems that rely on popularity or profitability to determine Winners and Losers can be seen to encourage the development of harmful selfishness. A lack of governing based on the importance of improving awareness and understanding to help develop a sustainable better future for all of humanity can be expected to produce the observed harmful, and ultimately unsustainable, results.
Leadership that understands and honours the importance of developing a sustainable better future for all of humanity would not be influenced by the type of lobbying or money influence that is succeeding in the USA, unless they believe they risk losing their leadership roles if they try to honour that important understanding.
Leaders compromising what is understandably required in the hope that doing so will improve their chances of 'remaining a leader' is a downward spiral. It resulted in the likes of Donald Trump and Mitch McConnell and the House Freedom Caucus becoming harmfully influential in the USA (and similarly harmful people becoming influential in regions of the USA and in other nations). They become more harmfully powerful the more that the group they lead is compromised by selfish interests such as greed and intolerance.
Competition for status based on popularity and profitability encourages selfishness and discourages helpfulness. It encourages the pursuit of individual perceptions of success any way that can be gotten away with. Ungoverned by the requirement to not harm Others (especially the future generations), and without the aspiration to help others (including the future generations), competitions can be seen to encourage people to be more myopically focused on immediate personal benefit. And that push for short term gain any way that can be gotten away with will result in people forming collectives that are focused on their collective (tribe/corporation) benefits in the short term.
A focus on short term benefits for a sub-set of humanity inevitably dismisses consideration of the need to provide benefits into the future. The sustainability of benefits for the sub-set isn't even a serious consideration. The focus is on how to increase or prolong any developed perceptions of status relative to Others without concern for sustainability.
That lack of consideration for Others and the Future easily extends to a lack of concern for climate impacts, biodiversity loss or other harm being done. The focus on maintaining and increasing perceptions of status relative to Others becomes harmfully all consuming. That harmfully consumptive condition can be seen to have taken over the Political Right in many regions of the planet.
Lobbying is not the Problem. The success of harmful selfishness is the problem. And the ability to legally get away with misleading political marketing prolongs or increases that incorrect and harmful success.
Misleading political marketing causes many leaders to incorrectly harmfully dive into the downward spiral of compromising what is understandably required to be done by responsible helpful leaders.
Populations lose good helpful leadership when misleading political marketing is 'legal'. And the future of humanity loses the most because they do not get to lobby, develop and deliver political messages, vote, protest, or launch lawsuits.
-
ELIofVA at 11:07 AM on 11 June 2019State of the climate: Heat across Earth’s surface and oceans mark early 2019
Our Climate Change Series is sponsored by the Environmental Committee of 50 Ways Rockbridge, a coalition of local political activist that formed after the 2016 federal elections. Our purpose is to promote self education and activism. The Environmental Committee started out as the Climate Change Committee. However, seeing existing environmental protections being dismantled, we felt the need to address those issues too, therefore Environmental Committee.
Moderator Response:[PS] edited messages to moderator as per request. Rest of message is informative.
-
scaddenp at 07:30 AM on 11 June 2019Climate's changed before
it should also be noted that D-O and Bond type events are observed when emerging from an ice-age, not during interglacials.
-
barry17781 at 06:25 AM on 11 June 2019Effects of Global Warming
moderato, thanks for the link, I is a long time since i read the paper.
i hope that this will answer your question
nigel, your figures on the relative abundances of halnium are misleading.
you have used crustal concentrations by mass, and wikipedia gives typically 2 to 3 times highe amount
of boron than halfnium.
however for nuclear absorption use one should use mol, since it is by atom that these materials absorb neutronsso this brings the factor of 3 up by 178/11 = 48.
Coupled with the fact that boron is mainly found in lake deposits not in the crust makes this very irrelevant, on top of this there is avast amount of boron in the ocean some 4.5 -4.8 mg/kg which is readily available
I suggestquantity is easily extractable and exceeds the born quantity in the crust so there is a factor of 100 more for the abundance of boron assuming every drop of halfnium is extracted from the crustso Boron is far more abundant than halfnium, and can be readily seperated after use, the unreacted isotope slvaged by distillation and so will become non radioactive.
as for hafnium in civilian reactors I stand by it that it is currently not used to any significant extent
The moltex reactor
"Modest funding now will see Moltex through these approval processes,
initially in the UK and Canada, and through to the construction of the first reactor.
Thereafter the market is almost inconceivably large.Mr Sweet the reactor has not been built! It is a future projection. please do not insult people.
As for Abbotts figure of 20.5 km^2 per reactor, Abbot does not explain the calculation of these figures but his citation does
The originator, Johnson uses US figures, a coutry which has the largest redundant areas for its nuclear facilities nevertherless he states that the
area occupied by nuclear facity and its supprting infrastructure of enrichment, mining and disposal in the states is between 4.9 and 7.9 km^2.
Now a facility can have several reactor typically nowerdays say 6 giving a reactor area of 4.9/6 = 0.8166 km^2 a long way from Abbots 20.5 km^3 a factor of 25!Abbott inflated his figure to include the us buffer zone which can still be used for agriculture or say a solar farm, which Abbott claims is n either or not both!
Please treat Abbotts figures with great caution . It is as I said and he has communicated to me only a demonstration
Moderator Response:[PS] thank you but no more nuclear energy discussions on this topic. Hopefully we will have a more appropriate place for those interested in the subject in the future.
-
dkeierleber at 03:19 AM on 11 June 2019Lobbying against key US climate regulation ‘cost society $60bn’, study finds
Why do you say lobbying is legal?
https://priceonomics.com/when-lobbying-was-illegal/
-
ELIofVA at 23:32 PM on 10 June 2019State of the climate: Heat across Earth’s surface and oceans mark early 2019
Red Barron
You certainly are giving us a lot of info to chew on. In Lexington, Virginia we have a Climate Change Seminar Series to consider nuanced aspects of the subject not considered by mass media. I do not know your background or real name. However, I am wondering if you would be willing to meet remotely via Skype, Zoom, or other platform to further this discussion with us. We could likely get our science knowledgable people to help us evaluate your points. I do appreciate your willingness to write so much with references to further our understanding. From your messages, I know you want to spread your knowledge.
Moderator Response:[JH] I would advise against posting your telephone number on this site — or any other for that matter. If you would like us to delete it, please let us know.
PS - What is the name of the organization sponsoring the Climate Change Seminar series in Lexington, VA?
[PS] Personal contact details removed as per request
-
MA Rodger at 23:27 PM on 10 June 2019Climate's changed before
TVC15 @730,
I wrote @729 "climate can change rapidly without humans emitting CO2" but added that this "does require millions of cubic kilometres of strategically-placed ice that would be difficult to miss". I was thinking a little more broadly than suggested by Eclectic @731. In very simple terms, rapid bits of climate change results from obvious causes.
A big volcano (like Mt Toba c73ky bp) or an asteroid strike fall into that category but the climate quickly reverts back afterwards. Big ice sheets can cause rapid change which lasts far longer. I had in mind two different ice-induced phenomenon, a big one and a rapid one although properly I was only thinking of the "rapid" one.
By the "big" one, I mean the ice-age cycle itself which swings global average temperatures by perhaps 6ºC but takes millennia to achieve this (not very rapid) as it requires the melting of millions of cubic kilometres of ice (43 million in the last deglaciation). The major factor in the swing is the change in albedo due to the growing/shrinking ice sheets. CO2 as a factor is smaller, and the result of what Ganopolski1 & Brovki (2017) [PDF] call a complex "stew" of many mechanisms which don't all work to increase the ice-age effect.
So for ice-age cycles to happen, we do require tens-of-milions of cu kms of ice to melt/freeze on top of the correct bits of land.Significant & "rapid" climate change (at least on a regional scale) can be seen in the Younger Dryas and in Dansgaard–Oeschger events. While there is some remaining cotroversy with the Younger Dryas (so let's not go there), it appears reasonably uncontested that the Dansgaard–Oeschger events result from the AMOC suddenly switching back on having been previously slowly strangled by big unstable ice sheets melting/discharging icebergs. The AMOC-forced-by the ice melt/discharge switching on & off messes up regional climate and produce the big and rapid changes in regional temperature, Greenland ice cores recording a number of regional swings of +5°C in less than half a century. (Note that wIth polar amplification, you'd expect "humans emitting CO2" under BAU to manage a similar-sized swing.) But when the ice-age melts away & "without humans emitting CO2", there is little ice to mess with the AMOC during the less-dramatic Bond events which have little impact on even local temperature.
-
michael sweet at 22:55 PM on 10 June 2019Effects of Global Warming
Barry,
Another poster recommended the Moltex reactor for the future. From their site:
"The molten fluoride coolant salt in the SSR contains hafnium"
Hafnium is used in critical locations of civilian plants. If you do not know the FACTS you look stupid lecturing others who do. Read the background information.;
-
Eclectic at 21:47 PM on 10 June 2019Climate's changed before
TVC15 @730 , he was referring to the vast amount of ice in the Laurentide ice sheet and the subsequent formation & draining of Lake Agassiz (the outflow of cold water, thought to be the main triggering of the Younger Dryas event ~ i.e. that brief hiccup during the initial warming-up phase of the Holocene).
-
michael sweet at 20:38 PM on 10 June 2019Effects of Global Warming
Barry:
The moderator has asked that the discussion be taken to other locations. I will not go, it is a waste of my time. I think the regular readers of this forum have already made up their minds one way or another. My experience is these discussions rarely change minds.
Abbott 2012 was published in the Bulletin of Atomic Scientists by invitation. You cannot be serious in your comments.
The isotope was Yttrium-90. We were making anti-cancer treatments. Are you knowledgable enough that this makes a difference to you??
-
nigelj at 19:05 PM on 10 June 2019Lobbying against key US climate regulation ‘cost society $60bn’, study finds
Lobbying isn't going to go away and is a legitimate activity in a free society, but it's just not always a level playing field. How can public interest groups, sometimes fronting poor communities over local environmental issues hope to compete with multi national corporations?
Regarding Waxman-Markey, maybe the firms thinking they would loose just happened to have the best lawyers.
This is relevant, and the first example is the oil industry and the Koch brothers: The best influence money can buy - the 10 Worst Corporate Lobbyists
-
nigelj at 13:35 PM on 10 June 2019Effects of Global Warming
Barry, you say that boron and gadolinium are "far more abundant" than hafnium" . A quick look at "abundance of earths elements in earths crust" on wikipedia shows that gadolinium and boron are about twice to three times more abundant than hafnium. I would not necessarily call that far more abundant, and whether they are in accessible sorts of places is another question. You also don't offer proof that boron and gadolinium are "abundant enough" to provide enough materials for a mass roll out of nuclear reactors ( at affordable cost obviously). It would need an in depth analysis of known reserves, and their accessibility and reactor requirements and you offer none of this.
I think the point is we could discuss this it will probably go around in circles. If people object to Abbot's published research, and want to be taken seriously they should a) publish a proper peer reviewed opposing point of view or b) take up the offer made to submit a proper article to this website which should include references to source materials. The fact they do neither does not inspire one with great confidence.
And I'm told a lot of rare earth materials are in China who could in theory restrict the supply. No doubt America has rare earths but it takes a very, very long time to develop new mines so this is not helpful for the climate problem.
I have no firm objection to nuclear power, and no technical expertise but I do know the present water cooled technology has a lot of problems and new technology like molten salt lithium reactors remains experimental and is slow to develop, so our best bet in the meantime looks to be renewables.
Moderator Response:[PS] Sigh, this is now way off-topic. Nuclear debates tend to derail other discussions and this one looks to be no exception. We have asked for nuclear proponents to write a guest post where such discussions could continue (which would need to discuss Abbott with peer-reviewed references) but so far no takers. If Doug C or barry want to volunteer then go for it.
Meanwhile I suggest that nuclear power debates be taken to another more suitable forum. Bravenewclimate would seem to a more appropriate place.
-
sailingfree at 12:34 PM on 10 June 2019Models are unreliable
Dana's YouTube graphs are spectacular!
I've been looking for such model comarisions that show years 2016, 2017, 2018 because most everthing I find is way out of date and shows the models being too high. I'd love to see those graphs directly on this site, since I'd rather use skepticalscience.com for a reference thanYouTube.
-
barry17781 at 11:21 AM on 10 June 2019Effects of Global Warming
Michael,
a Curie of high energy beta radiation, could you enlighten us at to what isotope do you refer to?
-
barry17781 at 10:57 AM on 10 June 2019Effects of Global Warming
michael sweet
Abbot did a demostration paper it was not meant to be taken too literally, for example he mentions the limited abundance of halfnium as a control (which is limited to military reactors) civilian reactors use boron and some gadolinium which are far more abundant than halnium, a completly irrelevant FACT that you should know.
please put out the abbott reference so that others can judge it
Moderator Response:[PS] The Abbott paper can be found here. What you mean by "demonstration" paper is unclear nor why you infer it was not meant to be taken too literally.
-
scaddenp at 07:52 AM on 10 June 2019Increasing CO2 has little to no effect
ebelba - sorry for delay - no internet over weekend. Clouds are indeed one tough issue for feedback predictions. Clouds are both a positive and negative feedback depending on whether high or low. This is not well captured in climate models (cell size in models is too large for the processes involved) so figuring out how that would change with increasing water vapour is challenging. I am not aware that uncertainties for individual components have changed significantly since those published in Fig SPM.5 (see text for sources) of IPCC WG1 or table 8.6 in the main text. Chpt 8 has the main coverage of this. There has been a focus recently on trying to establish empirical constraints via paleoclimate archives and direct observations. For recent work, see for example Dessler and Forster 2018. For paleo, see say Hansen & Sato 2012. Their model/observation fit for a sensitivity around 3 impressed me.
I dont think there is any escaping the problem that governments need to set policy despite stubborn uncertainties in the values of ECS; but need to do this on basis of a best estimates being close to 3.
-
scaddenp at 07:24 AM on 10 June 2019Climate Change Denial book now available!
joedg - the water goes into the sea. It is a component of sealevel rise.

-
RedBaron at 06:44 AM on 10 June 2019State of the climate: Heat across Earth’s surface and oceans mark early 2019
@swampfoxh,
You asked, "I don't get the points about c3 and c4 grasses nor the subordination of trees-to-grass as a less carbon effective sequesterer"
Most trees and some grasses are C3. but warm season grasses are C4. Since the C4 pathway is at least 5-10 times more efficient at photosynthesis, those plants primary productivity of products of photosynthesis start out many times greater baring other limiting factors. One of the main limiting factors in temporate grasslands is winter. So the solution that evolution came up with is a biodiverse mix of C4 and C3 grasses and forbs that each have a season they are dormant and a season they become dominant or co-dominant. This extracts by far the most solar energy and converts the most CO2 to sugars and proteins as compared to the more primitive forest ecosystems. (temperate forests produce almost no photosynthesis from fall all the way through winter and early spring while grasslands do produce photosynthesis with C3 cool season grasses and forbs) So the grasslands start out by fixing much more CO2 to begin with.
Then we consider where the bulk of that fixed carbon is stored. In a forest it is mostly stored above ground in woody biomass and leaves. A large amount is also stored in the top O-horizon of the soil. Almost all this stored carbon will ultimately be returned to the atmosphere as CO2 and methane by fire and/or the processes of decay though. A climate scientist would call this short cycle carbon. A soil scientist calls it labile organic matter. It really isn't sequestered long term in any geological timeframe. (or at least most of it isn't)
In a grassland we have much more primary productivity, but much less biomass storage as compared to forests. So the century's old question became what happened to all the rest? We sort of knew somehow it ended up as soil, because grasslands soils, particularly the Mollic epipedon, are many many times thicker and hold hundreds of times more carbon than most forest soils per acre on average. (there are some notable exceptions) But even that didn't quite add up. This is where the new research is beginning to reveal these questions.
What we term the LCP is actually a biochemical pathway whereby CO2 first becomes fixed by photosynthesis, then becomes stored in the plants as sugar rich compounds and basic proteins forming sap, then flows downward through root exudates to feed symbiotic mycorrhizal fungi in trade for weathered and scavenged nutrients otherwise not bioavailable to the plant, metabolised into soil glues called "glomalin" to form a network of structured tunnels and pore spaces in the soil, which ultimately forms humic polymers tightly bound to the soil mineral substrate that creates new fertile soil.
Climate scientists call this sequestered long cycle carbon to differentiate it from short cycle stored carbon in woody biomass. According to Dr Christine Jones in total approximately 40% of the total products of photosynthesis can follow this pathway under appropriate conditions and as it decays into soil about ~79% +/- of that carbon stays put rather than returning to the atmosphere as CO2. (again under appropriate conditions) Soil scientists call this stable carbon. However, the products of photosynthesis that are used by the grass to make above ground biomass also decay right back into CO2 much like the forests' above ground biomass. That's the labile carbon again. Well over 90% of labile carbon returns to the atmosphere as CO2 and methane on average. (with a few notable exceptions)
So it is critical to understand that difference between what soil scientists call labile carbon and stable carbon or what climate scientists call short cycle and long cycle carbon. Grasslands take hundreds of times more short cycle carbon and divert it to long cycle carbon as compared to most forests. (with a few notable exceptions)
You then asked, "Also, what is the proportional value of phytoplankton in this "sequestration" activity? And what is the impact of the recent news that some 40% of phytoplankton have disappeared from the world's oceans since 1952?"
Frankly this does actually scare me. As a retired marine engineer I know that anyone who fails to respect the power of the ocean risks death. ANYONE and EVERYONE. As a metaphor, you seriously do not want to be around when Poseidon releases the Kraken. As you can probably tell, this causes my normally rational brain to short circuit into irrational fear. And I seriously do love the ocean! But it is ingrained in me that much through many trials and tribulations that we are absolute fools to mess with the ocean ecosystems as we are currently. It's the one thing actually powerful enough to cause human extinction.
Back to rationality for a second though. I am not a marine researcher. Once years ago as a marine engineer on a research vessel I rubbed elbows with marine researchers occasionally, but I am not nor ever have been a marine scientist of any sort, not even amateur. Given that, I'll tell you what I have read over the years. One of the key things to remember is that most the ocean sequestration is focused around shallow seas and coastal areas with saltwater marshes and mangrove forests sequestering from 50-90% of biomass into stable forms. This is indeed one of those notable exceptions mentioned above. Also it is 2 to 35 times more carbon sequestration than even deep ocean phytoplankton!
Understanding Coastal Carbon Cycling by Linking Top-Down and Bottom-Up Approaches
Some of that carbon came from the upland grasslands too though. Because those humic polymers that are tightly bound to the soil mineral substrate will generally stay bound when the soil erodes and floods coastal areas then settle out as silts.
You asked, "are you taking the position that animals grazing the Great Plains helped create the soil there ?"
Yes. A resounding unequivocal yes! They co-evolved and the animals are every bit as important as the microbiome and the plants.
Now for agriculture we can mimic this relationship if we understand how it functions. A cow is not a bison nor an antelope, but if we manage it correctly we can mimic that ecosystem function and use it to create soil too. But in order to do that you must first understand the function of the vast herds in a grassland/savanna/open woodland biome.
"Permaculture is a philosophy of working with, rather than against nature; of protracted & thoughtful observation rather than protracted & thoughtless labor; & of looking at plants & animals in all their functions, rather than treating any area as a single-product system." Bill Mollison
-
TVC15 at 02:24 AM on 10 June 2019Climate's changed before
Hi MA Rodger @ 729
I truly appreciate that response! I'm learning so much from your responses!
However I don't know what you mean by this:
(but which does require millions of cubic kilometres of strategically-placed ice that would be difficult to miss)?
Thank you!
-
DPiepgrass at 01:40 AM on 10 June 2019Should a Green New Deal include nuclear power?
It's not fair, either, to dismiss new nuclear power on the basis of two failed startups while ignoring all the other activity that is still going on. Among molten-salt reactor enthusiasts centered on Gordon McDowell, Kirk Sorenson et al., TransAtomic power wasn't given much attention and Kirk Sorenson viscerally rejected the travelling wave reactor design (the one promoted by Bill Gates), saying "it's just so darn hard!"
I've been looking at MSRs for years with great interest. My favorite reactor designs right now are the Stable Salt Reactor by Moltex and the IMSR by Terrestrial Energy. I was a big fan of ThorCon - they have a great plan logistically speaking, but they require a generous regulatory environment to build their reactor (e.g. they seem to want to use uranium fuel enriched to 19.75% U-235 which is four times higher than most other reactors use, and they want a testing-based certification scheme rather than the traditional "prove it works on paper first to the eggheads in NRC" model)... I think it will be much harder to get the desired regulations than they seem to think.
-
DPiepgrass at 01:13 AM on 10 June 2019Should a Green New Deal include nuclear power?
What I hate about these discussions is that they assume the status quo must continue. "We can't have new nuclear plants until 2033" is a prediction purely based on the status quo - the current level of government support for nuclear power (tepid at best), the current regulatory structure in the US (which penalizes innovation), the current investor appetite (which of course is low if there are no carbon fees, only tiny subsidies for better nuclear technology, and no good supply chain for building reactors).
If this were any other clean tech people would ask for more government support. But I don't think people realize that baseload is actually important, like, really. -
MA Rodger at 21:52 PM on 9 June 2019Climate's changed before
TVC15 @728,
This is probably not the answer you were expecting.
You're asking about three seperate things, two of which are far from straightforward - ☻ The trigger that ended the last ice age, ☻ The melting of the Laurentide ice sheet and ☻ The Younger Dryas episode - and these linked to some denialist argument which is not so evident.
Thinking about the linkage to denialist argument:-
Is it that it shows climate can change rapidly without humans emitting CO2 (but which does require millions of cubic kilometres of strategically-placed ice that would be difficult to miss)? Is it that we do not know exactly what happened 20k & 13k ago so how can we be sure about today (when we do see exactly what is happening today, or exactly-enough)?
I have to say I cannot see how any denialist argument would begin to stand up.So what triggers a de-glaciation. Milancovitch cycles of course. But can you see these triggers. (Image from here.)
The triggers aren't so obvious as the ice-age needs to be primed as well as triggered. Ice-ages used to occur every 40ky but over the last 1,000ky they last 100ky. (I think there's been some progress towards answering why - possibly more exposed bedrock.)
And within ice-ages there are other events that still come with significant questions - Dansgaard–Oeschger events, Heinrich events and the Bølling-Allerød warming that immediately preceeded the Younger Dryas.While you asked for some reading, let's start with a 32-second video, the melt-out of the Laurentide ice-sheet.
Note in the video the big lakes that build in the millennia before 13kybp. The initial take on the Younger Dryas was that it was the sudden draining of these lakes that caused the AMOC to collapse & precipitate the Yonger Dryas. But evidence for such an outflow remains elusive (the Wikithing references to a Mackenzie River outflow are Murton et al 2010 & Keigwin et al 2018), but some research suggests it has to be more complex than that.
And in all that, there is the wonderous Impact Hypothesis (& apparently others according to Wikithing Younger Dryas page). So it all gets a bit heated at times, but probably not enough to melt out an ice sheet. -
swampfoxh at 20:32 PM on 9 June 2019State of the climate: Heat across Earth’s surface and oceans mark early 2019
RedBaron
One more thing...are you taking the position that animals grazing the Great Plains helped create the soil there ?
-
swampfoxh at 20:04 PM on 9 June 2019State of the climate: Heat across Earth’s surface and oceans mark early 2019
RedBaron. I am familiar with EliofVA's treatment of emissions in the form of an economic perspective...we are personally acquainted. I am familiar with the role of A Miccorhizae's symbiosis with plants and it's participation in carbon sequestration, but I don't get the points about c3 and c4 grasses nor the subordination of trees-to-grass as a less carbon effective sequesterer...I hope I'm making sense, here...Also, what is the proportional value of phytoplankton in this "sequestration" activity? And what is the impact of the recent news that some 40% of phytoplankton have disappeared from the world's oceans since 1952?
-
RedBaron at 18:18 PM on 9 June 2019State of the climate: Heat across Earth’s surface and oceans mark early 2019
@7 barry,
I wrote this to help people understand Methane fuxes and how it relates to agriculture.
What reaction can you do to remove methane?
And I wrote this to take in the whole picture, including crop production and animal husbandry for ever major food system on the planet. There are a few minor gaps, but all the major food sources are covered worldwide.
-
Fermin Francisco at 11:45 AM on 9 June 2019Introducing a new citizens initiative for carbon pricing in Europe
A simpler way to involve companies and grassroots in global warming action is thru the profit motive. For instance, Climate Funds may set up 'green entrepreneurship' programs that bring together producers of ethanol in Brazil, USA and India to design small to medium scale ethanol distilleries for the tropics, using sweet sorghum as feedstock. The resultant schemes will attract entrepreneurs, co-ops and financiers in the tropics to set up the projects due to trust and feasibility, (producers can't go wrong) + Climate Funds' assistance, + profits above 50%. The profit motive, which largely polluted our planet, can also clean it up!
-
GrahamC at 10:02 AM on 9 June 2019It's magnetic poles
Thanks for the replies.
I have this 2017 article from Nature - Geological support for the Umbrella Effect as a link between geomagnetic field and climate by Kitaba et al which says:
Recent palaeoclimatic research has revealed that geomagnetic polarity reversals coincided with climatic cooling. Two anomalous cooling events are observed during the Matuyama‒Brunhes and Lower Jaramillo geomagnetic reversals, which occurred ca. 780 ka and 1,070 ka, respectively, in palaeoclimatic records from Osaka Bay, southwest Japan. These cooling events cannot be explained by conventional Milankovitch theory and seem to have occurred across a widespread area in low- and mid-latitudinal regions, such as southeastern Siberia, Italy and Israel.
That would seem to rule out pretty effectively that the current warming is due to weakening of the earth's magnetic field, wouldn't it?
-
barry17781 at 08:20 AM on 9 June 2019State of the climate: Heat across Earth’s surface and oceans mark early 2019
RedBaron
In grassland do you know what is the balance between the cattle emission and the sequestration of carbon. Methane is stil a minor greenhose gas as far as effect is concerned and is of short lifetime.
Traditional cropping of wheat etc is known to cause erosion of soils and so loss of carbon capture potental and possibly a worse option than pastoralism. We have bean counters that only look at the emissions in agriculture and do not take in the whole picture - whichI suspect no one as yet knows
-
michael sweet at 05:38 AM on 9 June 2019Effects of Global Warming
DougC,
Sorry I am late to your party, I was out of town.
I seem to recall you posting pro nuclear propaganda a few month ago here. Once again you are posting off topic so I cannot reread our previous discussion. You seem to me to be repeating yourself which is prohibited by the comments policy. Unfortunately, no nuclear supporters are willing to write an OP in support of nuclear so you have to post off topic.
Your posts contain too much that is patently false to address all your issues so I will summarize.
Your discussion of nuclear does not include the vast areas needed as safety buffers around nuclear plants. It has been calculated that as much as 22 km2 is required for each nuclear plant, far greater than your simple assertions.
Your assertions that energy density is required is simply false. It has been widely demonstrated Jacobson 2018, Connolly et al 2016 , Aghahosseai et al 2019 (Aghahosseai has at least 20 references to other studies that provide 100% power using renewable energy) that renewable wind and solar power can easily power the entire economy for the entire world. By contrast, Abbott 2012 demonstrated that the rare metals required for nuclear power stations do not exist. Dittmar 2012, a widely respected nuclear physicist, states that any money spent on nuclear, including research, is wasted and should be spent on renewable energy instead.
I am sick of your claims about radiation for these reasons:
- I never use the danger of radiation as a reason not to build nuclear because I know nuclear proponents do not care about the safety of reactors and it is a waste of time to bring up safety.
- I rarely hear others use arguments of safety as a primary reason not to build out nuclear.
- I have years of experience and extensive training handling high levels of radiation: I have held a curie of high energy beta radiation in my unshielded hand (for those like you who do not know anything about radiation that is a very large amount of radiation). What is your experience and training that allows you to lecture me about radiation safety? Please do not say you read about it on the internet.
- Recent newspaper reports document scientists finding that large numbers of trace "not harmful" chemicals are damaging all of us. Arguing that we should allow more radiation into the mix is insane.
Your reference claims 10,000-30,000 reactors are needed to power the world. Your number of 15,000 is low. You should use at least 20,000. Abbott 2012 gives 13 reasons why nuclear can never be built out to this extent. Please say where you would locate the 4,000 reactors needed for the USA alone.
Your statement "wouldn't that require several trillion comparable renewable energy sources." is simply uninformed BS. Jacobson 2018 calculates about 4 million total power systems, mostly wind and solar and an additional about 1 billion solar panels on houses and buildings. Your estimate of "trillions" is off by a factor of millions and is deliberately false or deliberately uninformed. Read the background so that you do not make these gross errors.
Why should I believe anything you say when you make gross, uninformed errors like this??
The French Nuclear regulatory agency has stated that generation 4 reactors are no safer than current designs. Your claims of safety are simply industry propaganda. This applies to your claims of less expensive reactor enclosures.
Alloys that can withstand the intensive neutron flux and the extraordinary corrosive environment of a liquid reactor for 40 years have not been identified. The ability to clean up the waste stream from the liquid fuel has not been demonstrated at industrial scale. Utill materials are found and techniques demonstrated the reactors cannot be constructed. By the time these are demonstrated it will be too late. We must build out non-carbon power now.
Nuclear proponents complained about materials needed to build out renewable energy 10 years ago. Jacobson 2011 details all the materials needed to power the entire world all power and showed that all materials except for rare earth elements needed for wind turbines exist. Since then the turbines have been redesigned so they do not use rare earth elements.
By contrast, Abbott 2012 shows that rare metals needed for construction of nuclear power plants do not exist. The nuclear industry has not challenged his papers so we must assume Abbott is correct.
We cannot do the materials comparison you demand because the data for nuclear plants does not exist to compare to the readily available data for renewables.
I become angry when nuclear supporters make these fatuitous arguments and parrot industry propaganda unsupported by data. Serious posters then doubt that renewable energy can generate enough energy when many peer reviewed papers clearly demonstrate renewable energy can generate enough power. This is exactly the same technique fossil companies use to sow doubt in all efforts to deal with AGW.
-
TVC15 at 05:13 AM on 9 June 2019Climate's changed before
Hi again,
I'm not sure where to post this but I think this might be the correct thread since it deals with past changing climate.
I'm dealing with deniers who are questioning what caused the end of the last ice age and the melting of the Laurentide ice sheet?
I came across this 2015 article with respect to the Laurentide ice sheet and wanted to know if there are other studies you can point me to.
However with respect to the Younger Dryas I came across this: The Younger Dryas.
For some reason the deniers seem to think these two events somehow "prove" that human caused global warming is a hoax generated to "take our money".
However these two events are not relevent to our current climate situation because we are not at the end of a glacial period.
Prev 234 235 236 237 238 239 240 241 242 243 244 245 246 247 248 249 Next


