


 Arguments


Recent Comments
Prev 2423 2424 2425 2426 2427 2428 2429 2430 2431 2432 2433 2434 2435 2436 2437 2438 Next
Comments 121501 to 121550:
-
Ned at 04:19 AM on 31 March 2010Climategate CRU emails suggest conspiracy
It's particularly silly to complain about "loss of data from UEA" since there are now a whole bunch of replications of the same results using 100% publicly available data from GHCN. If you don't like the UEA temperature reconstruction, use the one from GISS or NCDC or any of the various open-source efforts that people have developed in the past few months. They all show the same thing. Link 1 Link 2 -
Ned at 04:12 AM on 31 March 2010Greenland's ice mass loss has spread to the northwest
Geo Guy, you've got that backwards. There are multiple independent lines of evidence showing that Greenland is losing mass both by melting and by discharge from accelerating marine-terminating outlet glaciers. These independent lines of evidence include: (1) gravity data from GRACE, which yields the total mass balance of the ice sheet; (2) laser and radar altimetry measurements of ice sheet elevations; (3) interferometric radar measurements of increases in the velocity of outlet glaciers; and (4) high-precision geodetic GPS measurements of bedrock and ice elevations. I'm going to ignore the suggestion that Greenland is losing 300 GT/year of mass (and accelerating) due to "sublimation," since I assume that wasn't serious. Re: temperature, John Daly is not a reliable source, his graphs don't show data for most of the past decade, and Jan Mayen is not in Greenland. -
Doug Bostrom at 04:11 AM on 31 March 2010Climategate CRU emails suggest conspiracy
kblood, you're claiming that failure of a small research unit to efficiently maintain backups of copies of data obtained from a primary source still able to supply the data in question invalidates all of the research findings presented here at Skeptical Science? Can you demonstrate how the loss of copies of a a few years' temperature data invalidates the work of thousands of persons working in a plethora of fields pursuing numerous lines of inquiry? No, obviously you can't. You make a ridiculous charge, harmful to your own credibility. Take a few moments to read what others write here, rejectionists and skeptics included. Get calibrated, please. -
Albatross at 04:09 AM on 31 March 2010Greenland's ice mass loss has spread to the northwest
This is of interest: http://earthobservatory.nasa.gov/Newsroom/view.php?id=43080 The ice below the melt line does melt in the boreal summer: http://earthobservatory.nasa.gov/NaturalHazards/view.php?id=20178 http://earthobservatory.nasa.gov/IOTD/view.php?id=7569 The area experience summer melt is also increasing: Response: Fixed your broken image and yes, a preview feature is coming.
 -
angliss at 04:05 AM on 31 March 2010Greenland's ice mass loss has spread to the northwest
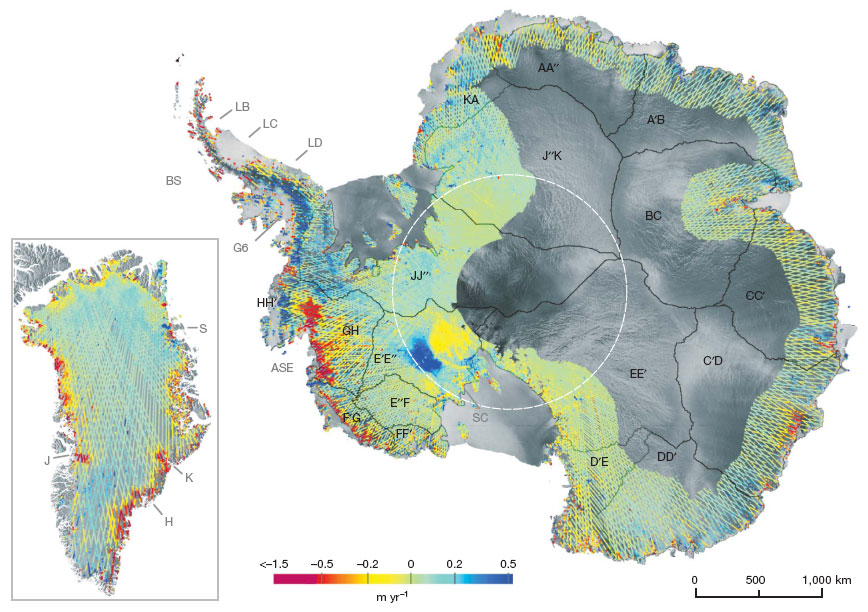
There's also Pritchard et al 2009 that finds significant thinning of glaciers on Greenland. Thinner glaciers means less mass, although how much less mass is more difficult to quantify. Here's an image from the paper (click for a larger version)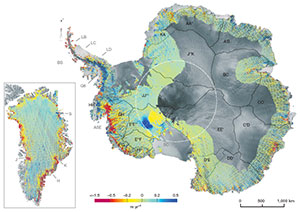 Notice how the thinning matches up with the GRACE and GPS data from Kahn paper. So that's three independent datasets (four, if you include prior radar altimetry data).
Thanks for pointing this one out, John. Now to get a copy of that paper for my own post at S&R.
Notice how the thinning matches up with the GRACE and GPS data from Kahn paper. So that's three independent datasets (four, if you include prior radar altimetry data).
Thanks for pointing this one out, John. Now to get a copy of that paper for my own post at S&R.
-
Albatross at 03:51 AM on 31 March 2010The human fingerprint in global warming
Sorry folks. The PW water link @ 68 is broken. It should be: http://www.pnas.org/content/104/39/15248.full The link for the NERSC summary is also broken: http://www.nersc.gov/news/annual_reports/annrep03/advances/5.1.fingerprints.html -
Geo Guy at 03:48 AM on 31 March 2010Greenland's ice mass loss has spread to the northwest
I think this post characterizes what Alarmists tend to say. The ice is disappearing hence increased CO2 is to blame. Nothing could be further from what is truly happening. For starters, ice can disappear by evaporation and sublimation resulting from wind blowing over its surface. Of course the predictions of massive sea level rises don't factor in this. John Daly, who has written a number of books arguing against the alarmist view, has posted temperature data that he obtained from GISS and CRU. He subdivided the data into regions, including the Arctic, and has data from a number of stations located in Greenland. http://www.john-daly.com/stations/stations.htm What is interesting is the temperature plots from 1930 onwards from stations located on Greenland show consistent temperatures and no rising temperatures - especially the the heights needed to melt glacial ice. Here are a few examples: http://www.john-daly.com/stations/dmkshavn.gif http://www.john-daly.com/stations/egdesmnd.gif http://www.john-daly.com/stations/ilulissa.gif http://www.john-daly.com/stations/janmayen.gif On another note regarding isostatic recovery, it should be noted that the norther part of North America is still rising. Canadian scientists have noted that while sea levels elsewhere in the world have risen marginally, they have found no signs of similar rising in the Canadian artic. They have concluded that this phenomenon is the result of isostatic recovery. What climate scientists need to take into account is the amount of water being displaced by this isostatic recovery - said water of course flowing into the other oceans and contributing to their rise. In other words, not all of the rise in ocean levels can be attributed to glacial melting. Finally you have to understand that when glaciers move, they are not melting but are growing. Glacial ice disappears from melting AND evaporation and sublimation. Since historical Greenland temperatures appear to be somewhat static since the 1930's, and keeping in mid that even if they are warmer than in the past, temperatures still remain sub-zero for most of the year, it is unlikely that any melting of Greenland ice is attributed to higher temperatures brought on by increased levels of atmospheric CO2. Scientists should look elsewhere for the cause if they are serious in trying to determine what is happening there. -
Albatross at 03:45 AM on 31 March 2010The human fingerprint in global warming
I'm a little surprised that there has not been much (if any) discussion yet on the seminal fingerprinting techniques used by Santer and others. Perhaps it is because their technique relies on a combination of observations, modelling and reanalyses (model runs constrained by observations). Regardless, Santer et al. have a few papers in which they make a very convincing case that the response of the biosphere has a marked human influence via higher concentrations of GHGs-- that is, the recent changes cannot be explained solely by internal climate variability or other natural drivers of climate. Here are some links: The human fingerprint on increase in precipitable water over the oceans The human fingerprint on changes in the height of the tropopause And another paper in Science There is also a summary here and here -
pohjois at 02:29 AM on 31 March 2010How you can support Skeptical Science
Congratulations for your fantastic effort. I rate your site as the best climate-related in known Internet. There are some problems with some arguments in Polish - the short explanation is fine, but then the link leads into some non-existent page. It would look much better if the dummy page with "Not translated yet" or something similar would be present instead. Thank you for this site.Response: Thanks for pointing this out, the error has been fixed. Those pages had been translated, it was just a glitch with the URL addressing. -
Chris G at 01:52 AM on 31 March 2010Greenland's ice mass loss has spread to the northwest
Also Lou (#17), what I've read on the PIG leans towards the collapse becoming more of a prolonged calving event rather than an abrupt, tsunami-inducing slip. That makes sense to me since the underlying topography slopes upward toward the sea, up to the outlet, which is the current grounding line. It would be similar in nature, though larger, than what is happening with the Columbia glacier. RealClimate post Articles: http://www.sciencemag.org/cgi/content/abstract/291/5505/862 http://tintin.colorado.edu/.../MeierPost_FastTidewaterGl_JGR_1987.pdf -
Tom Dayton at 01:44 AM on 31 March 2010The human fingerprint in global warming
Martin Hedberg, there is a relevant post on RealClimate, about a new paper describing how fast CO2 levels would drop if human emission suddenly went to zero: Climate Change Commitments. And I think you're right that more conversation on this topic should happen over at the thread Airborne fraction of CO2. Other folks will notice your comments and follow you there. -
Ned at 01:22 AM on 31 March 2010Greenland's ice mass loss has spread to the northwest
Nope, the PIG isn't that big, though PIG is huge for a glacier. The entire drainage area for PIG is about 10% of the West Antarctic Ice Sheet, so even if all of that ice went into the ocean it would be less than 1 m SLR. Either Lovelock was being misquoted or his imagination was running away with him. -
johnd at 01:04 AM on 31 March 2010The human fingerprint in global warming
re GFW at 15:56 PM on 30 March, with regards to your comment about gases in bulk, warm gases rising etc, all CO2 produced by burning fossil fuels leaves the combustion at an elevated temperature. I expect that it then both rises and begins dissipating heat energy until it acquires equilibrium with the surrounding air. At what point would the now cooled CO2 begin re-absorbing IR radiation, and if it was to re-radiate it downwards to the surface, where has the surface heat dissipated to that allows a temperature differential to develop between the warmer CO2 and the cooler surface. If the surface was able to cool sufficiently to create such differential by dissipating it's heat energy upwards, why then was the CO2 not also dissipating it's heat energy in the same direction and at the same rate as the surface? In fact should not gases such as CO2 reach equilibrium faster than the surface? -
Lou Grinzo at 00:00 AM on 31 March 2010Greenland's ice mass loss has spread to the northwest
One thing that caught my eye just a few minutes ago was this snippet from an interview with James Lovelock, talking about what it would take to make us take action on climate change: ------------------------------ There has been a lot of speculation that a very large glacier [Pine Island glacier] in Antarctica is unstable. If there's much more melting, it may break off and slip into the ocean. It would be enough to produce an immediate sea-level rise of two metres, something huge, and tsunamis. ------------------------------ Two meters? Is the PIG really that big? This is the first time I've seen someone provide a number for such an event. Even assuming a fairly large fudge factor, 2 meters of "immediate" SLR is an astounding number. Source for the above quote: http://www.guardian.co.uk/environment/blog/2010/mar/29/james-lovelock -
mspelto at 23:31 PM on 30 March 2010Greenland's ice mass loss has spread to the northwest
The spread of the mass loss to the northwest over this time period represents the shifting of the maximum ice melt anomalies from southern Greenland beginning in 2002-2007 Tedesco et al., 2008 . Whereas northern Greenland began a series of substantial melt anomalies in 2005, with 2008 being the record. Box et al. 2009 This has had implications for the Petermann Glacier in northern Greenland which has the longest floating glacier tongue in the Northern Hemisphere. Petermann Glacier Retreat -
Ned at 23:16 PM on 30 March 2010Greenland's ice mass loss has spread to the northwest
To clarify my comment above, over the past decade the rate of ice loss from Greenland accelerated by about 11% per year. This is highly unlikely to continue (there would be no ice left by ~2075 or so). If that acceleration dropped to 3% per year tomorrow and continued for the rest of the century, you'd end up with 0.3 to 0.4 m SLR from Greenland, 1.0 m SLR total. Greenland would still have 93% of its ice. The ablation rate in 2100 would be around 4000 GT/year, compared to 286 GT/year in 2009. That's still a big increase in ablation over the next 90 years, but much more reasonable than Berényi Péter's calculations above. -
Ned at 22:22 PM on 30 March 2010Greenland's ice mass loss has spread to the northwest
Argus writes: Also, (Wikipedia) mean annual temperatures on the ice sheet domes are -31°C (on the north-central part of the north dome), and -20°C (at the crest of the south dome). How is ice going to melt with those kind of temperatures? Ice melts below the equilibrium line, and ice is discharged into the sea by marine terminating glaciers. Ice in the center of the sheet then flows outward. -
Ned at 22:18 PM on 30 March 2010Greenland's ice mass loss has spread to the northwest
Berényi Péter , you need to read more carefully. John Cook wrote Various independent studies predict global sea level rise of around 1 to 2 metres by 2100, with Greenland being a significant contributor (Vermeer 2009, Pfeffer 2008). That does not mean that Greenland's contribution alone would be 1-2 m of SLR. Read the two papers that John linked. Pfeffer et al. 2008 derive total SLR of 0.8 to 2.0 m by 2100, with 0.2 to 0.5 m of that coming from Greenland and the remainder from Antarctica, other glaciers & ice caps, and thermal expansion. Vermeer and Rahmstorf 2009 give a range of 0.8 to 1.8 m by 2100, again including a mix of contributions from all the above sources. From the Velicogna paper that BP cites, ice mass lost from Greenland in 2007-2009 averaged 286 Gt/yr. The 21st century average would only have to be a factor of about 4-5 greater than this to yield +0.3 m SLR from Greenland and +1 m SLR total. Considering that the rate of loss of mass from Greenland doubled over the 2002-2009 period, this doesn't seem especially farfetched. -
Argus at 21:21 PM on 30 March 2010Greenland's ice mass loss has spread to the northwest
# Berényi Péter, Thank you for giving us the correct numbers, and a more realistic view on the Greenland ice, than the ones coming from makers of the usual panic reports! In Wikipedia (''Greenland ice sheet'') I just read that 'the warmest decades were the 1930s and 1940s'. Not now. Why was nobody alarmed 70 years ago? Also, (Wikipedia) mean annual temperatures on the ice sheet domes are -31°C (on the north-central part of the north dome), and -20°C (at the crest of the south dome). How is ice going to melt with those kind of temperatures? -
fydijkstra at 21:18 PM on 30 March 2010Greenland's ice mass loss has spread to the northwest
There is no reason to extrapolate the current Greenland ice loss for many decades into the future. The current ice loss has only little to do with general global warming. Persistent patterns of wind have caused an abnormal warming in the Arctic region. That pattern can change again, and probably will, as it has often done. That would reverse the current alarmist predictions. -
Ned at 20:38 PM on 30 March 2010The 5 characteristics of scientific denialism
Earlier in this thread (e.g., here) I mentioned that several people have managed to do independent replications of the global mean surface temperature analysis using GHCN stations (i.e., replicate the results of GISSTEMP, HADCRU, etc.) Zeke Hausfather has helpfully compiled links to five of these analyses and has done some comparisons. Here is the 1880-present global land temperature trend in all the studies except those from Tamino and Clear Climate Code (the CCC one is so close to GISSTEMP that the two are more or less indistinguishable): Zeke also computed linear trends over various time intervals. Over the last three decades GISSTEMP has the lowest trend, NCDC has the highest trend, and all the "independent blog studies" show trends in the middle of the range.
-
Riccardo at 20:31 PM on 30 March 2010Greenland's ice mass loss has spread to the northwest
Arjan, unfortunately no one still came out with a reliable ice sheet dynamics model. The IPCC AR4 did not include the ice sheet melting contribution to sea level rise because a reliable prediction was not possible. From then, scientists made a few step forward, but more than this it is the new data that rise concern. Although still not conclusive for accurate projections, the new data show acceleration of melting in Greenland, in West Antarctica and possibly even in East Antarctica. And we know from paleo reconstructions that rates of the order of meters per century are indeed possible. Although no one can say conclusively that the current acceleration trend will continue, all the signs point in this direction. As for The Netherlands, already in 2008 your Delta Commitee projected 0.65-1.3 meters by 2100. They included the caveat of the unknown response of Greenland and Antarctica ice sheets and concludes "that this level may be higher than has been assumed up till now.". But, according to the Delta Committee, the impact will vary in different part of the coast. The engineer point of view is not general and needs an expert and specific advice. -
Ned at 20:14 PM on 30 March 2010A peer-reviewed response to McLean's El Nino paper
Philippe Chantreau writes: Jonicol, you complain, unjustifiably, about people not using their real names, yet don't reveal yours? Actually, at the end of his first comment here he does sign it "John Nicol PhD (Physics)." -
Berényi Péter at 20:09 PM on 30 March 2010Greenland's ice mass loss has spread to the northwest
#4 Arjen at 14:10 PM on 30 March, 2010 "Response: [...] "an estimated sea level rise of 1 to 2 metres by 2100" Get real. Current mass of Greenland ice sheet is somewhere around 2.4 × 10¹⁸ kg. Average loss between April 2002 and February 2009 is estimated to be 2 × 10¹⁴ kg/year. That is 0.0083%. On the other hand, global ocean surface area is some 3.6 × 10¹⁴ m2. A one meter increase by Greenland ice melt would require 3.6 × 10¹⁷ kg, which is 15% of the entire ice sheet mass. If that much ice is supposed to melt in nine decades and acceleration of melting is uniform, in the final year (2100) the annual melt should be 1.2 × 10¹⁶ kg, sixty times more than the 2002-2009 average. The bulk temperature of Greenland ice sheet is around -30 °C. To warm it up to 0 °C and melt requires about 4 × 10⁵ J kg-1. So to melt that much ice in a single year takes 4.8 × 10²¹ J, that is 1.5 × 10¹⁴ W. As the surface area of the ice sheet is 2 × 10¹² m2, the average heat flux required is 75 W m-2. That's much. The average annual insolation at TOA (Top of Atmosphere) over Greenland is 193 W m-2, most of it reflected back to space by clouds and the ice surface itself. And even at -30 °C, outgoing heat radiation of ice surface is 198 W m-2 (it is 315 W m-2 at 0 °C).Response: As discussed in the article above, the predominant contributor to sea level rise from the Greenland ice sheet is not ice melt but speeding up of the glaciers, dumping more ice into the ocean.
The source for sea level rise of 1 to 2 metres by 2100 are two peer-reviewed papers, Vermeer 2009 and Pfeffer 2008. These papers use two independent methods to come to the same answer. Pfeffer in particular looks at the physics of glacier discharge and finds accelerating discharge of glaciers into the ocean the main reason why sea level rise is so large.
Accelerating glacier discharge has already been observed by radar interferometric surveys. This is corroborated by GPS observations in Khan 2010. -
Martin Hedberg at 19:54 PM on 30 March 2010The human fingerprint in global warming
@56 GFW So first year you inject x Gt: 0,5x will be dissolved Second year you inject 2x Gt: x will be dissolved, Third year you inject 3x Gt: 1,5x will be dissolved... (so far I agree to what has happened) But then I say: If you the fourth year inject 6x Gt: Around 2x will be dissolved, not 3x. Or if you the fourth year inject 0x Gt: Still around 2x will be dissolved (not 0x). The ocean does not know how much we emitted to the air, nor does it dissolve a certain amount direct connected to our emissions. The solubility of CO2 in oceans is a function of the concentration of CO2 in the air (and temperature etc), not primarily related to the human emission itself. (Yes I know our emission affects the concentration in the atmosphere, but so does phenomena like forest fires, emissions from soil, ocean etc. None of them are constant.) Nature itself emits huge quantities of CO2. And the net sum absorbed (in Gt) by ocean, biosphere etc is just slightly larger than what is emitted by ocean, soil, biosphere etc. The difference between these large numbers (about 216 and 212 Gt C (i.e. 4 Gt C) is the net carbon absorbed. It happens to be about 50% of our emissions (total human fossil emission was about 8 Gt of carbon in the 1990s). Check out IPCC AR4WG1 ch 7.3.1.2 IPCC AR4WG1 ch 7.3.1.1 and 2 . If we double our emissions, the concentration in the air does not double. If we cut our emissions by 100% (no emissions), the oceans would still absorb about the same amount (in Giga tons, not %) as it did last year. It is tempting to see our emissions with some decay rate, like radioactive decay. But it is not. We add carbon to the cycle. The absorption of carbon in the ocean is a function of the carbon cycle, not the human emissions. In an non-changing environment its solubility in oceans could behave like a decay rate, but it still is not. And as the climate, ecosystem, ocean temperature etc change, it is highly unlikely that the airborne fraction (about 43%) of anthropogenic CO2 would stay constant. If humanity wanted to decrease the concentration of CO2 in the atmosphere, we would have to decrease the emissions by more than approximately 43%. Hence more CO2 would be dissolved/absorbed by ocean and biosphere than we and nature emit to the atmosphere. If we cut our emissions by 50%, the airborne fraction would be -14% (-7 of the 50%-units emitted) for the first years (until carbon cycle changed). Or put it another way: Humans + nature would emit less to atmosphere than nature extracts from the atmosphere. But we have to do this well before there was a risk that CO2 solubility in oceans changes, for example due to the rising temperature in the ocean. (or methane outburst, or albedo changes, or... changes) And then we have ocean acidification... Is it a good or a bad thing (from humanities point o view) that CO2 is dissolved in the oceans? It gave us time, but we used the time to build up potentially larger problems. Maybe this conversation should have been at the blog post: Airborne fraction of CO2 here at Sceptical science. Sincerely, /Martin -
aj1983 at 19:00 PM on 30 March 2010Greenland's ice mass loss has spread to the northwest
These are worrying signs, especially if you live in the Netherlands... However, I do wonder if this (acceleration) will be a continuing trend, or that it has been caused by weather or one of the many oscillations (which I hope, but wouldn't count on it). The measurement time series are still rather short. I find it somewhat surprising that these great ice masses have such a rapid response on climate, because usually such large bodies of ice have considerable inertia (e.g. the Antarctic ice sheet is still responding to the current Holocene (?)). I'm not sure though, and I should maybe talk about this with some of the experts at our research institute (IMAU). -
Sordnay at 18:06 PM on 30 March 2010Accelerating ice loss from Antarctica and Greenland
John, Are your two first figures melted ice mass overland? (I guess not) If not, I would like to know the ratio, so we could maybe transform that into sea level rise. And what percentage of mass is that anyway? Gigatons make it very difficult to acknowledge the magnitude of what we are talking about.Response: As far as I know, most or all of the Greenland ice sheet is over land. Some of the West Antarctic ice sheet is over water - I can't tell you off the top of my head how much or what percentage of mass is falling. Please feel free to investigate the figures and report back to let us know what you uncover :-) -
Stuart at 18:00 PM on 30 March 2010The human fingerprint in global warming
@johnd #62: Yes, there is a constant movement of CO2 towards the surface. In fact there's a constant movement of every gas in the atmosphere in every direction. That's the nature of gases. CO2 collides with other molecules and distributes the heat rather quickly, so it doesn't warm beyond the surrounding atmosphere itself. And water isn't the best analogy here, since carbon dioxide doesn't precipitate down to the surface like water does. -
Jeff Freymueller at 16:44 PM on 30 March 2010Greenland's ice mass loss has spread to the northwest
Well done again, John. I came across this paper over the weekend and thought of alerting you to it, but got involved in other things. Readers might be interested to know that over the last 3 summers, an extensive GPS network has been established all over Greenland, the new GNET GPS network. Quite a few new sites have been built in Antarctica as well. Over the next few years, the change in ice mass will be weighed very effectively by GPS. -
Tom Dayton at 16:43 PM on 30 March 2010Climategate CRU emails suggest conspiracy
kblood, the raw data were not lost by the organizations that are actually responsible for collecting and keeping them. The U. of East Anglia was only one of many consumers of those data. The data still are available to the U. of East Anglia, and even to, say, you! A big list of links to the data sources has been compiled at RealClimate, for your convenience. -
Jeff Freymueller at 16:30 PM on 30 March 2010Greenland's ice mass loss has spread to the northwest
#5 Arjen, you might want to check out this post at RealClimate by Stefan Rahmstorf, which involves one way to extrapolate accelerating sea level rise. Your idea to extrapolate is interesting, but I agree with John that it is dangerous to extrapolate too far. Nevertheless, here it is, based on Velicogna (2009). After 30 years, the rate of sea level rise would be faster than the present by 5.1 ± 1.5 mm/yr if the present acceleration in mass loss from Greenland and Antarctica continues. If we take the present rate of sea level rise as 3 mm/yr (approx altimetry rate), then after 30 years the total rise would be 16.5 cm instead of 9 cm (linear extrapolation). If you are even more bold and extrapolate out to 100 years, you would get 1.15 meters of sea level rise. Take that with a very large grain of (sea) salt, but that number lies within the range of what Vermeer and Rahmstorf (2009) and others have gotten from fitting an empirical relationship between past temperature and past sea level. Here are the conclusions from Velicogna (2009): "We showed that a detailed analysis of the GRACE time series over the time period 2002–2009 unambiguously reveals an increase in mass loss from both ice sheets. The combined contribution of Greenland and Antarctica to global sea level rise is accelerating at a rate of 56 ± 17 Gt/yr2 during April 2002–February 2009, which corresponds to an equivalent acceleration in sea level rise of 0.17 ± 0.05 mm/yr2 during this time. This large acceleration explains a large share of the different GRACE estimates of ice sheet mass loss published in recent years. It also illustrates that the two ice sheets play an important role in the total contribution to sea level at present, and that contribution is continuously and rapidly growing." -
GFW at 15:56 PM on 30 March 2010The human fingerprint in global warming
@62 johnd. There is ongoing flow in and out of the atmosphere at the same time. Plants take up CO2, animals and decomposition release it. Prior to the industrial revolution you would have found each of the flow pairs air<->sea and air<->plants/animals/ground to be in near perfect balance. In the modern world there's a net flow from burning fossil fuels into the air, and a net flow about half that from the air into the ocean. Therefore you will find a *slight* average gradient with higher concentrations over land and lower concentrations over water. (And of course higher gradients very close to point sources like smokestacks.) Nonetheless, the term "well mixed" is still accurate. On your last point, while it's true that hot air rises and cool air sinks, that applies to gases in bulk, not so much individual molecules. When an IR absorbing molecule absorbs a photon from the ground, it either re-radiates it (randomly in any direction, thus half "down") fairly quickly, or it transfers energy to the other molecules (mostly N2 and O2) around it through thermal motion. So all the air warms up, not just the CO2 ... so the atmosphere remains well mixed, not separating out by molecular type. -
kblood at 15:33 PM on 30 March 2010Climategate CRU emails suggest conspiracy
One thing is how it seems these emails mentions intentions to make graphs fit the claims of Co2 and global warming, another thing is to loose the raw data? Woops, that was unfortunate. Which basically takes just about all the evidence on this website, and invalidates it. Seems it is back to the drawing board. At the moment, too much of the world do not accept the lack of raw data, and the whole thing is being looked looked into. -
johnd at 15:23 PM on 30 March 2010The human fingerprint in global warming
By saying not well mixed I mean that there must be either a constant movement of CO2 towards the surface to replace the CO2 stripped from the atmosphere, or else it tends to congregate closer to the the surface. If CO2 is such an efficient absorber of IR radiation should it not have a tendency to rise away from the surface rather than gravitate towards it. Water vapour only returns to the surface once it has dissipated heat previously absorbed. Does CO2 function differently? -
yocta at 15:19 PM on 30 March 2010The human fingerprint in global warming
RE: johnd #57 Play around with this java animation of particles in two different boxes to see what is meant by gases mixing. At room temperature a single gas molecule undergoes approximately 10 to the power of 10 collisions per second so the diffusion of the gases happens very quickly. Whilst the atmosphere is not a simple box and there are more forces at play this helps us understand what is going on. Definitely watch the other animations on John's page that Tom Dayton linked to. -
Arjen at 15:03 PM on 30 March 2010Greenland's ice mass loss has spread to the northwest
I understand that you are wary of the extrapolation. I am too, that is why I "only" limited it to 30 years, which is stretching it, even in my standards. I will not discredit any paper, simply because I do have not the necessary background to do so in any constructive sense. I do however doubt the overall accuracy of the predicted sea level rise, because in so far I was able to follow it, it has mostly been on the conservative side. Since the current ice loss in in both the Arctic and Antarctic is going faster than almost all of the projections, that would lead to the conclusion that maybe our long term prediction might be off as well. An other factor is, in so far as I have read and am aware of, is that our current understanding of ice sheet dynamics and glacier flows is not that well know as we would like and problematic in some aspects. Coupling that to the astonishing rate that the glaciers are retreating and that some mayor glaciers might not be so protected or constrained as we thought they were, to me gives enough reason to do a re-evaluation of current projections or at least do a major worst case scenario exercise. -
Philippe Chantreau at 14:23 PM on 30 March 2010A peer-reviewed response to McLean's El Nino paper
I missed the previous reference to Lewandowsky, so I did not realize that my previous comment did not introduce anything new, except a link to his piece. It's every bit as worthy of reading as McLean's complaining. Jonicol, you complain, unjustifiably, about people not using their real names, yet don't reveal yours? -
Philippe Chantreau at 14:16 PM on 30 March 2010A peer-reviewed response to McLean's El Nino paper
Nobody disputes that ENSO has a major influence on global temps variations. McLean et al can not use their analysis to even remotely suggest that it can explain any trend since their analysis in essence removes the trend. That's all there is to it. The tiny, sleazy "perhaps" in the conclusion would have been enough to reject the paper. As far as the right to respond, the buck stops when the bulls**t becomes too glaringly obvious. Science journals do not have to endure that kind of nonsense. Here is an Australian's take on this all McLean fiasco: http://www.abc.net.au/unleashed/stories/s2858332.htm He describes the all thing very well. -
Arjen at 14:10 PM on 30 March 2010Greenland's ice mass loss has spread to the northwest
If you extrapolate the current ice loss trends from the Arctic and Antarctic for about 30 years, which are accelerating, what kind of sea level rise would that generate and how would that compare to the current maximum projections for 2040? I have a nagging feeling that they might be above the current maximum predictions that would lead to a 2 meter sea level rise. Other questions, what would constitute a collapse of one of the ice sheets? And do you think there is a failing mechanism for an ice sheet that would lead to collapse? If so, what kind of thing are we looking for. Because of my job in coastal engineering, I'm very interested in sea level rise. Even a one meter rise would lead to a mind boggling amount of problems to current coastal structures. Let alone if we are confronted with a 2 or more meter rise.Response: "If you extrapolate the current ice loss trends from the Arctic and Antarctic for about 30 years, which are accelerating, what kind of sea level rise would that generate and how would that compare to the current maximum projections for 2040?"
I'm wary of statistical extrapolations of the current accelerating trend of ice mass loss. The reason is there are physical constraints on how fast the glaciers can move so one imagines (hopes) eventually the rate of ice mass loss might stabilise. Note - that's the rate of ice mass loss that might level out - I'm not saying mass balance will stabilise. Therefore papers like Pfeffer 2008 are useful in that they look at the physical constraints of Greenland's glaciers, leading to an estimated sea level rise of 1 to 2 metres by 2100. -
Tom Dayton at 14:09 PM on 30 March 2010The human fingerprint in global warming
johnd, in addition to the excellent links yocta gave you, see "CO2 Measurements are Suspect". -
muoncounter at 14:04 PM on 30 March 2010Greenland's ice mass loss has spread to the northwest
Nicely written. Yet another integration of independent data sources pointing to the same thing. GPS, gravity and altimetry would be enough to convince a literate person that the northern hemisphere is in deep trouble -- and that's without using any of the so-called controversial temperature data! (Of course, temperatures also say the same thing). And here's another connection from a recent study of caves in the southwestern US. "Both research teams found that climate in the Southwest oscillated rapidly between wet and dry as the North Atlantic cooled and warmed between 50,000 and 10,000 years ago. Their findings reinforce computer model predictions of similarly abrupt climate change during the coming century, as emissions of greenhouse gases, such as carbon dioxide, heat the atmosphere." -
Philippe Chantreau at 14:04 PM on 30 March 2010Is the science settled?
Shawnet, I'm wondering what your point is too. O large scales, RH tends to remain within certain limits, so, averaged over a global scale, you can not cram more WV in the air than what it will take at a certain temp. Whatever is on top of that will soon rain out. In addition, for your assumption (more water condensing) to materialize, it is necessary for the air to cool below its dew point. Perhaps that will tend to happen as much, or more, or less. Even if it is more watedr condensing than a at lower temps, all it means is a better chance for droplets to become heavy and rain down (less residence time for the clouds to reflect sunlight), and also more latent heat release from condensation. The energy does not go away. That points to possible more frequent heavy precipitation/violent weather but other than that, what? Wild speculation used as a stepping stone to grasp at straws, in order to demonstrate, what exactly? -
Tom Dayton at 14:03 PM on 30 March 2010The human fingerprint in global warming
johnd, the well-mixed state of CO2 is an observed, empirical, fact. Not theory. Not based on "computer models." -
Stuart at 13:59 PM on 30 March 2010The human fingerprint in global warming
@johnd #57: I find it difficult to understand exactly what you're saying here. You say you find it difficult to accept that CO2 is well mixed in the atmosphere, but go on to give a rather convincing argument that it is well mixed in the atmosphere. The very concepts of temperature and pressure in gases are closely tied to their constant motion around the atmosphere. Through this constant motion, if you release a certain volume of gas in an enclosed space, it will quickly diffuse through the whole space and end up well mixed with whatever gas was there to begin with. If you add or subtract CO2 at the earth's surface, it quickly mixes with the entire atmosphere by much the same process. -
johnd at 13:40 PM on 30 March 2010The human fingerprint in global warming
re yocta at 11:33 AM on 30 March, 2010, I find it difficult to accept that CO2 is well mixed in the atmosphere. Given the amount that is sequestered by plants and animals, or absorbed by the oceans, there must be some mechanism that causes CO2 to be driven to the surface where it is stripped from the atmosphere. Given plants are closer to CO2 deprivation rather than being able to access their optimum amount of CO2 they must be stripping CO2 as it becomes available. So is it just air movement that causes it to be replenished, or is there some other force that causes CO2 to naturally gravitate to the surface. Every molecule of carbon locked up as fossil fuels only got there by descending to the surface whatever the reason they were in the atmosphere in the first place. -
Andy Skuce at 13:02 PM on 30 March 2010Greenland's ice mass loss has spread to the northwest
So, it seems the bedrock in coastal Greenland is isostatically rebounding faster than global sea level is rising. Based on recent headlines in the popular misrepresenting climate science, can we expect to see this reported as; "Relative sea level falling at an accelerating rate in Greenland due to climate change"? You read it here first ;) -
michael sweet at 12:51 PM on 30 March 2010Greenland's ice mass loss has spread to the northwest
Good post. It is interesting to see these rapid changes in the ice sheet. What will this look like when it is all linked together in the next IPCC report? Last paragraph typo: pointing painting (delete pointing)Response: "What will this look like when it is all linked together in the next IPCC report?"
We'll have to wait till 2013 to find out.
Thanks for the typo alert. -
GFW at 12:51 PM on 30 March 2010The human fingerprint in global warming
@52 Martin. Well, your English is infinitely superior to my Swedish. I agree with you that we've added carbon to the "fast" reservoirs - the air, the (non-deep) ocean, plants, animals, and the soil. However through agriculture we basically control the latter three, so *almost* all the carbon we've emitted adds to the air and the ocean. (We *could* have stored more in plants if not for rainforest destruction, the pine beetle, etc.) I also agree that we've probably sped up some of the carbon cycle flows. The argument for a constant fraction going into the ocean is like this: If I take a sealed container containing salt water and an oxygen-nitrogen atmosphere, and then I inject x amount of CO2, an equilibrium will be reached with some fraction of the CO2 dissolved in the water and the rest in the air. Holding temperature constant, if I inject another x (for a total of 2x) CO2, the equilibrium will divide the CO2 into the same fractions as before: there will be twice as much in each reservoir. On our planet, there are (at least) two major changes from my little thought-laboratory. Carbon can slowly rain out to the ocean floor in the form of dead organisms, and the temperature is not constant. I would suggest that the rain-out rate is too slow to be apparent on human timescales, and that we haven't *yet* increased the temperature of the ocean enough to significantly decrease the solubility of CO2. Thus, as long as those approximations hold, the "airborne fraction" will remain constant. No, there's no particular reason for the airborne fraction to be close to 50%. It just happens that it is. If we had a dryer planet with smaller oceans, the airborne fraction would be higher (but still constant as long as the above approximations hold). -
yocta at 11:35 AM on 30 March 2010The human fingerprint in global warming
Oops my post is slightly pear shaped. I meant peer reviewed -
yocta at 11:33 AM on 30 March 2010The human fingerprint in global warming
RE# Tarcísio #48 You said:As the CO2 from the combustion, it is logical that he, for his temperature, to go position in the upper layers of the atmosphere. What I think you are referring to is how well mixed the CO2 is in the atmosphere. Alexandre is correct saying that the CO2 is well mixed. I suggest you read John's post here as this discusses further what you are referring to. As an example of pear reviewed research into this areaChahine et al 2008 has a study tracing to trace the sources and sinks of CO2 and if I quote from their conclusion: We have shown that CO2 emissions by surface sources can be observed in the mid-troposphere and how they are transported around the globe. You can also watch a NASA animation here of CO2 concentrations varying on the order of 20ppm in the mid-tropospheric. This visualization shows how it really doesn't matter where the CO2 came from, given enough time. To better quantify the movement of CO2 through these various sinks and sources the Japanese have a satellite called GOBI in orbit right now.
Prev 2423 2424 2425 2426 2427 2428 2429 2430 2431 2432 2433 2434 2435 2436 2437 2438 Next


