


 Arguments


Recent Comments
Prev 2430 2431 2432 2433 2434 2435 2436 2437 2438 2439 2440 2441 2442 2443 2444 2445 Next
Comments 121851 to 121900:
-
Ned at 20:42 PM on 24 March 2010Mars is warming
Actually Sagan, temp measures on other planets could be considered more reliable than some I've seen taken on earth. On Earth we have buoys, drifters, and satellites measuring the temperature of the oceans; met stations and satellites measuring the temperature of the land surface; boreholes measuring temperatures beneath the surface; and satellites and balloons measuring temperatures in the atmosphere. That's orders of magnitude more information than we have about temperatures on any other planet. -
HumanityRules at 19:30 PM on 24 March 2010Skeptical Science housekeeping: Contradictions, URLs and getting hacked
Thanks Leo That seems to nail that particular discussion. More evidnce that the simplistic denier/warmer split is of limited use. -
warm at 19:03 PM on 24 March 2010What CO2 level would cause the Greenland ice sheet to collapse?
"This reminds me of an story I heard recently - I don't recall the exact details (a google challenge for the curious) but there was some European glacier that was threatening some village several centuries ago. The villagers went to the Pope asking him to pray that the glacier would retreat. Recently villagers from the same region went to the Pope, asking him to pray for the same glacier which has nearly disappeared." [Sorry, I do not speak english very well] The story you tell about concerns the largest glacier in western europa, the Aletsch glacier in Switzerland. Here is the news in french I know well the story, because I live in this area of Switzerland. Retreating glacier is a realty that every people living in the alps experience.Response: Thanks for the link (I was hoping someone would post some more info). It's a great story - the villagers of Fiesch swore to live a virtuous life and prayed against the growth of the Aletsch Glacier. To enhance the effect of prayer, they've held an annual procession every year since 1862. Now that the glacier is melting, the people are trying to get a meeting with the Pope to request he cancel the Papal oath. You can't make this stuff up.
I'm now waiting for a new skeptic argument: "global warming was caused by the Pope". -
NicklasE at 18:27 PM on 24 March 2010What CO2 level would cause the Greenland ice sheet to collapse?
There are a few things missing in this blog that upsets me: 1) Figure 1. It's a nice graph but how does this graph relate to the total mass of the ice sheet? 2) Your claim is that CO2 is driving the slope of figure 1, but you don't compare with any estimates of how that figure would look like if we did not add any extra CO2 into the atmosphere from burning fossil fuels. My guess is that the figure 1 would look virtually the same. 3) With the current rate of mass reduction of the ice sheet it will take x years for everything to melt. You claim that we will reach a tipping point causing a drastic reduction of x. Do you have any example or good explanation to this claim making it plausible?Response: "It's a nice graph but how does this graph relate to the total mass of the ice sheet?"
Figure 1 is the change in total mass of the Greenland ice sheet. This is measured by satellites which measure the change in the gravity field around Greenland (Velicogna 2009).
"you don't compare with any estimates of how that figure would look like if we did not add any extra CO2 into the atmosphere"
If we hadn't added any extra CO2 into the atmosphere, we would have experienced a slight, long-term cooling trend over the last half century (Meehl 2004). It's difficult to see how Greenland could lose ice mass at an accelerating rate if global temperatures were cooling.
"Do you have any example or good explanation to this claim making it plausible?"
A good example of the high sensitivity of ice sheets to warmer temperatures is the behaviour of ice sheets 125,000 years ago. At this time, temperatures were 1 to 2°C warmer than current conditions. Sea levels were at least 6.6 metres higher than current values. This is strong evidence that ice sheets are sensitive to sustained warmer temperatures (Kopp 2009).
How does it happen? The Greenland and West Antarctic ice sheets sit on bedrock that is underwater. As the oceans warm, they melt the ice sheets from below - this causes the ice sheets to slide faster into the ocean (van den Broeke et al 2009). This is what is being observed now by satellites.
It's not fantasy, it's not alarmism, it's peer-reviewed science based on multiple lines of empirical observations. -
HumanityRules at 18:11 PM on 24 March 2010A peer-reviewed response to McLean's El Nino paper
Here is Mclean et als reply to the Foster comment. Warning: this is not peer-reviewed (this becomes obvious very quickly). It also contains reference to the climategate emails which I know some people are a little sensitive about. http://icecap.us/index.php/go/joes-blog http://icecap.us/images/uploads/McLeanetalSPPIpaper2Z-March24.pdf -
David Horton at 17:37 PM on 24 March 2010What CO2 level would cause the Greenland ice sheet to collapse?
Well, this is a new one on me. What Mr Camel is saying is that all us evil greenies who want to reduce CO2 are dooming the poor peasants of Switzerland to having glaciers advance down the valleys and ruin their farms (unless, of course, the present pope could stop it, rather like King Canute with liquid ice). So we should all shut up and applaud the increase in CO2. I guess it's a variant on "They call CO2 a pollutant, we call it plant food" nonsense - "They call CO2 a pollutant, we call it a glacier killer". Still, it has served up a bit of amusement on a Wednesday afternoon. -
Philippe Chantreau at 15:19 PM on 24 March 2010Skeptical Science housekeeping: Contradictions, URLs and getting hacked
Svalgaard is by no means a denialist. I don't know how active he has been regarding publications lately but I am pretty sure that he would not submit low quality stuff and I'm quite sure you won't see his work in E&E. I don't think he's even that interested in climate science itself. -
acerj at 15:19 PM on 24 March 2010Mars is warming
Actually Sagan, temp measures on other planets could be considered more reliable than some I've seen taken on earth. You are showing an obvious bias. If we are concerned with finding the truth why not look at other planets. -
gallopingcamel at 15:08 PM on 24 March 2010What CO2 level would cause the Greenland ice sheet to collapse?
David Horton (#35), Scott Mandia is committed to the AGW cause but he does not try to deny history. I am quite a fan of his although I seldom agree with him on mankind's role in what is going on with climate. Expanding glaciers during the "Little Ice Age" caused all kinds of problems. In Switzerland they kept very good records so we know that farmers were having difficulty paying their taxes and that wheat prices seem to be a plausible proxy for average temperatures (Herschel). Take a look at the following link before you start rooting for bigger and better glaciers: http://www2.sunysuffolk.edu/mandias/lia/little_ice_age.htmlResponse: This reminds me of an story I heard recently - I don't recall the exact details (a google challenge for the curious) but there was some European glacier that was threatening some village several centuries ago. The villagers went to the Pope asking him to pray that the glacier would retreat. Recently villagers from the same region went to the Pope, asking him to pray for the same glacier which has nearly disappeared.
Just an amusing anecdote. More seriously, noone is wishing for glaciers to grow and take over the regions that we inhabit. There is no danger of that happening. But what is of serious concern is that the glaciers that seasonally melt and provide summer drinking water are retreating at an accelerating rate. This threatens the water supplies of hundreds of millions of people. Well, hundreds of millions of people now. By the time the glaciers have disappeared, I imagine it will be significantly more people that are affected. -
David Horton at 14:43 PM on 24 March 2010What CO2 level would cause the Greenland ice sheet to collapse?
"What is wrong with shrinking glaciers?" as well as the practical impact on water supplies there is the canary in the coal mine aspect. Mr Camel and his like constantly complain about the use of models in climate research, but with the glaciers shrinking so rapidly in recent times we have another example of the reality of warming climates. Mr Camel is really asking two questions in one of course. First is the "this is perfectly natural" meme, and second is the "what is the ideal temperature" meme. We've heard them a thousand times, and asking them in a slightly different way doesn't fool anyone. But how on Earth these people get their head around the concept that all these rapid changes to the Earth's biosphere exactly correspond to the rapidly rising CO2 levels and temperatures of the last few decades, and yet, it seems, are just purely coincidental ("glaciers could shrink or grow any old time, they just happen to have decided to shrink now, big deal") is beyond me. But I'm a simple soul. -
scaddenp at 13:52 PM on 24 March 2010What CO2 level would cause the Greenland ice sheet to collapse?
"What is wrong with shrinking glaciers?" Ideally we want glaciers melting at a rate that doesnt cause sealevel to rise faster than we can adapt. 3mm/yr isnt good. 10mm/year would be tough.Response: Just off the top of my head, the sea level rise due to melting glaciers (excluding the Greenland and Antarctic ice sheets) is somewhere between 60 to 80 cm. Which would be inconvenient but not disastrous. The real sea level rise comes from Greenland and Antarctica.
The more serious impact from disappearing glaciers is the eventual loss of a source of seasonal drinking water for hundreds of millions of people. -
gallopingcamel at 13:35 PM on 24 March 2010What CO2 level would cause the Greenland ice sheet to collapse?
Figure 3 at the top of this thread shows predictions for the CO2 concentration until 2100. The exponential rise assumed by the IPCC, Rahmstoorf and Hoffman is not the only plausible explanation for the observed concentrations. You folks don't have much time for Craig Loehle since Loehle & McCullough, 2008 but here he is again with an alternate view of things: http://www.ncasi.org/publications/Detail.aspx?id=3282 -
bill at 13:25 PM on 24 March 2010What CO2 level would cause the Greenland ice sheet to collapse?
Thanks for this great website. As a farmer I am constantly defending the science of AGW against the farmers I come across who think it all a just a normal climatic cycle/socialist plot(70% if you believe a recent survey in southern Australia). The common refrain from the people I speak to seems to be; "Scientists huh, what the **** would they know?!" This site gives me the ability to put the counter argument although I fear that I'm fighting a losing battle. My rainfall here has dropped off 20% in the past 15 years which may not in itself prove much but given everything else that's happening it certainly worries me. Keep up the great work! -
gallopingcamel at 13:09 PM on 24 March 2010What CO2 level would cause the Greenland ice sheet to collapse?
Ned, (#7&8), Do you want glaciers to start growing again as they did during the Little Ice Age? What is wrong with shrinking glaciers? You seem to be well aware that sea levels rose very rapidly at the start of the present Interglacial. With regard to meltwater pulses, Disney did a good job on a collapsing ice dam in "Ice Age". -
Ned at 11:15 AM on 24 March 2010The 5 characteristics of scientific denialism
Aha, yet another replication of Tamino's conclusion that the GHCN stations that dropped out before 1991 have a similar trend to those that did not drop out: # GHCN Processor v1.0 by Residual Analysis # Graph of the results It seems to nicely match the previous results from Tamino, Zeke Hausfather, and Ron Broberg. More to the point, Joseph seems to have come up with a really nifty and flexible program for doing these kinds of studies.Response: Thanks for the link, I've added it to the list of links on the 'Dropped stations introduce warming bias' argument (and while I've got everyones' attention, a quick exhortation to submit any useful links you might encounter so we can build a comprehensive resource of useful global warming links). -
Ned at 09:39 AM on 24 March 2010Human CO2 is a tiny % of CO2 emissions
Vinny Burgoo writes: Which gives a net annual increase of 25 Gt. That's nearly twice the number you quote in your 'What the science says...' section and five or six times times the number offered by the Mauna Loa observatory. (+2 ppm CO2 pa is about +4 gigatonnes CO2, no?) You might be making the same error that oracle2world made in the comment immediately preceding yours. According to CDIAC, "1 ppm by volume of atmosphere CO2 = 2.13 Gt C" But 1 GT C = 3.67 GT CO2. So +2 ppm a^-1 is about +15.6 GT CO2. -
Jesús Rosino at 08:34 AM on 24 March 2010What CO2 level would cause the Greenland ice sheet to collapse?
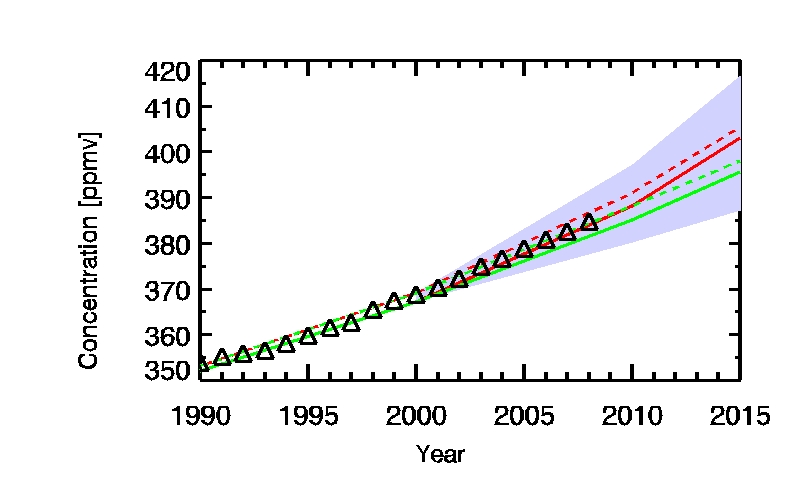
Thanks for your inline answer in #20, John. The trends in modelled and observed CO2 concentrations are truly close, almost indistinguishable. I link another graph from the IPCC: graph website -
Vinny Burgoo at 08:11 AM on 24 March 2010Human CO2 is a tiny % of CO2 emissions
I'm looking for a rough estimate of net human CO2 emissions as a percentage of net natural emissions. (I know. Meaningless. But I'm checking a claim by a respected climate scientist who thought it worthwhile to scare some NZ brewers with such an estimate. His was 10%.*) This page looked like a likely source but I can't get your numbers to behave. Please tell me what I'm doing wrong. Net(?) human emissions: 29 Gt Net natural emissions: (220+220+332)-(450+338-0.4x29) = -4 Gt Which gives a net annual increase of 25 Gt. That's nearly twice the number you quote in your 'What the science says...' section and five or six times times the number offered by the Mauna Loa observatory. (+2 ppm CO2 pa is about +4 gigatonnes CO2, no?) What's occurring? *Salinger actually wrote that 'Human inputs are about 10% of the natural cycle', which is gibberish. If he meant 'about 10% of natural inputs', he's clearly wrong. If he meant 'net human inputs are about 10% of net natural inputs'... That's what I'm trying to find out. Incidentally, in the same presentation he also claimed that 'Human energy use [is] nearly half of total solar input to Earth'. He was off by about four noughts with that one. Or is it three? Enough to get him sacked, anyway. I dunno Alarmists! -
muoncounter at 07:47 AM on 24 March 2010CO2 levels during the late Ordovician
Whoa! There needs to be a geologic timeout here. Way back at 50, Peter Hogarth mentioned "None of this work precludes other drivers (lesser or greater) for global temperature and climate, and in geological history as well as now, other factors must be taken into account (such as insolation, plate tectonics, etc)" It is vastly out of context to make any comparisons between the present and the distant geologic past without plate tectonics. The globe looked very different 450 million years ago: no land mass at the North Pole and a super-continent at the South Pole. That paleo-geography is a major control on oceanic circulation and thus on climate is well-established among geologists. See this discussion of the Ordovician of eastern North America for an example.
Some of the best evidence for Ordovician glaciation is in the present day Sahara and in South America; these areas were near the South Pole at the time.
That paleo-geography is a major control on oceanic circulation and thus on climate is well-established among geologists. See this discussion of the Ordovician of eastern North America for an example.
Some of the best evidence for Ordovician glaciation is in the present day Sahara and in South America; these areas were near the South Pole at the time.  See also this summary article on the Ordovician climate, concluding thus: "It therefore seems likely that it was geographical factors, rather than the chemical composition of the air, which played a key role in triggering that glacial period."
-
Alexandre at 07:27 AM on 24 March 2010What CO2 level would cause the Greenland ice sheet to collapse?
muoncounter, Thanks for the interesting study you linked. I was thinking of the fact that in the Pliocene warm period, Greenland was the only lend ice mass left. So if Greenland ice sheet is gone because of AGW, land ice will all be gone in the NH by then, probably. "Resilient" was probably a poor choice of words, I admit, since it implies the ability of returning to its original state. I see the paper you linked suggests otherwise. "The hardest land ice region to melt in the NH" would be more appropriate, maybe? -
shargash at 06:00 AM on 24 March 2010What CO2 level would cause the Greenland ice sheet to collapse?
Oops...sorry about repeating the points in CBDunkerson's post. I had mine all typed in (at work) and someone called me away from my desk right before I hit submit. By the time I came back and hit submit, CBDunkerson had scooped me. -
shargash at 05:58 AM on 24 March 2010What CO2 level would cause the Greenland ice sheet to collapse?
" The link below shows that the Greenland ice sheet was less extensive during the MWP" There is a bit of apples-to-oranges comparison involved in that. You are comparing the MWP minimum against the current incomplete melting. There is a lag between CO2 rise and temperature rise, and there is a lot of inertia in the ice sheet. Even CO2 levels were to stop rising today, we don't know that the melting already baked in isn't much greater than the MWP melting. -
Leo G at 05:48 AM on 24 March 2010Skeptical Science housekeeping: Contradictions, URLs and getting hacked
HR and Ned, here is Dr. Svalgaard's own words about his position; "John L (15:38:59) : Can someone, perhaps Leif Svalgaard himself, point me to a single argument, debate, website, presentation, speech, paper, etc. where Leif explains why exactly he considers himself a skeptic, or lukewarmer, or a…whatever? For the record: 1) Temperatures are higher now than 100 years ago. Exactly how much can be discussed [fakings, UHI, etc]. 2) Solar activity has been ‘flat’ since 1700 with a ~100-yr ‘cycle’ on top. It is not clear if this ‘cycle’ is a real cycle or just a random fluctuation. 3) Solar activity and cosmic ray modulation do not go away during Grand Minima [although sunspots are less visible] 4) There is a 0.1% change of TSI between solar min and solar max, resulting ~0.1C temperature variation 5) No long-term variation of TSI has been demonstrated 6) No convincing evidence for a sizable solar modulation of climate has been demonstrated 7) No convincing evidence for CO2 being the cause of the warming [see point 1] 8) In the deep past [billions of years] CO2 was a significant greenhouse gas, because of its much higher partial pressure than today 9) Solar models are not good enough for detailed prediction, but our understanding of the solar interior and explanation of energy production are on firm footing 10) Solar polar fields seem to be a useful predictor [and it is semi-understood why] 11) Climate models have not been very successful, but should work in principle 12) Both the Sun and the Earth can exhibit ‘internal’ cycles. E.g. some stars pulsate and change luminosity on a large scale [50-100%] 13) Various ‘external’ influences [planets, galactic 'positions', interstellar clouds, electric currents from the galaxy, etc] are either not operating or their effects are negligible 14) The cosmic rays vary too little to have any effect and the mechanism proposed does not seem to work [you can always extend your belief a bit by claiming that more data is needed] Considering the above, I don’t know what you would call me. And I don’t care" -
muoncounter at 05:45 AM on 24 March 2010What CO2 level would cause the Greenland ice sheet to collapse?
John, Answered my own question with this graph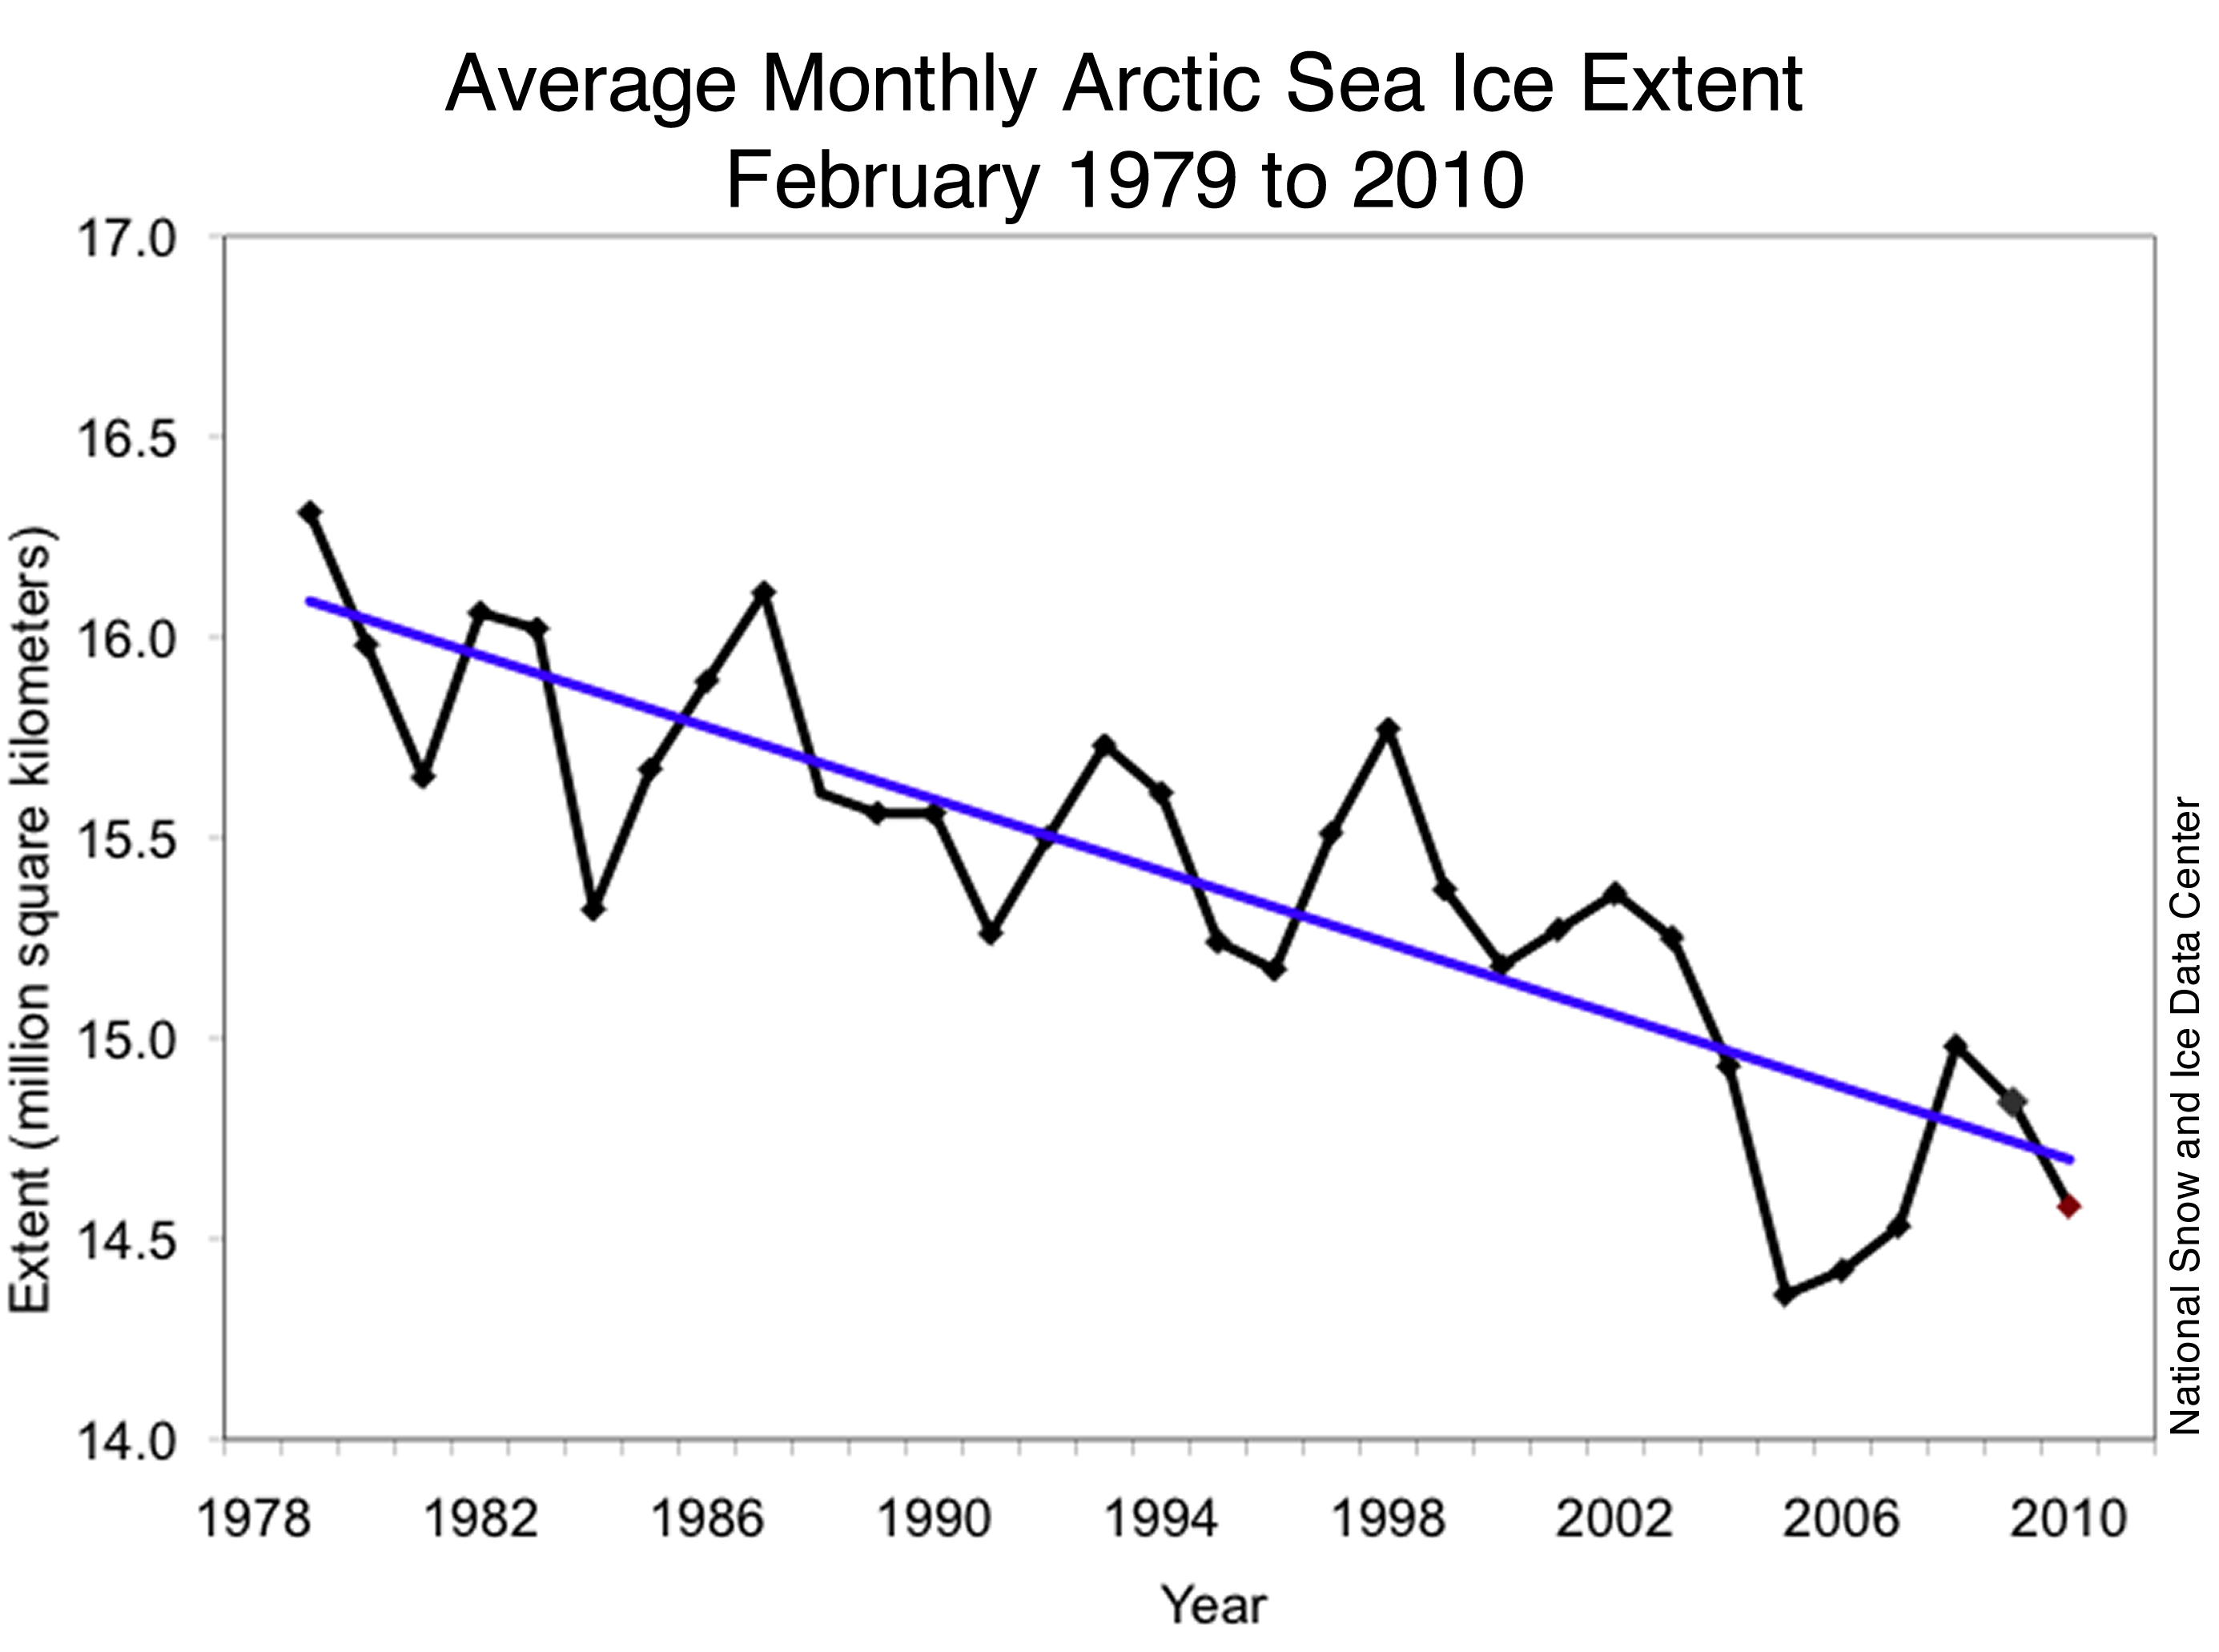 . Full scale here. This somewhat longer term trend is indeed down. Should be smooth sailing through the Northwest Passage.
-
muoncounter at 05:34 AM on 24 March 2010What CO2 level would cause the Greenland ice sheet to collapse?
John, Nice work, albeit very scary.I wonder how figure 1 (Greenland ice mass loss, from Velicogna) would compare with a graph of ice loss data from Arctic observations at nsidc.org. A quadratic trend as shown has ghastly implications. Alexandre, I wonder about your remark in 24, "apparently we're talking about the most resilient land ice mass in the Northern Hemiphere." A study entitled "Climatic impact of a Greenland deglaciation and its possible irreversibility," published in the 2004 Journal of Climate, available here, makes a case quite to the contrary. The authors took the well-established effect of post-glacial isostatic rebound into account, showing that an ice-free Greenland would rise so that there would no longer be an accumulation zone. Once its gone, its gone. To quote Randy Newman, "Boom goes London, boom Paree." As far as time scale of these potential events is concerned, there is ample geologic evidence that glacial melt and associated freshwater runoff can indeed be sudden. See this Goddard Institute study of "meltwater pulses." In short, the mechanism (discussed at length here, is thus: Warming causes meltwater to pond locally, forming large lakes trapped behind localized "ice dams." Breaching an ice dam can happen quickly, resulting in catastrophic flooding (I've seen the sedimentary evidence left by these floods first-hand). And as the land mass becomes ice-free, it rises to seek gravitational equilibrium. -
Tom Dayton at 02:40 AM on 24 March 2010The 5 characteristics of scientific denialism
RSVP, we experimental psychologists say "There are the hard sciences, and then there are the really difficult sciences." Every year, thousands of students in labs for classes dutifully execute psychological lab experiments that always have yielded the same, predicted-by-theory results for the previous tens of thousands of students over the previous many decades. Experimental psychology has a long history. Even the brief entry in Wikipedia reveals your statements to be false. But your bigger error was equating the scientific method to "predicting and reproducing results in a lab." Most broadly, science is what scientists do. -
CBDunkerson at 23:26 PM on 23 March 2010What CO2 level would cause the Greenland ice sheet to collapse?
Gallopingcamel, there is 'comparing apples to oranges' and then there is what you did above. John wrote about a global change in temperature which the IPCC has projected for the year 2100... you 'countered' with a (disputed) local change in ice coverage compared to current levels. Each of those discrepancies (i.e. global vs local, temperature vs ice coverage, and 2100+ versus current) potentially invalidates the 'comparison'. Together they make it incomprehensible. -
Alexandre at 22:42 PM on 23 March 2010What CO2 level would cause the Greenland ice sheet to collapse?
JMurphy, Thanks for the response. Ok, so the only remaining land ice mass was significantly reduced - we might say collapsed? What caught my attention here was the 3 degree warming and the remaining ice sheet. But you're right: "remaining" does not mean "unchanged". One important point to stress here, is that apparently we're talking about the most resilient land ice mass in the Northern Hemiphere. So if Greenland feels it, than Siberia and all its permafrost will feel much more... -
JMurphy at 21:53 PM on 23 March 2010What CO2 level would cause the Greenland ice sheet to collapse?
Alexandre, the USGS study states that their reconstruction was based on "ice volume and areal coverage on Greenland [being] reduced by 50%", and other studies suggest that the CO2 levels were a bit higher (around 400ppm) and that Greenland actually collapsed. See this WIKIPEDIA page for an overview and more sources. Is it really different from Stone ? -
JMurphy at 21:22 PM on 23 March 2010The 5 characteristics of scientific denialism
RSVP wrote : "It would therefore be helful if climate scientists recognise these limitations, and simply own up to the fact that theirs is also a mix of hard and soft (since it "relies on physics and chemistry), but on the whole, it is a soft science." How is it a 'soft science' ? Models have been making predictions for 20 years or so, since Hansen's famous one with the 3 scenarios - have you tested that ? How about the prediction of rising temperatures alongside rising CO2 - have you tested that ? How about Tropospheric temperatures - tested by you ? -
Alexandre at 21:19 PM on 23 March 2010What CO2 level would cause the Greenland ice sheet to collapse?
According to USGS, there was a period in the Pliocene when CO2 levels were similar to today's (~380ppm), temperature was some 3ºC higher (slow vegetation and ice albedo feedbacks, I assume), and sea level was as high as 25m above today's level. Even so, the Greenland ice sheet was still there, being the only land ice mass in the Northern Hemisphere. I looks different than the Stone 2010 results. Can someone help me put this in context? -
philipm at 20:54 PM on 23 March 2010A peer-reviewed response to McLean's El Nino paper
Mangeclous (41): near surface isn't surface. I'm not sure what altitude is used but this picture illustrates how fast temperature drops with altitude for the first 10km above the surface:
-
Jesús Rosino at 20:28 PM on 23 March 2010What CO2 level would cause the Greenland ice sheet to collapse?
Thanks for the post, John! Although emissions are running in the high end, I think that concentrations are not (closer to A2??, I read it in a comment by a moderator in RC, but I cannot find it right now). Anyway, a small difference difficult to asses for such a short period.Response: Here is a comparison of CO2 levels to projected IPCC levels. Two things to note - the graph is several years old and you'd need to get in a little closer to get a good look at the difference between the two.
Figure 1: Monthly carbon dioxide concentration (blue thin line) and its long term trend (strong blue line) as measured at Mauna Loa, Hawaii. Dashed line is IPCC's projected carbon dioxide levels (Rahmstoorf 2007). -
David Horton at 19:52 PM on 23 March 2010What CO2 level would cause the Greenland ice sheet to collapse?
Ah, I see, of course, silly of me. And now to turn to gallopingcamel. Life was much easier for people like Mr Camel before the internet. Go to his Wikipedia article and you find "Excavations show that there were considerable birch woods with birch trees up to 4 to 6 meters high[citation needed] in the area around the inner parts of the Tunuliarfik- and Aniaaq-fjords". Now I was amazed to learn (although I can't find these fjords on a map, the Wikipedia entry says they are around "the central area of the Eastern settlement") that the phrase "the area around the inner parts of the Tunuliarfik- and Aniaaq-fjords" is incredibly common on the internet - Google gives 3170 appearances on web sites called things like "Global Warming A Fraud". And here was me thinking Mr Camel had come up with this himself! It is also worth noting that archaeological research has (understandably) been very limited on Greenland; that in any case I'm not sure how palynology gives you birch "4 to 6 meters high" what a pity there is no citation; that the area of trees etc was clearly small from Mr Camel's reference, so to say "the Greenland ice sheet was less extensive" is to stretch a very long bow; that there are still today parts of Greenland coast free of ice; that the ice sheet itself is very old indeed; that, even in the Wikipedia article, a number of hypotheses are given about the demise of the colony; and, again Wikipedia, warm currents are suggested as part of the reason for warmer coastal regions. -
Arkadiusz Semczyszak at 19:44 PM on 23 March 2010What CO2 level would cause the Greenland ice sheet to collapse?
Discussion - debate about the fate of the Greenland ice should not ignore this work: "Greenland Ice Sheet Surface Air Temperature Variability: 1840–2007*" Box et. al. 2009, AMS DOI: 0.1175/2009JCLI2816.1 Especially Figure 10, 11, 14 are very interesting. In the years circa 193X-5X; in Greenland was warmer than today. Especially in the spring. Only now the autumn is warmer in Greenland. Why is cooled? Climatic cycles? Aerosols? (sulfur, black carbon?) Let me quote also two important pieces of this important work: "Global and NH warming 1975–2007 has been attributed to the dominance of increased greenhouse and solar forcing over various cooling factors (Solomon et al. 2007). High-latitude warming is simulated by global climate models to be amplified by the ice albedo feedback (Budyko 1969; Solomon et al. 2007). NHcooling 1940–70 has been attributed primarily to the dominance of sulfate aerosol cooling sourced from increased coal-fired power plants largely in the Western Hemisphere (Wildet al. 2005, 2007), and partly to decreasing solar activity during that period (Solomon et al. 2007). Subsequent warming is attributed primarily to increasing greenhouse gasses while coal-fired power plant SO2 emissions were reduced. Whether sulfate aerosols directly or indirectly cooled west Greenland, that is, far away from industrial sources, is something we address in OUR INTERPRETATION." "With the exception of major volcanic eruptions, cooling caused by a negative phase of the Atlantic Multidecadal Oscillation and/or NAO (Hanna and Cappelen 2003) and strong decreases in solar output are the only potential regional climate trends (Keenlyside et al. 2008) we are aware of to moderate Greenland deglaciation. Climate warming has pushed the Greenland ice sheet beyond its threshold of viability in recent years (Rignot et al. 2008). The ice sheet seems poised not to grow without substantial regional and global climate cooling. It therefore seems much more likely that not that [“our interpretation”?] Greenland is and will be for the foreseeable future be a DEGLACIATING PLEISTOCENE ICE AGE RELIC." We see that natural variability is very important here - the most important? -
David Horton at 19:15 PM on 23 March 2010What CO2 level would cause the Greenland ice sheet to collapse?
John the GRACE graph is frightening. But two questions. How can the ice mass changes be positive before 2006? Positive compared to what? And (I guess) a related question, are there estimates of ice mass/ice mass change using other methods prior to these satellite observations?Response: The graph is showing ice mass changes relative to an average value. The caption doesn't specify the base period but presumably it's April 2002 to February 2009 - the period over which they have data. In which case, naturally the first half of the time series would be positive and the second half would be negative (if you had a negative trend).
Yes, Greenland ice mass change has been determined by other methods (van den Broeke et al 2009). This paper is explored in an earlier post Why is Greenland's ice loss accelerating? -
RSVP at 18:58 PM on 23 March 2010The 5 characteristics of scientific denialism
There is this concept of "hard" science as applied to physics and chemistry. The word was clearly used to separate these from other "softer" fields of study such as psychology or economics, the reason being that in these areas you can not apply the scientific method, (i.e., predicting and reproducing results in a lab). There seems to be a clear parallel here with Climate Science in that the Earth's climate does not fit into a lab, nor lends itself to predictable and repeatable testing. It would therefore be helful if climate scientists recognise these limitations, and simply own up to the fact that theirs is also a mix of hard and soft (since it "relies on physics and chemistry), but on the whole, it is a soft science. -
PaulK at 16:52 PM on 23 March 2010Understanding Trenberth's travesty
The use of SLR data to "validate" the Schuckmann conclusions is, in my view, not a robust argument. The long-term tidal guage data shows a (remarkably) constant gradient trend throughout the 20th century, despite the significant variation in both average surface temperature and estimates of OHC. This suggests that the prediction of OHC from SLR data is mathematically ill-conditioned. Given the now critical importance of the deep OHC data in underpinning the basic foundations of AGW, I would really like to see a full regional reconciliation of the Schuckmann findings with the more certain 0-700m data, and a realistic estimate of the uncertainty associated with the deep temperature measurements. I am honestly surprised that he did not include this analysis in the paper to add credibility. -
gallopingcamel at 16:47 PM on 23 March 2010What CO2 level would cause the Greenland ice sheet to collapse?
What I love about this blog is the wonderful statements at the head of each thread. This one includes a real gem: "The last time temperatures were this high were 125,000 years ago." If you believe this you must be a Medieval Warm Period denier. While most parts of Wikipedia relating to AGW have been re-written by William Connolly, the part that relates to the history of Greenland has survived. The link below shows that the Greenland ice sheet was less extensive during the MWP. http://en.wikipedia.org/wiki/History_of_GreenlandResponse: I should clarify, 'the last time global temperatures were this high...' There were regions during the Medieval Warm Period that were as warm or warmer than the same regions today. -
Jeff Freymueller at 16:13 PM on 23 March 2010What CO2 level would cause the Greenland ice sheet to collapse?
#11 Humanity Rules. Darn it, I typed out a longish reply, then clicked in the wrong place and lost it. Not going to type it out all over again. But I will point out that the future predictions of the model are all for 400 years from now. They tuned the ice sheet model to match the present ice sheet, and they don't make any prediction about where things will melt first. It looks like the bedrock topography plays a big role in the pattern of predicted ice sheet retreat (see Figure 12 of the paper). However, they didn't discuss it in the paper that I could find, so this is my interpretation. In particular, it looks like the mountains in SE Greenland divide the ice sheet into a main part that has to drain out somewhere other than the SE, and the coastal strip in the SE, plus a few glaciers in the SE that cut through the mountains. So it appears the pattern is controlled by the principle that "water and ice go downhill". -
billkerr at 14:26 PM on 23 March 2010What CO2 level would cause the Greenland ice sheet to collapse?
hi john, Thanks for all the work you have put into this great blog. I read Hansen's book, it sounds like you have too. The paleoclimate information and ice and ocean inertia issues he raises worry me as well. From memory I think Hansen said it bordered on insanity to consider adaptation to significant sea level rise. Nevertheless, I looked further and found that Richard Tol et al have actually modelled an adaptation scenario for the complete collapse of the West Antarctic sheet: Global Estimates Of The Impact Of A Collapse Of The West Antarctic Ice Sheet: An Application Of Fund I expect you and your readers will be interested in the Tol et al study. I want to think about this a bit or probably a lot more before attempting to pass judgment. After all the consequences of reducing or stabilising CO2 are very significant as well especially since no governments have realistic energy plans for the future as currently being discussed on Barry Brook's blog, Brave New Climate -
scaddenp at 13:47 PM on 23 March 2010The 5 characteristics of scientific denialism
oracle2world - this is an extraordinarily weird definition of AGW theory that you are working with. It is really a physical theory of climate from which you deduce that if x extra amount forcings (GHG, land change, aerosols) is of human origin, then it will result in extra warmth, and that the observed warming since 1940s is primarily of human doing. AGW does not predict future emissions at all; nor super volcanoes, nor changes in solar. Instead, it is a theory which says that if you continue to increase GHG to this level, you get this climate. It can also happily tell you what the likely effects on climate of another volcanic eruption - or a prolonged solar minima. If you want to send a rocket to mars you don't rely on history - you calculate based on known physics. Just so with climate. Do you think greenhouse gas effect isn't hard science? Model is doing pretty good so far at predicting climate if you check the model /data comparisons. -
oracle2world at 13:24 PM on 23 March 2010The 5 characteristics of scientific denialism
Ned I said no expectation of reproducibility. Since the earth's state is constantly evolving, and nothing ever repeats through time, no climate model based on past history can predict the future. Certainly not to within a gnat's eyelash that fearmongers would like. This is just an extraordinarily difficult problem, even if climate scientists were completely dispassionate, with no grant riding on support of AGW, and no preconceived expectations to confound their research. And if AGW was discarded tomorrow, no one in the hard sciences would think much of the failure. Just another hard problem people took a crack at. Brownie points for effort. The Yellowstone supervolcano is overdue to erupt. That probability of eruption (which is unknown) is not taken into account by climate models. Why is that? The assumption is that the probability is low. But the probability is actually unknown. How about a "nuclear winter" that was fashionable years ago? Now the probability of total thermonuclear war, if one can believe the Union of Concerned Scientists, isn't low. So why is this scenario not taken into account? -
Tenney Naumer at 13:07 PM on 23 March 2010What CO2 level would cause the Greenland ice sheet to collapse?
Thanks for this post, John. I have a question about CO2 equivalents. Did the Stone paper have anything to say about these?Response: I didn't see any mention of CO2 equivalents and I did wonder that myself, considering the CO2 equivalent once you factor in methane and other man-made greenhouse gases is already well over 400 ppm. Please feel free to try contacting the author to enquire about this question and report back to us :-) -
ajgunther at 12:59 PM on 23 March 2010What CO2 level would cause the Greenland ice sheet to collapse?
Can you identify the source of the data in Figure 4? Thanks.Response: Good question - I'm getting more disciplined about citing my sources but this one slipped through the cracks. That graph came from The Copenhagen Diagnosis which I'm now adding to the caption. -
HumanityRules at 12:54 PM on 23 March 2010What CO2 level would cause the Greenland ice sheet to collapse?
9.Jeff Freymueller at 12:38 PM on 23 March, 2010 Again I could easily be wrong but this is not looking at temporal change. This model is saying if conditions are x, y and z what should the Greenland icesheet look like. It says nothing about what happens over the next 400years. As you say it does require that as the process continue there is a complete shift in how ice mass is lost. -
HumanityRules at 12:46 PM on 23 March 2010What CO2 level would cause the Greenland ice sheet to collapse?
How reliable can this model be if it miscalculates the expected size of the ice sheet by 25% based on present day conditions and observations? -
Ned at 12:46 PM on 23 March 2010Skeptical Science housekeeping: Contradictions, URLs and getting hacked
HR writes: Svalgaard seems like a perfectly good solar scientist. I was reading many of his posting on [WUWT] yesterday because I was going over the ACRIM gap debate again. He seems fairly independently minded, dry, witty and intelligent. I'd agree with 51.Arjan description of the guy. I was wondering whether he is generally seen as a denier because I find him hard to label. I agree with that assessment. Svalgaard is definitely hard to label. He will also probably be the first to admit that his views are not representative of others in the field. I wouldn't call him a "denialist" at all. His off-and-on forays into Watts's site show that he has more patience than I do. -
Jeff Freymueller at 12:38 PM on 23 March 2010What CO2 level would cause the Greenland ice sheet to collapse?
#5 HumanityRules I'm not sure that there is an inconsistency, or even an apparent one. One quantity is present loss, the other is predicted loss over 400 years. Not surprisingly, the warming has hit the southern part first, but that doesn't mean draining the southern part of Greenland ice sheet will contribute more mass in the long term if most of the ice sheet is lost over that long term (if nothing else, Greenland is skinnier in the south, so there may simply be less ice to lose). Differences in the sub-glacial bedrock surface, numbers of outlet glaciers to the sea, all can make a difference as well. Having said that, I just downloaded the paper, and I suspect the authors explain in more detail. (I just downloaded it from home for free, so probably you can too). -
Ned at 12:35 PM on 23 March 2010What CO2 level would cause the Greenland ice sheet to collapse?
I wrote: ... we still don't know convincingly where the water came from! To clarify, obviously we know the water came from melting ice. But at least as of a couple of years ago people were still arguing whether that ice was in the Antarctic, North America/northern Europe, or both.
Prev 2430 2431 2432 2433 2434 2435 2436 2437 2438 2439 2440 2441 2442 2443 2444 2445 Next


