


 Arguments


Recent Comments
Prev 2434 2435 2436 2437 2438 2439 2440 2441 2442 2443 2444 2445 2446 2447 2448 2449 Next
Comments 122051 to 122100:
-
tobyjoyce at 06:28 AM on 19 March 2010The 5 characteristics of scientific denialism
Re: Geo Guy (#15) It seems the best you can do on the Russian stations is offer a paper from the Cato Institute, a political think-tank. Something from a peer-reviewed journal, maybe? I thought not. I'll stick with Tamino's description of D'Aleo and Smith as "plain wrong" and "incoherent". http://tamino.wordpress.com/2010/03/05/message-to-anthony-watts/ I don't mind if we draw a line under this at this point, unless you can do a bit better. -
Dennis at 06:04 AM on 19 March 2010The 5 characteristics of scientific denialism
TrueNorth @96 "... there are fools on the other side who believe that everything bad that happens must be caused by global warming." Who? I strongly suspect that either: 1. their words and writings do not mean what you claim here, or: 2. they have been called out for their errors by members of the scientific community. -
Geo Guy at 05:39 AM on 19 March 2010The 5 characteristics of scientific denialism
In response to tobyjoyce at 06:26 AM on 18 March, 2010 "Please investigate your claim further and get back to us." The researchers who identified the issue with respect to NASA are American researchers Joseph D'Aleo, a meteorologist, and E. Michael Smith, a computer programmer, who point out in a study published on the website of the Science and Public Policy Institute, NOAA uses "just one thermometer [for measuring] everything north of latitude 65 degrees." A search of the internet using the two authors names will give you a large list of references where this issue has been reported - one being http://www.spaceref.com/news/viewpr.html?pid=30000 As for further details on the Russian temp data: The IEA believes that Russian meteorological-station data did not substantiate the anthropogenic global-warming theory. Analysts say Russian meteorological stations cover most of the country's territory, and that the Hadley Center had used data submitted by only 25% of such stations in its reports. Over 40% of Russian territory was not included in global-temperature calculations for some other reasons, rather than the lack of meteorological stations and observations. The data of stations located in areas not listed in the Hadley Climate Research Unit Temperature UK (HadCRUT) survey often does not show any substantial warming in the late 20th century and the early 21st century. The HadCRUT database includes specific stations providing incomplete data and highlighting the global-warming process, rather than stations facilitating uninterrupted observations. On the whole, climatologists use the incomplete findings of meteorological stations far more often than those providing complete observations. IEA analysts say climatologists use the data of stations located in large populated centers that are influenced by the urban-warming effect more frequently than the correct data of remote stations. The scale of global warming was exaggerated due to temperature distortions for Russia accounting for 12.5% of the world's land mass. The IEA said it was necessary to recalculate all global-temperature data in order to assess the scale of such exaggeration. Global-temperature data will have to be modified if similar climate-date procedures have been used from other national data because the calculations used by COP15 analysts, including financial calculations, are based on HadCRUT research. For an in depth look at the paper go to: http://www.cato-at-liberty.org/2009/12/17/new-study-hadley-center-and-cru-apparently-cherry-picked-russias-climate-data/ -
Albatross at 05:35 AM on 19 March 2010A peer-reviewed response to McLean's El Nino paper
GeoGuy, @ 31. First, climate scientists do not attribute all the observed warming to increases in GHGs, the numerous drivers are documented and quantified in AR4. Second, scientists have filtered out natural variability form internal climate modes (incl. ENSO) and detected a monotonic and accelerating warming trend in the 20th century. Please read my post @14, or read the paper by Swanson et al. (2009, PNAS). Also, McLean et al. (2009) seem to be guilty of confirmation bias, as were Lindzen and Choi (2009). Does that not concern you? -
CBDunkerson at 05:30 AM on 19 March 2010A peer-reviewed response to McLean's El Nino paper
Here you go Geo Guy;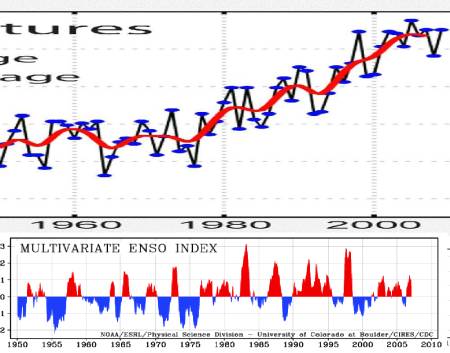 As to your comments, El Nino and other oceanic variations are short term events with flat trend lines. They thus aren't any more examples of 'climate change' than the seasons or day and night are.
-
Riccardo at 05:28 AM on 19 March 2010A peer-reviewed response to McLean's El Nino paper
Geo Guy, the point here is not to accept or refuse a methodology. The problems is that McLean et al. filtering procedure does not allow any claim on the trend. Indeed, after the case exploded, they said they were just looking at assessing the lag thus admitting that no conclusions on the trend can be draw from their analysis. That ENSO influences the global mean temperature variability is widely recognized. What is not is that ENSO has an influence on the trend. There are many analisys around showing this point, it's relatively easy, you can try yourself or read this related post and references therein -
Geo Guy at 05:06 AM on 19 March 2010A peer-reviewed response to McLean's El Nino paper
Ok..my image link did not show up..please go to http://www.stratified.com/comap_1.jpg to view it....sorry I did follow the instructions for posting images here but it didn't work for me..:( -
Geo Guy at 05:04 AM on 19 March 2010A peer-reviewed response to McLean's El Nino paper
I think this is an example of "you can use statistics to generate relationships that you want people to see". This doesn't add any substance to the debate at all. One thing abut science is that you can get a group of peers that will refute a specific premise AND you can find a group of peers that will support the same premise. While peer reviews do have their place in the evolution of science, the process is open to manipulation in that a group can focus on peers scientists that have a contrary view. As far as el Nino is concerned, from my perspective (and experience as where I live is affected by el Nino) I am convinced there exists a relationship between spikes in global temperatures and el Nino activity. The following image is a rough plotting of el Nino activity (1950 to present) along with average global temperatures for the same period. I don't think you need a Phd in statistics to see that there certainly appears to be a correlation between peak temperatures and el Nino activity. More importantly, the period from 1978 to the present is characterized by extreme el Nino activity versus a prevalence of el Nina, where periods of related cooling occurred between 1950 and 1975.I am left wondering what the response will be from those saying that the climate change is attributable only to increases in atmospheric CO2 while the comparison of data indicates warming temperatures related to high el Nino activity. At the very least, climatologist should factor out global temperature increases attributable to el Nino activity in order to substantiate their claim.
-
Albatross at 04:58 AM on 19 March 2010Watts Up With That's continued ignorance regarding Antarctic sea ice
Peter (Hogarth) any thoughts on #78? Not sure where their reference to "accelerating" came from? Those data appear to be OI.v2. Not sure how they compare with ERSST.v3b, which now does not use satellite data. Anyhow, these GODAS data also show warming of the southern polar oceans: http://www.youtube.com/watch?v=osu4o-Fi38A The NODC 0-700 m OHC also show warming of oceans south of 60 S
-
Berényi Péter at 04:22 AM on 19 March 2010Watts Up With That's continued ignorance regarding Antarctic sea ice
Ned, I don't advocate anything. Just noticed the trend in differences (significant on 95% level, strange for such a short series). Neither I want to accuse anyone. It can be pure chance or instument ageing or whatnot. Anyway, the animation is awesome. -
suibhne at 04:17 AM on 19 March 2010The 5 characteristics of scientific denialism
tobyjoyce I thought you might be interested in this device. I don't mind if you pass it round your "consensus" friends. I think this proves I'm not a bad chap even though they call me names. http://www.vermonttiger.com/content/2008/07/nasa-free-energ.html -
aj1983 at 04:09 AM on 19 March 2010It's Urban Heat Island effect
Dr. Spencer's blog post of March, 16 might need someone to look into. Dr. Spencer will probably try to publish his results. I'm wondering where it goes wrong when he projects that the temperature rise in the US since 1979 is close to 0 (instead of close to 0.2 C/decade from the CRUTem3 dataset), when corrected for the UHI influence (his "true warming trend"). He will probably make a case that this is even worse when put in a global perspective, so contributing all current warming to the UHI effect, even though this contradicts his own analysis of satellite measurements (which are obviously not UHI contaminated). I can think of a few things (choosing stations with very low population density vs very high population density will probably lead to relatively small regional analyses, which can, combined with the relatively short period of measurements be attributed to pattern changes instead of global warming). However, I'm not sure, this is only just speculation of course, but it shows a major deviation from other studies, so it is worth mentioning. -
TrueNorth at 04:08 AM on 19 March 2010The 5 characteristics of scientific denialism
@David Horton: I got that idea because the original coiners of the Climate Denier meme explicitly made the connection with Holocaust Denialism. Fools like David Suzuki even mused about trowing people in jail for their thoughcrimes. As I granted in my original post, there are indeed fools on the skeptical side who aren't interested in whether AGW exists or not, just as there are fools on the other side who believe that everything bad that happens must be caused by global warming. My point is that there are enough blogs and websites out there for the fools on both sides to throw stones at each other and mock the other side's idiotic statements. THIS blog, which appeals to me because it deals with careful examination of the scientific evidence, should eschew such childish behaviour and instead treat rational skeptics/believers with respect (and just ignore the irrational ones). Besides which, is anyone worth convincing a 100% believer or skeptic? I go back and forth all the time between in "small problem" and "possibly serious problem" range as new evidence comes in. That is why I am here: I really want to know. You will have an easier time convincing me and others like me if (a) you stick to the evidence and (b) give the impression that this blog itself is at least open to the idea of being proved wrong. On the latter point, can you point out to me a single post where you stated something (perhaps based on research from the CRU or a comment from Rajendra Pachauri that you later had to admit was wrong?). If you can, you will INCREASE my degree of trust in this blog. -
Peter Hogarth at 03:30 AM on 19 March 2010Watts Up With That's continued ignorance regarding Antarctic sea ice
Berényi Péter at 01:18 AM on 19 March, 2010 I'm not surprised by the slight differences. Different satellites, different sensors, slightly different resolution, and slightly different processing algorithms for definition of sea ice "edge". AQUA satellite (AMSR-E sensor) only launched 2002. Different groups processing same data also use slightly different algorithms. I'll chase up methods, error estimates etc, but I seem to remember they are public access. This debate is "Arctic" though... -
JMurphy at 03:13 AM on 19 March 2010The 5 characteristics of scientific denialism
With reference to No. 92 : The bit near the end - "josil (the very first comment !)" in red - should be directly below "gallopingcamel". And the link for josil should be http://www.skepticalscience.com/5-characteristics-of-scientific-denialism.html#10642 That means that the last paragraph (beginning "....well, as a list") belongs with "As for Geo Guy :", which should have the link http://www.skepticalscience.com/news.php?p=2&t=85&&n=161#10719 Sorry about that and I hope it all makes sense... -
Jeff Freymueller at 03:08 AM on 19 March 2010The 5 characteristics of scientific denialism
#79 RSVP, and there you go, in #82. Exothermic is 10% of geothermal, 0.15% of greenhouse gases effect. -
Jeff Freymueller at 03:05 AM on 19 March 2010The 5 characteristics of scientific denialism
#79 RSVP, have you compared the total heat from exothermal reactions to the geothermal heat flow? Total outward (from the solid earth) geothermal heat flow is 4.43 * 10**13 W. -
JMurphy at 03:05 AM on 19 March 2010The 5 characteristics of scientific denialism
It's amazing how you have posted this article about the five characteristics of scientific denialism, and up pop loads of confirming posts from those who want to deny ! If they're not trying to act hurt at being called deniers/denialists : TrueNorth ...they're (possibly unknowingly) confirming their need for conspiracy theories, logical fallacies, fake experts and impossible expectations. See : Frans Dijkstra suibhne They also make things up, misquote/misunderstand (especially about Phil Jones) and assume full knowledge (particularly on 'hockey-sticks'). See : TrueNorth (again) suibhne (again) thingadonta And, having mentioned the 'hockey-stick', surely there is a marked obsession from these people over certain issues like that; and over people like Gore, Mann, Pachauri, etc ? If they didn't bring them up all the time (and then claim that everyone else treats them like 'gurus' because they are always being mentioned), those names would hardly ever be seen. See : gallopingcamel As for Geo Guy : josil (the very first comment !) ...well, as a list of issues that need to be debunked, have been debunked and are debunked on this very site, he has provided a very good basis for his own rebuttal and a good advertisement for this site : Skeptic Arguments and What the Science Says (Was he a plant ?) -
The 5 characteristics of scientific denialism
Just went and read that Pierrehumbert article Axelsen pointed out again; it appears I misinterpreted it a bit. The 0.006 W/m^2 figure is exothermic heat for burning the amount of coal required to satisfy the _entire_ planetary electric power budget, the 4.0 W/m^2 is the CO2 energy trapping that would be caused just by burning that much coal. So running the numbers, the exothermic heat from a carbon based fuel turns out to be <1/666 the greenhouse gas effect from burning that same fuel. Exothermic heat from carbon fuels has _almost no_ effect on global warming compared to the CO2 produced. Hmm, sounds like an argument for solar and nuclear power... -
Jeff Freymueller at 02:48 AM on 19 March 2010The 5 characteristics of scientific denialism
#76 RSVP, no scientific hypothesis that I am aware of depends on the way that one might parse the words "global warming". "Global warming" is the popular/common name for the climate change we are experiencing, and while there could be a more exact name, it would have several additional words. Contrary to your assertions via question, I think scientists have explained things just fine, but some people don't want to hear. As for what happens after the polar ice caps melt away, if that happens the world will already be a radically different place, and what happens afterward is not really the most important thing. -
RSVP at 02:17 AM on 19 March 2010The 5 characteristics of scientific denialism
KR I have read what you said and understood what you said. I actually have a real live (almost) however and will try to get back to you on this as soon as I can. If what you said is the case, that is fine and it does make sense, however, I disagree that Axelsen gave me such a clear response, because if he had have you would´nt have had to come to his aid. Specifically, he made a reference to GHG and GHG mean all GHGs, not just those produced by man. Anyway, I will try to revisit this problem asap. Thanks. -
Ned at 02:08 AM on 19 March 2010A peer-reviewed response to McLean's El Nino paper
Tony O, yes, that's a shorter way of saying the same thing. -
Ned at 02:03 AM on 19 March 2010Watts Up With That's continued ignorance regarding Antarctic sea ice
Berényi Péter writes: Looks like the difference between the two datasets is not random, NSIDC trying to emphasize the decline. Okay, that's a very serious accusation. I assume you have some evidence to back that up? As you know quite well, we generally try to avoid suggestions of dishonesty on this site. More to the point, Jeff's claim about "recovery" after 2007 isn't much better supported in the JAXA data you cite. 2008 and 2009 are still lower than any of the preceding years. 2009 does fall just about right on the 2003-2006 trend (which itself is based on only four points!) so the best that Jeff Id could say is that from 2007 to 2009 Arctic sea ice returned to its pre-2007 rate of rapid decline. That's a very strange use of the word "recovery" IMHO. The JAXA data show a trend of -0.20 million km2/year from 2003-present. The NSIDC data show a trend of -0.22 million km2/year for the same period. I think it's a bit odd that, given two very similar data sets, you're advocating to use the one that has only seven years of data instead of the one with 31 years. But there's little difference in the trend in either case. Both show a rapid decline. Using your preferred data set (JAXA) and projecting the linear trend forward gives an ice-free Arctic basin in Sept. 2034. I don't suggest that this is a good method (extrapolating from a seven-year trend) but it shows the foolishness of Jeff Id's claim that Arctic sea ice has "recovered". FWIW, I agree that it would be better for NSIDC and JAXA to include confidence intervals in the same data table. -
Philippe Chantreau at 01:54 AM on 19 March 2010A peer-reviewed response to McLean's El Nino paper
HR: yes, but they couldn't put together a response that would pass review... -
The 5 characteristics of scientific denialism
( #85 ) RSVP, Axelsen in #82 gave you a _very_ clear response which you seem to have misunderstood. Accounting for the exothermic output of coal burning leads to an energy increase (forcing) of 0.006 W/m^2, averaged over the planet. Changes in CO2 concentration blocking certain IR wavelengths leads to an imbalance/forcing of 4.0 W/m^2. That means that C02 is ~666 times (hmm, number of the beast, curious) more important than coal burning in the energy accumulation and heating of the planet. "No comparison, why not? Not sure what exactly your numbers represent..." I find that difficult to believe, but please re-read #82 and look at the link Axelsen provided. Now, coal burning certainly isn't the only exothermic reaction going on. Burning of plant matter, oil, nuclear, even solar energy collection (using the energy -> heat rather than it reflecting back out to space). But I think that even the most generous accounting shows that exothermic reactions are around two orders of magnitude less important than CO2 forcing. They're certainly a factor; but for ~1% of the heating! That's 'utterly trivial', to quote the article Axelsen points to. -
gallopingcamel at 01:28 AM on 19 March 2010The 5 characteristics of scientific denialism
Berényi Péter (#83), as usual, way above my pay grade. However there was one thing that I can comment on. Probably way off subject for this thread but I hope JC will let it stand as it is an inspiring example of what can be achieved when enough people agree on something. In 1800 the river Thames was a commercial salmon river but the growth of the city and the practice of dumping untreated sewage into the river destroyed the fish habitat. The last Thames salmon was caught in 1815. The pollution got steadily worse until by 1955 the river was a stinking sewer with no vertebrate life forms. It got so bad that the House of Commons had to suspend its sessions owing to the stench! As you can guess that got their attention and the Parliament enacted stronger legislation covering the discharge of untreated waste into the river. However, it took decades of effort by the government (Thames Water Authority), corporations, engineers and private organizations to reverse the pollution. When I left London in 1981, there were over 80 species of fish in the tidal reaches of the Thames and I grew rainbow trout (a salmonid) in commercial quantities using water pumped from the river. Today the salmon are back and ~115 other vertebrates as well. See http://www.riverthamessociety.org.uk. This shows that even appalling levels of pollution can be reversed! -
Berényi Péter at 01:18 AM on 19 March 2010Watts Up With That's continued ignorance regarding Antarctic sea ice
#75 Ned at 23:12 PM on 17 March, 2010 "Here are the trends in sea ice extent" I have looked up average Arctic sea ice extent figures for September at IJIS (IARC-JAXA Information System) AMSR-E ice site. They have data only for 2003-2009. YEAR NSIDC IJIS delta 2003 6.15 6.13 +0.02 2004 6.05 5.96 +0.09 2005 5.57 5.53 +0.04 2006 5.92 5.91 +0.01 2007 4.30 4.38 -0.08 2008 4.68 4.84 -0.16 2009 5.36 5.38 -0.02 Looks like the difference between the two datasets is not random, NSIDC trying to emphasize the decline. Insight, anyone? BTW, both datasets lack error estimates, which is preposterous. -
Tony O at 00:37 AM on 19 March 2010A peer-reviewed response to McLean's El Nino paper
Is this the paper that Tamino pulled apart a while ago? If memory serves the technique they used removes the trend they then analysed the detrended data and concluded there is no trend. Or is that what you were saying? -
RSVP at 00:14 AM on 19 March 2010The 5 characteristics of scientific denialism
"Jacob Bock Axelsen at 22:26 PM on 18 March, 2010 #79 classic argument. The total waste heat forcing from burning coal is roughly 0.006 W/m2. Greenhouse gases traps heat from the Sun and is currently roughly 4 W/m2. There is no comparison." No comparison, why not? Not sure what exactly your numbers represent, however I can use these values to illustrate my point. (0.006 / 4 ) x 100 degrees = .15 degrees. If your number 4 were to represent the heat to make the Earth 100 degrees warmer (poor GHG situation as on Mars), than .006 contribute .15 degrees. In reality we should be dividing only by the amount of energy that is emitted by IR, which is some fraction of 4 making the result higher. And fossil fuels are not the only contributor, so now we are talking about a result in the order of what is currently observed, which is about half a degree. -
HumanityRules at 23:58 PM on 18 March 2010A peer-reviewed response to McLean's El Nino paper
Do you know if McLean got a right to reply on this comment? I can't find the comment on the AGU website. -
Dennis at 23:45 PM on 18 March 2010The 5 characteristics of scientific denialism
True North @62: The objection to the use of the word "denier" has become something of a cause celebre among a few scientists and many non-scientists who think they know more than the vast majority of climate scientists. The term is not used because of any association with holocaust deniers. It is aimed at this group because they have a habit of reflexively denying everything --EVERYTHING-- that gets printed in scientific journals that goes against their pre-conceived notions on climate science. Thats a LOT of valid scientific research. Nine times out of ten they don't even read it first. That's not skepticism, it's denial. Rather than write "hey, that's an interesting finding, let's look at it a little deeper and go with it," they say "It's wrong, the guy writing this does not know the first thing about climate science." It's reached the point where we (the public) get led down a nasty path of having to read conspiracy theories about these scientists' emails. That is denying something -- not being skeptical about it. When this chorus stops instantly slamming the research of the vast majority of climate scientists and instead say "I have read Dr. so-an-so's paper and have a couple of question," then they'll be skeptics instead of deniers. If they continue to be silent when published science is misrepresented and allow their words to be fuel for the anti-science crowd, they will keep being called deniers. Pick a better word if you wish, but skeptic does not describe what this group is doing. -
Berényi Péter at 23:43 PM on 18 March 2010The 5 characteristics of scientific denialism
#78 tobyjoyce at 18:17 PM on 18 March, 2010 "the strongest strand in denialism is free market ideology/ libertarianism" OK, let's delve into politics. The problem of externalities lies at the core of it. Some government intervention to economic processes is inevitable. Unrestricted "free" competition tends to raise external costs with no bound. At least criminal law (and law enforcement) should be in place to prevent cases like the ENRON scandal or Madoff scheme to occur on daily bases. With no proper laws and enforcement power to back it something like Somali pirate economy develops, rule of war lords instead of rule of law. Libertarians would not be happy with such a system. But even within the boundaries of legal business there is plenty of room to externalize costs. Environment is one of the easiest preys. The reason for it is in flawed accounting rules. Environmental goods given by God are not accounted for. As there was no production cost associated with them, they have zero value according to the books. Destroying something with zero value has no effect on GNP. No wonder protecting the environment against powerful economic drives is futile. Environment does not need protection. It needs rational management based on sound economic principles. However, the present system of accounting is not able to support this kind of decision making. A slight modification of accounting rules is needed to get closer to that end. A price tag should be attached to environmental goods not related to their production costs, but reproduction costs. Both Rhine and the river Thames were polluted lifeless by the industrial revolution. Now they are on their way to recovery. Heavy capital investment was needed to decrease pollution substantially and we do know pretty well how much. If they were evaluated in advance according to the reprocuction cost of clear water, rational water management could have come much earlier. If reproduction costs of a livable environment in China are taken into account, the prodigious 10%+ economic growth of the last several decades turns out to be closer to 1%. In other words, the Peoples Republic took a loan from its local environment on an unknown interest rate to finance growth. This loan should be payed back sooner or later, else death rate would increase to a point of no return. Now. Proper accounting is just the first step to rational environment management. It makes possible to replace environmental abuse penalties by fair environmental usage fees. The fees are calculated to supply reproduction costs, nothing else. That is, environmental amortisation should be balanced by an equal flow of environmental investment. However, not all native environmental features are desirable. There is no huge demand for malaria infested swamps, for example. To decide what direction environmental development should take is a public policy issue. If no one is willing to pay the reproduction costs of a feature, it does not have economic value so a zero price tag should be attached to it. Science only comes into play at this stage. Sometimes it can tell something about hidden connections between various features of the environment. Even if there is no demand for a feature (like low CO2 on its own right), there might be other features connected to to it (like sea level), that have immediate economic consequences. I am not implying the existence of this particular connection (or the lack of it), just illustrating the proper place of science in the grand scheme. What I am trying to say is that the confusion goes much deeper than the connection between public policy decisions and science. One of the faces of it is "globalization". Which is a misnomer itself. There is nothing wrong with interconncted ("global") systems per se. It is the type of network that matters. For large (complex) systems it should be recursively modular in order to be manageable. Otherwise control costs grow much faster than the effective size of the system, finally consuming all of its resources and more. The problem is the demodularization process (called globalization by some) has gone too far. In a properly designed system traffic between individual modules goes through standard interfaces and is controlled by standard protocols. It used to be that way, but during the last several decades almost all module walls were made uncontrollably permeable (by free trade agreements, see WTO). Just imagine the Internet (a global and modular system) with filter lists, firewalls & the like banned by treaties. Legitimate traffic would dwindle, worms, viruses, trojans, adware prevail. (Decline and Fall of the Roman Empire was a demodularization process itself, with dire consequences) Current ("modern" or "western") civilization is based on three incompatible, but equally vital principles. One of them is the scientific method. The other two are free enterprise and constitutional government (with free speech, due process, rule of law, general elections and such). I would prefere not to elaborate on their incompatibility here, I take it granted. Inconsistency can only be handled by modularization. In the current context it means science has to keep as much distance from both business and politics as possible (e.g. press releases on research should be banned immediately). Let businessmen and politicians beg for advice if and when they choose to do so, never try to push them. Rush for profit or political passion are equally repulsive traits in a scientific discourse. -
Jacob Bock Axelsen at 22:26 PM on 18 March 2010The 5 characteristics of scientific denialism
#79 classic argument. The total waste heat forcing from burning coal is roughly 0.006 W/m2. Greenhouse gases traps heat from the Sun and is currently roughly 4 W/m2. There is no comparison. -
bvangerven at 22:20 PM on 18 March 2010The 5 characteristics of scientific denialism
True North (#62) - As a skeptic, would you like to be in the same league as people who claim that the earth is 6000 years old, or that we needn’t worry about climate change since God will not allow humankind to destroy the planet ? I would expect that sincere climate skeptics WELCOME the idea of making the distinction between true skeptics (who are willing to investigate all available facts) and climate deniers (who deliberately close their eyes for unwelcome facts). -
Peter Hogarth at 22:07 PM on 18 March 2010Watts Up With That's continued ignorance regarding Antarctic sea ice
Berényi Péter at 22:55 PM on 17 March, 2010 (and Sidd) Don’t forget that over most of the oceans the upper layers are reported as warming too (I will try to find some nice graphics on the temperature profiles in Southern Oceans, the numbers on graphics I have are too unreadable when fitted to 450 pixel images) eg Weddell Sea measurements, so I guess there is no need to invoke extra mixing processes. The freshening is believed to be due to extra ice melt run-off, which makes sense if you accept the reported mass loss from Antarctica, and loss of ice shelves in SH summer. From Kuhlbrodt 2007 “During the winter in the Southern Hemisphere, large amounts of sea ice are formed around Antarctica. Because of the rejection of brine they leave behind dense water masses near the surface. Large ice-free patches in the sea ice cover, called polynyas, play a central role in this process also because of strong heat loss. The buoyancy loss makes the waters sink to the bottom of the continental shelf. If the amount is large enough, it reaches the shelf break and flows down the continental slope. During this process its volume is increased significantly by entrainment of less dense waters, and bottom water is formed”. Also please appreciate that we are talking about small (but measurable) oceanic temperature changes, but in the huge oceanic volumes this represents huge changes in total heat content. Arkadiusz Semczyszak at 21:28 PM on 17 March, 2010 I can agree that we should not judge just by Southern Oceanic (or any regional) conditions in isolation, but the observations form more interlocking and corroborating pieces of the overall puzzle. As your final quote is from Rahmstorf 2006 let me quote Rahmstorf 2008 in the aptly titled “Anthropogenic Climate Change: Revisiting the Facts” “Ocean heat uptake (“thermal inertia”) leads to a time lag of the actual warming behind equilibrium warming. Ocean heat uptake is not just a theoretical or modeled phenomenon, but a measured fact. Data from about 1 million ocean temperature profiles show that the ocean has been taking up heat at a rate of 0.6 W/m2 (averaged over the full surface of the Earth) for the period 1993–2003” This is not cherry picking. This is the mainstream view of the Oceanographic community, though it is true that more deep ocean observations are needed, and this is covered in Garzoli 2009 “Progressing towards global sustained deep ocean observations”. Further independent evidence for global warming throughout the Oceanic volume (as well as the most recent direct measurement updates which attempt to correct for recently quantified bias and errors, covered here includingLevitus 2009, and Von Schuckmann 2009) comes from the steric component of sea level rise, covered here. Yet more independent evidence comes from decades of trans-oceanic acoustic transmission tests, as the average transit times depend on sound speed affected most significantly by average temperature across the transmission channel (I’ll get more on this, but Dushaw 2009 “A decade of acoustic thermometry in the North Pacific Ocean” gives some idea). As to thermohaline circulation (THC) and meridional oceanic circulation (MOC), and Oceanic (or atmospheric) currents in general, they re-distribute energy. In “On the driving processes of the Atlantic Meridional Overturning Circulation” Kuhlbrodt 2007, the main drivers for oceanic currents are given as: a) Surface winds transferring momentum. The winds are driven by temp differences, again re-distribution of energy. b) Tidal forces, believed to be a major factor in mixing. c) Thermohaline forcing, flow due to density differences So although currents may play a role in regional warming (for example) ice sheets in Greenland Hannah 2009 this should be thought of as re-distributing an increasing amount of thermal energy within the global system, as in Cunningham 2009 “The present and future system for measuring the Atlantic Meridional Overturning Circulation and heat transport” where it is estimated that the Atlantic Ocean circulation redistributes up to 25% of the global combined atmosphere-ocean heat flux. There is consensus that these are complicated processes, but the science and observations have been considerably added to, certainly since Seidov 2000. There are still questions of course! See Johnson 2008, “Reduced Antarctic meridional overturning circulation reaches the North Atlantic Ocean” Hofmann 2009 “On the stability of the Atlantic meridional overturning circulation”, Kuhlbrodt 2009 , “An Integrated Assessment of changes in the thermohaline circulation”. These show work is ongoing in further reducing uncertainties about transference of energy and possible future regional effects within the climate system, but they do not impact the conclusions about overall global net gain of energy. -
Steve Greaves at 22:03 PM on 18 March 2010What the IPCC and peer-reviewed science say about Amazonian forests
This recent research is being quoted on a few skeptic blogs as further evidence of sloppy work by the IPCC A recent study that seems to indicate that the rain forest is resistant to short term drought -
fydijkstra at 21:12 PM on 18 March 2010The 5 characteristics of scientific denialism
Frans Dijkstra This is not a very sympathetic post. It seems that you would like to call climate sceptics deniers, but climate scepticism is not denialism. It is science. It has nothing to do with believing in conspiracy theories, it does not use fake experts, nor does it cherry pick selective papers, etc. etc. Climate scepticism is about observations in the real world. It is about not having blind faith in computer modelling, about not ignoring other climate driving factors. Scientific scepticism is – in short – the only way of searching the truth. The same characteristics as you use to describe climate denialism can be applied to climate alarmism: conspiracy theories (oil companies supporting scepticism), fake experts (the thousands of ‘experts’ of IPCC, many of whom are government representatives or lobbyists), cherry picking (hockey sticks and much more), impossible expectations (climate models predicting thousands of years into the future) and logical fallacies (the pipeline myth and more). It is even more interesting to compare climate alarmism to sectarianism. There is no consensus about the exact characteristics of a sect, but articles about sect and sectarianism in Wikipedia reveal the following general characteristics: 1. Absolute belief in a sub-truth 2. Group formation 3. Seclusion for contrary information 4. Intolerance 5. Great charismatic Leaders It is not too difficult to recognize these characteristics in the messages of Al Gore, IPCC, and alarmist mass media. -
Jacob Bock Axelsen at 20:50 PM on 18 March 2010A peer-reviewed response to McLean's El Nino paper
It seems to be a rather trivial result. SOI=sin(t+lag) GTTA=sin(t)+a*t+b dSOI/dt=cos(t+lag) dGTTA/dt=cos(t)+a Phase-shift dSOI/dt by its lag, dSOI'/dt = cos(t), and plot the two series on the same plot. The independent warming trend, a, is 0.01 C/year so the displacement is not discernible when plotted on a scale from -1 to 1 Celcius. By the way, NOAA has explained the variability by resolving onto climate indices. -
RSVP at 20:10 PM on 18 March 2010The 5 characteristics of scientific denialism
John, You missed Characteristic number 6, which is simply having a good counter argument. The problem however is that no matter how good the argument, the so called non-deniers cant believe anything but the same old, same old. In past posts you used the expression, "you cant have it both ways". Please explain how, while on the one hand, green house gases are so efficient in trapping heat, on the other, all the exothermic waste heat from industry is not having any effect? Who is having wishful thinking about alternative energy sources not being a problem in their own right? Exothermic waste from burning fossil fuels, cooling of nuclear power plants, heat trapped by urban cement jungles are all producing heat that requires no thermometers or statistics to be noticed. Obviously, due to winds it spread it out, but green house gases are keeping this heat in, and its no coincidence that the global temperature rise is on par with the difference between urban and rural temperatures (i.e., 1 or 2 degrees). You cant have it both ways, attributing the natural warmth of the planet to natural GHG (which I agree acts like a lid on a pot) and then be ignoring the effect this can have on heat sources that are directly measurable. This extra heat is not being trapped by extra CO2. This extra heat is being trapped by ALL green house gases found in nature. Perhaps my idea is unpopular because it means there is no solution to this problem. The good news, however, is that the problem is not as big as that which is being attributed to the effects of CO2. -
johnd at 20:02 PM on 18 March 2010A peer-reviewed response to McLean's El Nino paper
Should we expect correlation between a regional event and a global one. Even for Australia, trying to find correlation between drought years and El-Nino found limited connection, but when the IOD was introduced into the equation only then was some significant and useful correlation found. -
Marcel Bökstedt at 19:53 PM on 18 March 2010A peer-reviewed response to McLean's El Nino paper
Bern> Exactly! This correlation is interesting even if it is only a correlation between heavily filtered curves. It should be turned around, to improve the case for global warming. As you say, the correlation could be used to remove some of the long term variability in the global temperature. It would be interesting to see what the modified record looks like, but it won't be a nice straight line, for the following reasons: In fig 2 of Foster et al. the Fourier transforms of two datasets are compared. One is the global temperature data, the second is the southern oscillation data. We can divide the Fouries transformed picture into three parts: High frequencies (periods shorter than 1 year), middle frequencies (corresponding to 1-6 year cycles) and low frequencies (longer than 6 years). The filter used by McLean et al. more or less removes the high and low frequencies, and the result is a (surprisingly!) high correlation between the two curves. So if we remove the high frequencies from the global temperature record, somehow subtract the SOI influence from it - which seem to more or less remove the middle frequencies - we still have the discrepency in the low frequencies. Eyeballing fig 2 seems to suggest that actually the two datasets differ a lot in the low part of the frequency spectrum. So it seems that after removing low frequencies and the SOI influence, we will still have "unexplained cycles" left with periods in the range of like 6 years and up. -
GFW at 19:36 PM on 18 March 2010A peer-reviewed response to McLean's El Nino paper
John, you've included Figure 5 from Foster et. al. when you meant to include Figure 4. Fig 4 is the artificial data with the linear trend. Fig 5 uses a sinusoid.Response: Considering the multitude of typos (and mistaken graphs) in this article, I'll take this as a cautionary tale to not stay up too late reading peer-reviewed papers or write blog posts in a sleep deprived state the next morning. I've updated the graph with the correct Figure 4 from Foster et al 2010. -
Dikran Marsupial at 19:31 PM on 18 March 2010A peer-reviewed response to McLean's El Nino paper
The "trick" of demonstrating a strong correllation between detrended temperatures and X to argue that X is the cause of the trend in global temperatures seems a common argument on the "skeptic" side. Of course if it really were the cause, then the correllation would be stronger with the raw data than with the detrended data! Spencer did that on WUWT to argue that ENSO is responsible for the rise in atmospheric CO2, Svensmark has used that argument to show that the rise in temperatures is due to GCR. Rather dissapointing to see it in a peer reviewed article rather than a blog or an unpublished response, as the flaw in the argument is so obvious. -
tobyjoyce at 18:17 PM on 18 March 2010The 5 characteristics of scientific denialism
I have found that the strongest strand in denialism is free market ideology/ libertarianism. This political belief rejects instinctively the collective action required to respond to climate change. Collective action necessitates a degree of state regulation and control. Anything that bestows more power on the state is anathema to hard right free marketeers. There may also, of course, be others on the left who agree with that for different reasons. For many deniers, the politics clearly controls their scientific viewpoint. From what I have seen on this site, there are sceptics who are not deniers. The boundary seems to be set by whether you accept AGW as a working hypothesis or not. There are sceptics "inside the tent" and sceptics "outside the tent". Lyndon B. Johnson was the first President of the USA to issue a warning about AGW. In may be just a coincidence that he also said "Sometimes you have to be either outside the tent p**sing in, or inside the tent p**sing out." -
Berényi Péter at 18:09 PM on 18 March 2010The 5 characteristics of scientific denialism
What can I say? This post is a political one for all intents and purposes, has nothing to do with science as such. It is also getting popular. John, is it worth it to violate your own comments policy?Response: I have noticed a whole bunch of links (or simple copy and pasting of the entire article) at many different websites. To be honest, I find it a little annoying. For once, I stray slightly off the topic of science. Why isn't there as many links to my science based articles? They're just as interesting, more so! However, people seem to be more interested in characterising their opponents than discussing science.
However, the point of this article is not for the purpose of characterising people but to identify particular rhetorical techniques that distract people from the science - it's only by identifying these tactics that the discussion can be redirected back to science. I then give examples of how to bring discussion back to scientific evidence. -
Bern at 17:58 PM on 18 March 2010A peer-reviewed response to McLean's El Nino paper
John B at #5: There are other reasons for opposing carbon trading schemes than a disbelief in AGW - many people question whether they even achieve the goal of reducing CO2 emissions (they certainly make a lot of money for the permit traders, though, money that might better be diverted into actual CO2 emission reduction). But that's a discussion for another day, on an article about how to reduce CO2 (yet another for your to-do list, John? ;-) Re the derivative hiding the long-term trend - I'm obviously not with it today, because it took me a couple of minutes to figure out that, if you have a long-term constant trend, then subtracting sets of points 12 months apart will always give you the same value. The high correlation of the derivative with the SOI, though, means that the SOI can be used to remove the ENSO signal from the temperature chart, and what's left will be due to any long-term trend, volcanic activity, and other forcings. Should make it easier to see the trend, without the distraction of the large dips & bumps caused by ENSO. -
RSVP at 17:29 PM on 18 March 2010The 5 characteristics of scientific denialism
Jeff Freymueller Your reply (74 for now) reveals exactly the ambiguity I am referring to. What exactly do I mean you ask? But why am I the only one who has to clarify "exactly" what I mean? Why dont climate scientists? Behind AGW is this idea that temperatures are increasing at least around .1 or .2 degrees per decade and will continue to do so mainly as a function of CO2 concentration levels. With exception to the methane gas issue in Siberia, climate scientist will tell you that this is not a run-away situation, however I have yet to see anything saying that the trend will flatten out or is self limiting. On the contrary, with the existing messaging you are left with the sense that once the polar caps all melt away its anyone's guess as to what will occur, etc. Yet with all those scientific resources, computer models, etc., why dont they come out, take the next step, and finish the story? I think what I said was very clear too. That things have warmed some yes, but they will not be warming much more. I did not explain why, but if you will, it is very simple. Anthropogenic warming is due to exothermic chemistry, and directly in proportion to its volume. The real deniers are those who wish to ignore this reality along with other basic laws of thermodynamics. -
dansat at 16:43 PM on 18 March 2010A peer-reviewed response to McLean's El Nino paper
Excellent post and an even greater example of how peer review and science is auto correcting. SLRTX hits the nail on the head. This seems to be a rather embarrassing mistake to me. Not just by the reviewers, but much more so by the authors. Am I mistaken?? Dan -
Jeff Freymueller at 16:37 PM on 18 March 2010The 5 characteristics of scientific denialism
#61 David Horton, I have a different take, maybe hanging out with a different set of geoscientists. I think your comments ring pretty true when you are talking about resource geologists -- oil and gas, and mining, although its certainly not true of all even in that sector. I don't think it holds true at all once you move outside of the resources sector. Your guess that self-interest plays a role in this seems likely to me. -
Marcus at 16:34 PM on 18 March 2010A peer-reviewed response to McLean's El Nino paper
You're dead right Albatross. Look at that nice orange line for 2010, very clearly above anything for the last 12 years.
Prev 2434 2435 2436 2437 2438 2439 2440 2441 2442 2443 2444 2445 2446 2447 2448 2449 Next


