


 Arguments


Recent Comments
Prev 242 243 244 245 246 247 248 249 250 251 252 253 254 255 256 257 Next
Comments 12451 to 12500:
-
barry1487 at 14:47 PM on 26 December 20182018 was the hottest La Niña year ever recorded
The choice of Nina metrics seems a little arbitrary. Make different choices and 2017 is the warmest la Nina year.
http://origin.cpc.ncep.noaa.gov/products/analysis_monitoring/ensostuff/ONI_v5.php
Substantively, the point hardly alters, but the messaging is a little less compelling...
-
scaddenp at 12:34 PM on 26 December 2018Freedom of Information (FOI) requests were ignored
And for contrast, deniers favourite temperature series is UAH. They are not reknowned for providing quick access to their code - does anyone know if code for latest version is available yet?
Do note that scientists in all fields tend to hold tight to raw data till they have had a chance to publish it properly. I think this may have been source of accusations over paleo proxies some time in the distant past.
-
AFT17170 at 10:49 AM on 26 December 2018Freedom of Information (FOI) requests were ignored
Er, wow. Thanks Daniel, especially for giving such a reply on Christmas Day.
-
Daniel Bailey at 09:53 AM on 26 December 2018Freedom of Information (FOI) requests were ignored
Note that the Muir Russell Commission was able to do a full global reconstruction from the raw data linked to from the above page, without any code, in a mere 2 days (when asked, they replied "any competent researcher" could have done the same).
The Auditors over at McIntyre's Climate Audit have been struggling with their "audit" reconstruction for many years now.
The "any competent researcher" bit comes from here:
"key data was freely available and could be used by any "competent" researcher"...They used data from public databanks and wrote their own computer code, which they say could be repeated by any "competent researcher". The results were similar to those of the CRU."
And
The "2 days" bit comes from here:
The report itself is here.
-
Daniel Bailey at 09:45 AM on 26 December 2018Freedom of Information (FOI) requests were ignored
Actually, pretty much all of the data (raw or otherwise) and model code is openly available.
The raw data:
ftp://ftp.ncdc.noaa.gov/pub/data/ghcn/v2
ftp://ftp.ncdc.noaa.gov/pub/data/ushcn/
ftp://ftp.ncdc.noaa.gov/pub/data/ushcn/v2/monthly/
http://dss.ucar.edu/datasets/ds570.0/
http://www.antarctica.ac.uk/met/READER
http://eca.knmi.nl/
http://www.zamg.ac.at/histalp/content/view/35/1
http://amsu.cira.colostate.edu/
Link to SORCE
http://daac.gsfc.nasa.gov/atdd
http://oceancolor.gsfc.nasa.gov/
http://www.psmsl.org/
http://wgms.ch/
http://www.argo.net/
http://icoads.noaa.gov/
http://aeronet.gsfc.nasa.gov/
http://aoncadis.ucar.edu/home.htm
http://climexp.knmi.nl/start.cgi?someone@somewhere
http://dapper.pmel.noaa.gov/dchart/
http://ingrid.ldgo.columbia.edu/
http://daac.gsfc.nasa.gov/giovanni/
http://www.pacificclimate.org/tools/select
http://gcmd.nasa.gov/
http://www.clivar.org/data/global.php
http://www.ncdc.noaa.gov/oa/ncdc.html
http://www.ipcc-data.org/maps/
http://climatedataguide.ucar.edu/
http://cdiac.ornl.gov/
http://www.cru.uea.ac.uk/cru/data/
http://www.hadobs.org/Next, the processed data:
http://data.giss.nasa.gov/gistemp
http://clearclimatecode.org/
http://hadobs.metoffice.com/hadcrut4/index.html
http://www.ncdc.noaa.gov/cmb-faq/anomalies.php#anomalies
http://ds.data.jma.go.jp/tcc/tcc/products/gwp/temp/ann_wld.html
http://www.berkeleyearth.org/
http://vortex.nsstc.uah.edu/data/msu/
http://www.ssmi.com/msu/msu_data_description.html
http://www.star.nesdis.noaa.gov/smcd/emb/mscat/mscatmain.htm
ftp://eclipse.ncdc.noaa.gov/pub/OI-daily-v2/
http://www.cpc.noaa.gov/products/stratosphere/temperature/
http://arctic.atmos.uiuc.edu/cryosphere/
http://nsidc.org/data/seaice_index/
http://www.ijis.iarc.uaf.edu/en/home/seaice_extent.htm
https://seaice.uni-bremen.de/sea-ice-concentration/
http://arctic-roos.org/
http://ocean.dmi.dk/arctic/icecover.uk.php
http://www.univie.ac.at/theoret-met/research/raobcore/
http://hadobs.metoffice.com/hadat/
http://weather.uwyo.edu/upperair/sounding.html
http://www.ncdc.noaa.gov/oa/climate/ratpac/
http://www.ccrc.unsw.edu.au/staff/profiles/sherwood/radproj/index.html
http://cdiac.ornl.gov/trends/temp/sterin/sterin.html
http://cdiac.ornl.gov/trends/temp/angell/angell.html
http://isccp.giss.nasa.gov/products/onlineData.html
http://eosweb.larc.nasa.gov/project/ceres/table_ceres.html
http://sealevel.colorado.edu/
http://ibis.grdl.noaa.gov/SAT/SeaLevelRise/index.php
http://dataipsl.ipsl.jussieu.fr/AEROCOM/
http://gacp.giss.nasa.gov/
http://www.esrl.noaa.gov/gmd/aggi/
http://www.esrl.noaa.gov/gmd/ccgg/trends/
http://gaw.kishou.go.jp/wdcgg/
http://airs.jpl.nasa.gov/AIRS_CO2_Data/
http://www.usap-data.org/entry/NSF-ANT04-40414/2009-09-12_11-10-10/
http://climate.rutgers.edu/snowcover/index.php
http://glims.colorado.edu/glacierdata/
http://www.nodc.noaa.gov/OC5/3M_HEAT_CONTENT/
http://oceans.pmel.noaa.gov/
http://cdiac.ornl.gov/oceans/
http://gosic.org/ios/MATRICES/ECV/ecv-matrix.htm
http://www.ncdc.noaa.gov/bams-state-of-the-climate/2009-time-series/Now, the model code:
http://www.giss.nasa.gov/tools/modelE/
ftp://ftp.giss.nasa.gov/pub/modelE/
http://simplex.giss.nasa.gov/snapshots/
http://www.cesm.ucar.edu/models/
http://www.ccsm.ucar.edu/
http://www.ccsm.ucar.edu/models/ccsm3.0/
http://www.cgd.ucar.edu/cms/ccm3/source.shtml
http://edgcm.columbia.edu/
http://www.mi.uni-hamburg.de/Projekte.209.0.html?&L=3
http://www.mi.uni-hamburg.de/SAM.6074.0.html?&L=3
http://www.mi.uni-hamburg.de/PUMA.215.0.html?&L=3
http://www.mi.uni-hamburg.de/Planet-Simul.216.0.html?&L=3
http://www.nemo-ocean.eu/
http://www.gfdl.noaa.gov/fms
http://mitgcm.org/
https://github.com/E3SM-Project
http://rtweb.aer.com/rrtm_frame.html
http://www.sciencemag.org/cgi/content/full/317/5846/1866d/DC1
http://www.pnas.org/content/suppl/2009/12/07/0907765106.DCSupplemental
http://geoflop.uchicago.edu/forecast/docs/Projects/modtran.html
http://geoflop.uchicago.edu/forecast/docs/models.html
http://www.fnu.zmaw.de/FUND.5679.0.html
http://www.pbl.nl/en/themasites/fair/index.html
http://nordhaus.econ.yale.edu/DICE2007.htm
http://nordhaus.econ.yale.edu/RICEModelDiscussionasofSeptember30.htm
https://github.com/rodrigo-caballero/CliMT
http://climdyn.misu.su.se/climt/
http://starship.python.net/crew/jsaenz/pyclimate/
http://www-pcmdi.llnl.gov/software-portal/cdat
http://www.gps.caltech.edu/~tapio/imputation
http://holocene.meteo.psu.edu/Mann/tools/MTM-SVD/
http://www.atmos.ucla.edu/tcd/ssa/
http://holocene.meteo.psu.edu/Mann/tools/MTM-RED/
http://www.cgd.ucar.edu/cas/wigley/magicc/Source code for GISTEMP is here:
https://data.giss.nasa.gov/gistemp/sources_v3/
https://data.giss.nasa.gov/gistemp/news/
https://data.giss.nasa.gov/gistemp/faq/
https://data.giss.nasa.gov/gistemp/
https://simplex.giss.nasa.gov/snapshots/Related links:
https://data.giss.nasa.gov/gistemp/faq/
https://data.giss.nasa.gov/gistemp/faq/#q209
https://podaac.jpl.nasa.gov/
https://daac.gsfc.nasa.gov/
https://earthdata.nasa.gov/about/daacs
http://www.wmo.int/pages/prog/wcp/wcdmp/index_en.php
http://berkeleyearth.org/summary-of-findings/
http://berkeleyearth.org/faq/
https://www.climate.gov/news-features/understanding-climate/climate-change-global-temperature
https://www.climate.gov/maps-data/primer/climate-data-primer
https://www.ncdc.noaa.gov/monitoring-references/faq/anomalies.php
https://www.ncdc.noaa.gov/ghcnm/v3.php?section=quality_assurance
https://www.ncdc.noaa.gov/ghcnm/v3.php?section=homogeneity_adjustment
https://www.ncdc.noaa.gov/crn/
https://www.ncdc.noaa.gov/crn/measurements.html
https://agupubs.onlinelibrary.wiley.com/doi/full/10.1029/2009JD013094
https://agupubs.onlinelibrary.wiley.com/doi/full/10.1029/2011JD016761
https://agupubs.onlinelibrary.wiley.com/doi/full/10.1002/2015GL067640
https://www.clim-past.net/8/89/2012/
https://www.carbonbrief.org/explainer-how-data-adjustments-affect-global-temperature-recordsGlobal surface temperature records use station temperature data for long-term climate studies. For station data to be useful for these studies, it is essential that measurements are consistent in where, how and when they were taken. Jumps unrelated to temperature, introduced by station moves or equipment updates, need to be eliminated. The current procedure also applies an automated system that uses systematic comparisons with neighboring stations to deal with artificial changes, which ensures that the Urban Heat Island effect is not influencing the temperature trends. In the same fashion that a chef turns raw ingredients into a fine meal, scientists turn raw data into a highly accurate and reliable long-term temperature record.
Although adjustments to land temperature data do have larger consequences in certain regions, such as in the United States and Africa, these tend to average out in the global land surface record.
-
Evan at 09:38 AM on 26 December 20182018 was the hottest La Niña year ever recorded
Using 1970 as the year when the temperature anomaly emerged from the background noise as the starting point, plot the maximum atmospheric temperature for each decade (which is often the temperature of El Nino years), fit a line to it, and it parallels the line derived from fitting all of the atmospheric temperature data. Has there ever really been a slowdown if we look at the data over a long enough time period? The following plots merely shows that during large El Nino years that the temperature is about 0.2C higher than the long-term trend.
 Moderator Response:
[DB] Reduced image width
-
Philippe Chantreau at 08:27 AM on 26 December 2018Climate scientists are in it for the money
AFT, these claims are popular among people sharing a certain ideology. They amount to slightly more than conspiracy theory but not much, and they do not hold up to scrutiny. Virtually nobody arguing that way ever spends the time and effort necessary to determine how much reality underlies these claims.
1) A large amount of research comes from NASA, and it continues to point in the same direction. Another body of research is from the military, i.e. Navy and Air Force. It shows the same as the rest of the evidence, some of it was very early on. Repeated attempts at silencing scientists or suppressing their work have been reported during the Bush administration, it has reached rdiculous proportions under Trump, so the problem is actually the other way around: anti AGW (whatever that may mean) actors actively try to silence researchers and do not fund research because they know that it will show the opposite of what they want to see. The BEST project was a shining example, look it up. Exxon did fund research and it showed the same thing as the research from other sources (see appropriate thread); it is not very surprising that they stopped funding it now, is it? Why would these actors continue to fund research that they know will show exactly the opposite of what their financial interests demand? How much have they actually funded, then suppressed, because it did not serve their interests?
2) The only way to get funding should be to propose quality research that advances knowledge. That is the case for the vast majority of it. Denial motivated research in virtually all the publicized cases ends up of such poor quality that it generates questions on the review process that allowed it through. Multiple cases have been shown to be the results of intentional, organized peer-review hijacking, or the publicity was owed to gross misrepresentation of results, or press releases advertised conclusions that were not supported by the paper. A while ago, it was the infamous Soon-Baliunas, Legates, and a few others are there for your examination. The stream has dried up somewhat lately. Prominent denial voices (Spencer) still can not come up with research that truly supports their publicly voiced opinions.
3) Exactly why would that be? Reviewers are often anonymous, what interest do they have to allow poor quality papers? Scientists tend to try to undermine each other's work far more than people realize. There is seldom better satisfaction than proving a competitor wrong.
These arguments are neve accompanied by specifics. They simply don't hold up. Those who want to be convinced by them simply assume that they are true because it make sense to them, flatters their already held beliefs, and they never bother digging or just exploring the logic of it, as for the first argument. The real problem is this: nobody has a real financial incentive in climate science being correct, including scientists themselves. The effort that societies will have to produce to deal with it, whether they try to mitigate, remediate, or any combination will be enormous. Ask any any climate scientist if they wish climate science was wrong and see what their answer are.
-
nigelj at 07:47 AM on 26 December 20182018 SkS Weekly Climate Change & Global Warming Digest #51
Evan @10, agreed. I also think people look at impacts of climate change such as general warming, and impacts on crops and think it will be slow and we will adapt and genetic engineering will 'solve it' for example. Firstly they underestimate the costs of even slow adaptation, and the slowness lulls people into a false sense of security, because some elements of climate change wont be slow, and it only takes one rapid element of change to be a huge problem. As you say it's important to focus on the possibility we could see short periods of rapid sea level rise of a foot or more a decade interspersed with more sluggish periods.
Its speed of transitions like this that would be very difficult to adapt to. Buildings are designed to last about 100 years, so its possible to design for a world with a known quantity of sea level rise over multi centuries, by hopping inland in an orderly way. Costly, but manageable. But theres a possibility of erratic spurts of sea level rise of several metres per century or less and it's impossible to plan for this, and infrastructure will have to be abandoned before its use by date, over and over again.
I think the IPCC do a good job of discussing the risks, possibly they are on the conservative side a bit but overall its good. What I think might have gone wrong is how the mainstream media interpret and communicate the issues. The focus seems to swing from the usual risks of more storms, reduced agricultual issues, multi century sea level rise, and general warming on the one hand, and more scaremongering claims that are stated in such general ways as to be useless and easily refuted. They miss the key problems and more specific quantifiable problems of a world of 5 - 10 degrees having inolerable heatwaves, the possibility of short periods of rapid sea level rise,and so on. Some media have covered this, but not enough.
-
nigelj at 05:32 AM on 26 December 20182018 was the hottest La Niña year ever recorded
We had the slowdown in warming (such as it was, not very much) from about 1998 - 2014, then temperatures jumped from 2015 - 2016, and remain quite high even during a la nina. It looks like temperatures may be resetting at a permanently higher level. Speculation of course, but perhaps this is a sign of things to come, a very "step like" progression of warming, perhaps due to something to do with how ocean processes work.
-
AFT17170 at 03:15 AM on 26 December 2018It's the sun
Oops, I withdraw my last question.
-
AFT17170 at 03:14 AM on 26 December 2018It's the sun
Hello. I notice that the last post on this topic was ~6.5 years ago. Figure 1 in the overview is very helpful to a lay person newbie like me. Are there any updates from the last few years? Thanks in advance.
-
AFT17170 at 02:42 AM on 26 December 2018Freedom of Information (FOI) requests were ignored
Hello. I don't know if this belongs in another thread, but I wanted to follow-up on the "skeptics'" line of attack that "climate researchers hide all their work and just expect us to believe it". The above posts were helpful in explaining why some data should not be released to the public. But none of the comments addressed opening up the code itself to scrutiny? Are there valid reasons why these would be held under wraps (which I perceive, perhaps incorrectly) was done by CRU? Are climate models generally "open" or "held secret"? Thanks in advance for any forthcoming replies.
-
michael sweet at 02:06 AM on 26 December 2018Australia - Moving to Renewable Energy
Riduna,
It is my experience that cracked solar panels continue to generate electricity. I know several people who had cracked panels on home systems (say a hammer fell on them) who continued to use them for several years. They did not see a large drop in electricity generated.
I would expect that utility solar farms would have to replace cracked panels after a hail storm but that they would not be out of service completely during the time it took to replace the panels. Since panels can be replaced in small sections the power of a large facility is only slightly reduced by replacing panels in one block. As compared to a fossil plant which has to shut down for maintenance.
I do not see as big a problem with end of lifetime disposal of solar panels as you do. I have a sailboat that is powered by two panels that are at least 25 years old. They still produce close to their rated power. They are not as efficient as new panels and take up more space.
I would expect that 25 year old panels would be replaced by more efficient panels. The old panels can then be sold at a discount to developing nations as cheap solar power. This has already been done with wind turbines in Europe where old turbines are replaced with new technology and the old turbines are refurbished and sold.
Even if they have to be recycled, most of the panel is aluminum and glass which can be recycled. There is not currently a big market to recycle panels as a lot continue in use as described above.
-
AFT17170 at 01:09 AM on 26 December 2018Climate scientists are in it for the money
Hello, this is my first post, as I just discovered this site. Great work, thanks.
I frequent some online investor fora where I encounter a lot of right wingers (some of the extreme fringe). Their mainline attack on climate scientists is more sophisticated (and fundamental) than "they're in it for the money" (as in, to get "rich"). The general lines of attack go more like "the groupthink in the climate science community is such that: 1) only pro AGW theory proponents will even fund climate research, 2) the only way to get any funding (whether it makes you "rich" or not) is to be an AGW theory proponent, and 3) of course the peer reviewers are going to support anything that bolsters the AGW theory and attack anything that doesn't.
-
Riduna at 16:01 PM on 25 December 2018Australia - Moving to Renewable Energy
A feature of the Pipeline is the dominance of solar farms comprising 82 projects, or 66% of its 125 projects.
A feature of climate change in Australia is the growing frequency and severity of hail storms. This gives rise to concern about the vulnerability of the millions of photovoltaic panels which will make up these solar farms, particularly when recent reports are of hailstones the size of golf balls.
Can solar farm design ernsure that in the event of some damage to panels, ability to generate electricity is maintained?
-
Evan at 07:18 AM on 25 December 20182018 SkS Weekly Climate Change & Global Warming Digest #51
nigelj@9 Agree with your assessment.
There is another aspect that I think is being overlooked. I think that the big guns like Richard Alley and Eric Rignot and others expect that we will trigger major sea level rise within the next few decades. Some console themselves that sea level rise will happen over millenia, so it is slow and we can manage it. After all, a snail can outrun sea level rise. But, buildings, houses, and roads move slower than snails.
Also, sea level rise will come in spurts, some being a foot or more in a decade, some decades slower. And this will go on for hundreds of years. How do city planners cope with that? Although it may be difficult to convince people that a warming climate will be bad for agriculture, heat, floods, wild fires, stronger storms, etc., I think it is an easy argument to make that a warmer world will bring with it sea level rise that will be very difficult to cope with. That argument alone, and the very long time frame it implies, may be sufficient to bring some of the doubters on board.
It's also possible that I am temporarily afflicted by a case of optimism, but it feels good to find an optimistic argument to try out.
-
nigelj at 05:52 AM on 25 December 20182018 SkS Weekly Climate Change & Global Warming Digest #51
"I just can't figure out the right words to use to get through to people the urgency of this issue."
I feel the same way, but I wonder if its partly because we all all talk so much about 1.5 degrees and climate impacts this century. People don't care about 1.5 degrees, because it sounds harmless, (it isn't, but one can easily understand why they react this way), but if we go on burning fossil fuels, its possible the world could warm about 12 degress celsius by year 2300 according to the IPCC.
12 degrees has a different "feel" to it psychologically and will get peoples attention, and is obviously genuinely catastrophic. It is also not hyperbole and speculation, there is science behind it.
People might say we have plenty of time to do something about that because it seems distant, but deep down they will instinctively know we have to start now and urgently. Passing 1.5 and 2 degree tipping points also helps lock in such a 12 degree scenario.
We have to get the big picture across better.
-
Evan at 05:07 AM on 25 December 20182018 SkS Weekly Climate Change & Global Warming Digest #51
MA Rodger@7 I agree with and note the technical merit of your points. It is not my intention to get into fine points, because I agree technically with what you're saying.
However, the idea that the world will respond in a manner to cause CO2 to naturally start decreasing I see as wishful thinking (no offense meant). I am not trying to be argumentative, just noting that reversing an upward acceleration, first requires we stop the acceleration and just move to a constant increase, which itself is really bad. Then we must decrease from there.
So whereas I agree with the technical points you're making, and whereas I agree that we need to pull out all the stops and communicate as fervently as we can, to me the upward acceleration of the Keeling Curve at a point where 400 ppm is behind us, and when the temperature anomalies are tracking very well at 3C/doubling CO2 with a 30-year offset, personally I am preparing myself for a 2+C world, while working with you and others to try to not make that a reality.
I just can't figure out the right words to use to get through to people the urgency of this issue.
-
MA Rodger at 04:37 AM on 25 December 20182018 SkS Weekly Climate Change & Global Warming Digest #51
Evan @6,
For myself, I do not reckon we are past the point where keeping AGW below +1.5ºC becomes impossible. But we are cutting it mighty fine.
You 'assume' ECS=3ºC but it could be higher. The one saving grace in there still being a possibility of an ECS significantly above 3ºC is that the additional warming resultant from higher ECS appears later, most of the addition a full century after the forcing is applied. So the ECS=3ºC assumption isn't entirely foolhardy in ignoring the possibility of it being higher.
The 400ppm of CO2 gives a little over half the forcing of double CO2. There are of course other significant positive climate forcings as well as negative ones, but for CO2 the atmospheric concentrations will drop once we stop the emissions. The general view has been that once you stop emissions, the falling CO2 forcing would balance with the warming from the remaining un-balanced forcing leaving a roughly constant global temperature, even a cooling. For instance, IPCC FAR projections (graphic annotated here) to 2100 includes 'zero CO2 emissions' and that results in significant cooling. With other GHGs and a pile of negative forcings to handle, that 'cooling' factor would be required - as we nudge upwards and that +1.5ºC of AGW grows ever closer, we need all the help we can get.
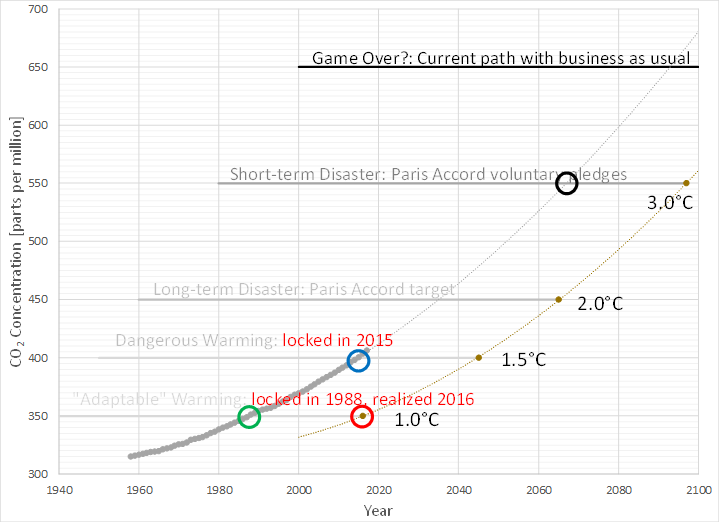
And given Greenland goes into melt-down somewhere between +1ºC and +2ºC, I can imagine the target of staying below +1.5ºC will be replaced by a target of reducing the warming back down to +1ºC or 350ppm CO2.
I would add that I have always given the message that once AGW has become severe enough for building-dwelling people to notice, it will be a little too late to scrap all the gas-guzzling cars and convert the smog-works to run on sunbeams. We do need to act more quickly than that. Happily there are signs of that action beginning.
-
Philippe Chantreau at 04:13 AM on 25 December 2018Breathing contributes to CO2 buildup
Bsettlem, your post makes no sense at all. You're acknowledgeing that total contribution from human respiration with a population of 9 billions would be only 0.5% of just gasoline burning emissions, therefore an even smaller fraction of all fossil fuel CO2. And somehow that makes it a bigger problem than fossil fuel? Indeed CO2's radiative properties are independent of its origins, and of anyone's opinion as well. As you stated yourself, human respiration generated CO2 is a tiny fraction of that coming from other sources, so these other sources, over which we have control, are what matters. You being absolutely sure of anything does not make it real. Some people are absolutely sure that the Earth is flat.
-
Evan at 01:39 AM on 25 December 20182018 SkS Weekly Climate Change & Global Warming Digest #51
MA Roder@5, great points. My view of the current focus on 2030 as the make-or-break date is not that the science really supports that (this is just my view from all that I've read), as much as the point that scientists will never say "We've past the point of no return." CO2 is 410 ppm now, 400 ppm CO2 is the approximate threshold for locking in 1.5C warming if we assume 3C warming/doubling CO2, and yet we're still talking about staying below 1.5 warming. The real problem as I see it is CO2 concentrations accelerating upwards combined with a 30-year delay between cause (CO2 emissions) and effect (warming). The scientists are warning of this, but it is beyond the comprehension of most people to appreciate what this means. In Minnesota people look outside and see weather that feels pretty much the same as it has all their lives. There is no sense of the impending doom that climate scientists are proclaiming. So they tune out.
But I also see no alternative to the path that scientists are charting. Continue warning people, improving out understanding through good science, and trying to help people connect the dots. What else can we do? At some point as Climate Change gets sufficient severe to a sufficient number of people we will begin to win the messaging campaign. Let's hope it's soon enough.
-
MA Rodger at 01:08 AM on 25 December 20182018 SkS Weekly Climate Change & Global Warming Digest #51
There was a second comment from Thomas Thorne that has been disappeared. It did try to provide some evidential basis for the assertions being made @1. It wasn't particularly exact in doing this. There was an alleged "UN in 1989" talking about catastrophe by 2000 and also a reference to Al Gore and catestrophic sea level rise. It seems both these 'predictions' concern SLR. The 1989 UN 'prediction' came from a 'Noel Brown, director of the New York office of the U.N. Environment Program, or UNEP.' Now bear in mind that this is coincidental with Montreal and the threat from CFC-caused AGW was as big as was CO2 back then. Even so, the predicted 1 to 7 degree in 30 years temperature increase (Fahrenheit) has happened. The "by 2000" comment was about SLR - "entire nations could be wiped off the face of the Earth by rising sea levels if the global warming trend is not reversed by the year 2000." They are, of course small low-lying nations and I would ahve thought the warming by 1989 was probably enough to do the job without a further 10-years of AGW.
Myself, I have been bashing on about AGW since 1995. The requirement for CO2 back then was a reduction of 50% by 2050. That has since become 80% and now 100%. The need for action prior to that was always expressed as a need to see CO2 emissions peak by 2020. I don't think that has ever changed. So from my memory the idea that "the IPCC ... have been making these 10-12 year claims for almost 30 years now," is a gross misrepresentation. The IPCC has been tightening the requirement, not the opposite which would have been the case if allowing deadlines to float along, always 10 years in the future.
Moderator Response:[DB] The user ThomasThorne is one of dozens of fake account sock puppets operated by a serial spammer of this venue. Its posting privileges have been rescinded, as will those of all future iterations of this spammer. There is no need to respond to it anymore.
-
Evan at 00:13 AM on 25 December 20182018 SkS Weekly Climate Change & Global Warming Digest #51
Moderator, sorry about the oversized graphs. I copy and pasted the links without realizing they would not be rescaled. My mistake.
-
Evan at 00:11 AM on 25 December 20182018 SkS Weekly Climate Change & Global Warming Digest #51
Perhaps I missed some Thomas.
Take a look at the following plot and tell me that CO2 and temperature rise are not correlated.
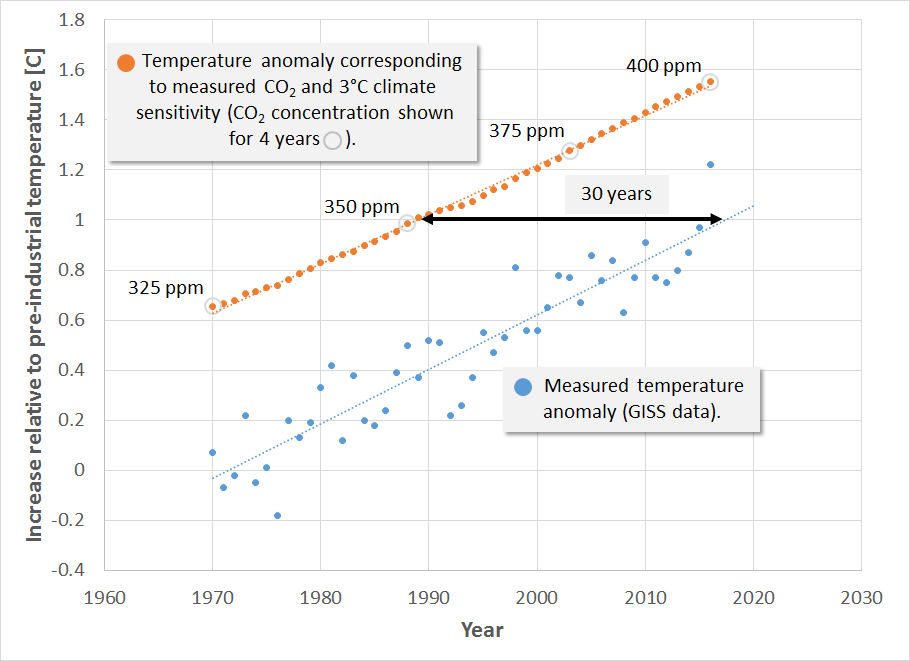
Then take a look at measured CO2 concentrations for the last 60 years and see where they're headed. These two plots show the problem. Ice melts when it gets warm, and just because New York is still above water does not mean it will remain above water. It takes a long time to heat a pot of water the size of the oceans.
 Moderator Response:
[DB] Reduced widths of images and linked to full size versions.
-
michael sweet at 21:37 PM on 24 December 20182018 SkS Weekly Climate Change & Global Warming Digest #51
Thomas Thorne,
I have a strong recollection thinking about the changes from global warming after the IPCC AAR4 was released in 2007. They described many changes that could occur like sea level rise and intensification of storms. At the time I was 49 years old. I remember wondering if I would live long enough to see definitive changes in sea level rise and weather caused by climate change. I thought that if I lived to 85 I might see some effects.
Today I am 60. News reports regularly describe catastrophies caused by climate change. Four record hot years in the past four years, streets regularly flood from sea level rise, record damage from weather, Arctic sea ice has collapsed. Extraordinary rainfall causes floods around the world. Record drought grips Australia. I note that you do not specify a single prediction scientists have incorrectly made. What evidence do you need to become alarmed?
I still have 25 years left before I turn 85. Scientists have been way off in their calculations: they have underestimated the danger. Pray that recent reports of tipping points past that cause the Earth to continue heating regardless of what humans do are incorrect.
We have no choice but to try our hardest to minimize the damage caused by fossil fuels.
-
savantKing at 20:53 PM on 24 December 2018Animal agriculture and eating meat are the biggest causes of global warming
And read this article:
Moderator Response:[DB] Shortened and hyperlinked URL.
-
savantKing at 20:44 PM on 24 December 2018Animal agriculture and eating meat are the biggest causes of global warming
Sorry, but this is not true. Read this:
Global meat industy has a very important role on greenhouse gas.
And if you have this in mind:
one kilo meat cost approximately 15000 litre water. - LINK2
How many meat we eat globally world wide?
read this article:
So please don't say that the meat industry is not responsible for the greenhouse gas that is produced every year.
That fact is that the meat industry is responsible for more then the car industry and the airplane industry together!
Moderator Response:[DB] Your first link does not materially disagree with the OP of this post, and where it does your link cites older sources than does the OP of this post.
Shortened and hyperlinked URLs breaking page formatting. Sloganeering snipped. -
ThomasThorne at 20:29 PM on 24 December 20182018 SkS Weekly Climate Change & Global Warming Digest #51
If the recent report from the Intergovernmental Panel on Climate Change is to be believed, humanity has just over a decade to get carbon emissions under control before catastrophic climate change impacts become unavoidable.
Why should this report be believed? The IPCC and several climate celebrities have been making these 10-12 year claims for almost 30 years now, and none of it has actually come to pass. How many more failed predictions is it going to take before the climate change community starts to rethink just who the climate experts really are?
Moderator Response:[DB] A note to readership:
This user is just one of dozens of fake accounts operated by a serial spammer of this venue. This sock puppet account has been disabled and there is no need for any to reply to it. All future iterations of it will also be disabled/removed.
-
MA Rodger at 19:15 PM on 24 December 2018Breathing contributes to CO2 buildup
bsettlem @115,
You say "If you don’t consider everything you get distorted and untrue results," so are you taking everything ito account?
Yes, the average person exhales something like 1kg of CO2 per day, comprising 27% carbon and 78% oxygen. So if, as you say "all else remaining the same," this average human (who weighs something like 62kg comprising 18% carbon) would be losing 270g of carbon each day through breathing. So, "all else remaining the same," in six weeks time the human race will have run out of carbon to breathe with, and so will be dead. And with 9 billion humans exhausting all their carbon in this way, the atmospheric concentration of CO2, "all else remaining the same," would have risen by a whole 0.05ppm.
And I am not just "absolutely sure" about this: I know it. -
bsettlem at 14:54 PM on 24 December 2018Breathing contributes to CO2 buildup
9 billion live people would add about 9 million metric tons of carbon dioxide per day to the earth’s atmosphere. All else remaining the same, the atmospheric change in carbon dioxide would be 9 million metric tons lower every day if every human was not here.
17.6 living people produce the same amount of CO2 as burning 1 gallon of E10 gasoline.
Humans every day contribute as much CO2 to the atmosphere as burning about 5 million gallons of E10 gasoline.
If you don’t consider everything you get distorted and untrue results.
The world burns about 1 billion gallons of gasoline each day. This contributes about 200 times as much CO2 as 9 billion breathing humans.
If carbon dioxide causes global warming it doesn’t matter its origin. I am absolutely sure that CO2 is not the cause of all global warming.
Carbon Dioxide is plant food.Moderator Response:[PS] Hopefully you are able to think of data that would change your mind rather than being wedded to an ideological argument. Your comment is full of misconceptions readily checked by data. Please see CO2 is plant food and CO2 is from Ocean (because it points to evidence that CO2 rise is from fossil fuel burning) and finally Human CO2 emissions are tiny compared to natural which is where you mostly go wrong.
-
william5331 at 05:03 AM on 24 December 20182018 SkS Weekly Climate Change & Global Warming News Roundup #51
Very likely we have already set a cascade of tipping points in motion but just in case we haven't passed the critical point, we continue not only to emit the same amount of Carbon per year but actually increase it just to ensure that the ball will get over the peak and hurtle down the other side. We still have to keep trying - hope springs eternal and all that. So why can't we see that there is one critical factor that is stoping the efforts of so many enlightened people who would likely turn the situation around with all their great efforts. Who Pays the Piper Calls the Tune. As long as we allow vested interests to finance our politicians, the politicians will do the bidding of the vested interests. It is really that simple. We should abandon all our campaigns and come together on this one. Then we could go back to our favorite hobby horse with a reasonable expectation of success.
-
EsaJii at 22:55 PM on 23 December 2018Explainer: Why some US Democrats want a ‘Green New Deal’ to tackle climate change
Alonerock above: "There is a tremendous misunderstanding regarding temporal and spatial scales."
That's the big one. The layman is confused when a graph is shown that has tens of thousands of years or millions on the x axis. "It's happened before." Then I say "not in 200 years at this rate." I am met with just confusion. I refer them to a book or website, and the conversation is finished.
-
Evan at 10:00 AM on 21 December 2018Dana on Warm Regards Podcast
So you were optimistic Dana that you would write the denial rebuttals, people would read them, understand them, and you would move on to the next task. :-) Seems to me I remember hearing Ben Santer say something similar about their expectations in the early days of climate science communication.
-
Evan at 07:52 AM on 21 December 2018Climate Carbon Bookkeeping
nigelj and scaddenp, thanks for the useful graph and link.
-
scaddenp at 05:53 AM on 21 December 2018Climate Carbon Bookkeeping
Indeed. Credible references. Here it is.

See Nigel's link to see the source references.
-
nigelj at 05:12 AM on 21 December 2018Climate Carbon Bookkeeping
This guy has done an extremely useful graph from 1900 - 2008 plotting all source of emissions including volcanoes, coal, oil, gas and deforestation along with listing his source material, so it looks credible.
-
SirCharles at 14:09 PM on 20 December 2018Little Ice Age? No. Big Warming Age? Yes.
Maybe SkS wants to embed this carbon budget clock into its website
-
SirCharles at 14:05 PM on 20 December 2018Little Ice Age? No. Big Warming Age? Yes.
How does that fit to the following article in Nature?
=> Global warming will happen faster than we think

Seems like this "little ice age" myth will never die out.

-
scaddenp at 12:16 PM on 20 December 2018Climate's changed before
I should also add that scientists are inordinately attached to conservation of energy. You cant magically increase the Ocean Heat Content without adding the energy from somewhere. The change in GHG easily account for this. Pretty hard to figure a way of doing this from a change in any known natural forcing.

-
scaddenp at 12:03 PM on 20 December 2018Climate's changed before
"This myth-busting deals with natural climate variability, yes? Isn't the uncertainty about ECS exactly directly related to that?"
Um, no? Using past climate to estimate ECS is plagued by the uncertainties in both estimates of past global temperature and past forcings. Naive estimates of TCR from short-term measurement do suffer from internal variability (not to be confused with natural climate variability in forcings).
Model estimates of ECS must deal with feedback - and the range there is largely due to the difficulties with clouds in current hardware. Ie not only how much does cloudiness change with a change in temperature but also change in high-level versus low level cloud (one is a positive feedback, the other is a negative feedback). Again, all of this is discusssed at length, with references in the IPCC WG1, (see table 9.5 for instance).
"Natural variability" is of two kinds - one is the internal variability due to uneven heating of wet planet. This is essentially weather and evens out over a 30 year time scale (hence climate being 30 year averages).
The other is natural climate variability due to changes in natural forcings - predominantly solar (both in strength and orbitally-induced variations in latitudinal distribution), and volcano aerosols.
-
David Kirtley at 07:12 AM on 20 December 2018From the eMail Bag: A Deep Dive Into Polar Ice Cores
Here is an interesting write-up on a new paper: How complexity science can quickly detect climate record anomalies. And here is the paper: Anomaly Detection in Paleoclimate Records Using Permutation Entropy.
This isn't dealing with CO2 measurements in ice cores, but rather temperature measurements from H and O isotopes within the ice. What is interesting is that it is possible to get very fine-grained sampling of these isotopes, up to 40 readings per year's worth of ice! The problem now is that this is too much information to manage. The purpose of the paper is to use information theory/complexity science to process the data more easily. (Or something.)
Compared to previous ice core data, which allowed for analysis every 5 centimeters, the WAIS Divide core permits analysis at millimeter resolution.
“One of the exciting thing about ice core research in the last decade is we’ve developed these lab systems to analyze the ice in high resolution,” says Tyler Jones, a paleoclimatologist at the University of Colorado Boulder. “Quite a while back we were limited in our ability to analyze climate because we couldn’t get enough data points, or if we could it would take too long. These new techniques have given us millions of data points, which is rather difficult to manage and interpret without some new advances in our [data] processing.”
I don't think it would be possible to sample the ice cores in the same manner for CO2 readings. But even if it were, everything I've written in this post would still be in play, so that an extremely fine-grained CO2 record wouldn't actually give you a true look at CO2 on a yearly or monthly basis, as in the Keeling Curve.
-
scaddenp at 06:19 AM on 20 December 2018Antarctica is gaining ice
The Realclimate comment does the calculation to show how small the geothermal component is, even with ridiculously unphysical assumptions. Furthermore, if you look at the references behind your links, you will note the important comment that geothermal flux is not increasing - there are physical constraints around the rock properties in play. When you are looking at change in Antarctica, geothermal influence isnt important.
The biggest player in Antarctica is the loss of the buttressing ice shelves undermined by warming adjacent ocean (see also here), which speeds glacial loss.
-
michael sweet at 23:25 PM on 19 December 2018The Key To Slowing Global Warming
Econuke:
Welcome to Skeptical Science. You have chosen an interesting subject to hang your hat on.
Unfortunately, when you introduce yourself with obviously ignorant statements like "Reactors using water as a coolant and moderator, i.e. every power reactor in the world if I recall correctly" the rest of your comment does not seem very convincing. This Wikipedia article describes existing sodium cooled reactors similar to your fantasy reactors. Some of these were built as power reactors.
Similarly, a first sentence that insults another poster invites insults back. If you are polite you will receive polite responses.
It is customary at Skeptical Science to link to scientific sources to support your claims. I noticed that you neglected to link any resources at all in you post. Try to raise your game.
You could help us here. For the past several years I have asked all the nuclear supporters who post here to write an article that describes the usefulness of nuclear power. Skeptical Science would welcome a well written article citing the scientific literature that supports nuclear power. Unfortunately, no-one thinks it is worth the effort to write such an article. Perhaps it is because the scientific literature does not support nuclear power. The article should address the issues raised by Abbott 2011.
Ask the people of Fukushima about nuclear safety. Imagining that a technology with no existing pilot plants could help with a problem that demands immediate action is folly.
I will not address the remainder of your post. It is well known that nuclear power is uneconomic. Power from existing nuclear plants is the most expensive power. New plants cannot be built on time and on a budget.
-
RedBaron at 22:51 PM on 19 December 2018Arctic sea ice has recovered
@KAllan,
No. That's just the change in albedo. Ice reflects more sunlight, and water absorbs it instead.
-
MA Rodger at 20:25 PM on 19 December 2018Heat from the Earth’s interior does not control climate
PetroCurious @71,
The centre of the earth is incredibly hot but this is achieved because it is well insulated rather than being supplied with a big power input. So think 'candle' rather than 'stove'. And the 'home' has no windows to let warming sunlight in - it is a concrete bunker, well insulated and very very hot inside.
But we are concerned with the outside surface temperature of the bunker, heated by the sun. Even without a mechanism analagous to the GHG effect, the average temperature of the outer skin of the bunker will be about 250K due to the sunlight heating the outside, although on the outside surface the nights will be cold without a GHG effect, heated only by the warmth left from the day within the concrete, and not forgetting that candle.
The candle, while it raises the interior of the bunker to fantastical temperatures because of the insulating concrete, is only supplying 80W which at the surface of a 10 metre cubes bunker is only 0.1W/sq m, enough if the sun stopped-for-ever to heat the outer skin of the concrete to just 36K above absolute zero. But with the T^4 relationship in:-
Radiate energy = (Emissivity) * (Stefan-Boltzmann constant) * (Temperature)4 * (Area),
with the sun heating the skin, the candle only raises the average outer temperature from 250K to 250.02K, a trivial increase.
-
JohnSeers at 19:23 PM on 19 December 2018Heat from the Earth’s interior does not control climate
71 @PetroCurious
"if the Stove is perpetually on, at some point it will have an affect on the overall temperature of the home, no?"
Your question is not quite defined enough as you need to state more precisely what you mean and the starting conditions. What do you mean by "affect" the temperature? Go up? Go down? Stay the same? All are possible in the scenario you have described.
Perhaps what you are thinking is the temperature will go up? That depends on the starting temperature and the rate of loss of the heat from the house. There is a theoretical equilibrium point where the heat being lost is equal to the heat the stove is providing. The house will reach this equilibrium temperature eventually.
Or are you suggesting the house does not lose any heat because the "windows and doors are closed"? It will still lose heat through radiation.
Does that answer your question?
-
KAllan at 19:18 PM on 19 December 2018Arctic sea ice has recovered
I note that in the Footnote to this article it is stated that, " When the sea ice diminishes, more heat passes into the oceans." Science seems to be at odds with this statement. I think that the absence of explanation as to where the heat comes from that passes into the oceans can cause confusion. A layperson might argue that the reason for putting ice cubes in a drink is to cool the drink by removing heat from it that results in the ice cubes melting. Clearly, the heat passes from the drink to the ice cubes, yet it is stated that the analogous oceans have heat passing into them. The layperson is left to assume that this heat must come from the melting ice which is a conundrum.
-
econuke at 19:06 PM on 19 December 2018The Key To Slowing Global Warming
nigelJ,
It's rather rude to call someone a fanatic for understanding the potential of nuclear power.
Reactors using water as a coolant and moderator, i.e. every power reactor in the world if I recall correctly, are not the only kinds of reactor designs. I liken them to wood fired steam engines that should really be phased out of use. The vast majority of their construction cost and time comes from the redundancies and physical requirements of keeping water a liquid at nearly 200atm or more and 300c.
Other designs, such as molten salt reactors, don't have those requirements. This makes them much smaller, much simpler, much faster to build, and therefore much cheaper than water reactors. All safety concerns related to maintaining a giant pressure cooker also disappear. This means they would be even safer than nuclear's already unrivaled safety record.
Alternative designs are able to be used for producing synthetic fuels because of their much higher operating temperatures. This allows them to serve as industrial heat sources for all sorts of uses, such as ammonia production or synthesizing CO2 into methane, which can be further processed into liquid fuels.
Safety concerns of nuclear power are grossly overstated, but the general public has no concept of radioactivity. There was a NOAA map of the Tsunami's wave energy being passed around as a radiation map, but almost no one seemed to notice that the key was in centimeters rather than anything related to radiation. I imagine if you gave most people a geiger counter for a week, they'd have a nervous breakdown.
-
nigelj at 16:52 PM on 19 December 2018Little Ice Age? No. Big Warming Age? Yes.
The article is a good explanation, and useful, but once again we are in the mode of explaining and defending. A political commentator in my country noted "explaining is losing" - a perceptive observation. That's not to say we should never explain, but I'm sure people would understand his point.
Somehow, and I don't know how, those concerned about agw (and social justice) need to set the agenda and get more on the front foot and a lot more hard hitting.
-
Josbert Lonnee at 12:14 PM on 19 December 2018A Rough Guide to the Jet Stream: what it is, how it works and how it is responding to enhanced Arctic warming
Here:
https://en.wikipedia.org/wiki/Synoptic_scale_meteorology
I read:
"Low-pressure areas and their related frontal zones occur on the leading edge of a trough within the Rossby wave pattern, while high-pressure areas form on the back edge of the trough."
I did not read that in this article, or did I miss it?
Prev 242 243 244 245 246 247 248 249 250 251 252 253 254 255 256 257 Next


