


 Arguments


Recent Comments
Prev 2635 2636 2637 2638 2639 2640 2641 2642 2643 2644 2645 2646 2647 2648 2649 2650 Next
Comments 132401 to 132450:
-
cce at 18:58 PM on 22 November 2007Al Gore and Dr Thompson's thermometer
"Our conclusion is that this recent period of warming is likely the warmest in the last millennium." NAS supports '98 global warming evidence -
kenton at 09:58 AM on 22 November 2007Evaporating the water vapor argument
Philippe, your chemistry is a little askew. Natural oxidation of methane is a chemical process which I don't believe would fall under your definition of burning, yet has the same chemical equation. Why isn't that adding water vapor to the system? Or respiration, or a gazillion other processes occuring all over the globe on, under and above the surface, continually removing and adding water to the atmosphere in a wonderfully dynamic process, varying over hours and millenia, over elevation and geographic location, in ways that we continue to struggle to accurately model and understand. Despite what John would have you think in the analysis above, more than one climatologist is continuing to study the effect of water vapor on global climate. To blithely state that the global atmospheric water vapor content is essentially a simple function of global temperature because it is governed by the Clausius-Clapeyron relation (John, is that an unfair paraphrase?), should make a climatologist wince. For example, this relationship is approximately true only near the ground-- and only higher altitude (free troposphere) water vapor effects earth's cooling (precisely because it is colder than the earth), and up here, water content is governed not by C-C relation, but by transport processes such as the rise/fall of warming/cooling air. I can give references. In fact, a quick google just pointed me to IPCC TAR Ch7.2.1 Physics of Water Vapor and Clouds. John, although I find your site a delight and in general think you have the right mind-set, you shouldn't over-simplify just to show up the global-warming skeptics. Or you may fall into a similar trap as Philippe and over-extend your reach attempting to bolter to eagerly your already-held belief. Specifically, here I think you are attempting to stifle a scientifically-valid continuing attempt to understand a complicated process, by prematurely asserting the issue is resolved, with a simplistic and/or flawed line of reasoning. A trait I greatly fault Al Gore for sharing. Regards, KentonResponse: Good feedback, kenton. I'm not saying we should stop studying water vapor systems - if I give that impression, I'll revisit my words. In fact, I think climate will never be completely understood - there'll always be nooks and crannies to further understand. But I do believe we know enough to act on reducing CO2 emissions.
Re over-simplification, that's a framing issue I'm still working out. I'd like to make the science accessible without compromising scientific accuracy. The point of this page is not to say water vapor is completely understood but that rather than contradict anthropogenic global warming, it is actually consistent with it. But I will have another look at my treatment of the C-C relation so thanks for the feedback -
nanny_govt_sucks at 11:06 AM on 21 November 2007Al Gore and Dr Thompson's thermometer
Other reconstructions tell a different story. See http://www.ncasi.org/publications/Detail.aspx?id=3025. By the way, is the NOAA the last word on climate of the last millenium? Why do you pick them as an authority over the NAS, for instance? -
Wondering Aloud at 01:03 AM on 21 November 20071934 - hottest year on record
Also the graph here only goes back to the end of a 30 year cooling period. And establishes this as the zero point.Response: The point of the graph is to show the miniscule difference before and after the "Y2K correction". The reason it only showed the last 30 years was because if you display an even longer period, the difference is even harder to detect. Here is the same data going back to 1880 (again courtesy of Tamino):
The difference between the temperature record before the Y2K correction (red dots) and after the correction (black diamonds) is insignificant anytime before 2000 and still barely noticeable after 2000. The change has had practically no detectable impact on the global warming trend over the past 30 years. As for the zero point, temperature anomaly graphs take an average over a specified period (eg - 1960 to 1990) - the temperature anomaly is the difference from this average. The period selected is arbitrary (GISS and CRU use different time periods) as the trend will be the same regardless.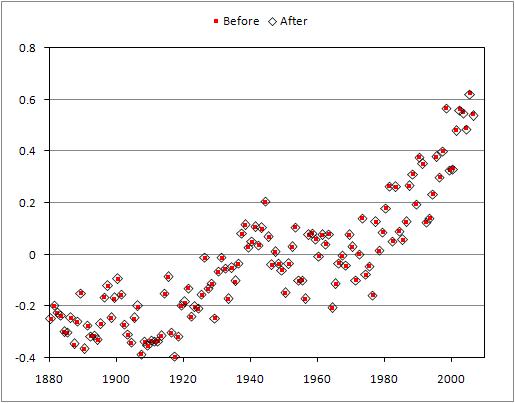
-
Wondering Aloud at 01:00 AM on 21 November 2007It's not bad
Malaria spread? It already reaches the Arctic circle how much more could it spread? I know tongue in cheek but some of these things are mutually exclusive. -
Wondering Aloud at 08:56 AM on 20 November 2007Did global warming cause Hurricane Katrina?
Well you could start here... Though there are many others. What many of them say is that warming has not increased intensity or frequency. Free, M., Bister, M. and Emanuel, K. 2004. Potential intensity of tropical cyclones: Comparison of results from radiosonde and reanalysis data. Journal of Climate 17: 1722-1727. However since CO2 is supposed to produce warming primarily in cold dry air, the models I am familiar with predict that the poles should see the most significant warming. As temperature differential between the tropics and the poles is a major driving force of cyclonic storms a decrease in the differential should lead to a decrease in storm intensity. Prior to Katrina the relatively low number of major hurricanes in recent years had been seen as evidence that the models were right. I have looked at a number of papers and while 15-20 years ago I would have said warming should increase system energy and therefore intensity, I think I was wrong back then. It seems pretty clear that frequency and intensity have not increased in the last 70 years, if GW theory predicts they should this would in fact be strong evidence against it.Response: Thanks for the link - interesting that the 2004 paper is co-authored by K Emanuel who wrote the 2005 paper that is the primary evidence linking greater SST to hurricane intensity. There's more to this, I'll see what I can track down. -
Wondering Aloud at 06:27 AM on 20 November 2007Are we heading into a new Little Ice Age?
No, I was commenting on the size of the feedback effects predicted for CO2 caused warming. We are assuming that feedback will be positive and magnify the warming effect of the CO2. In the last 3 IPCC report the magnitude of these feedback effects was predicted to be 3-4 times what can be justified from observation, and the error bars have been huge. Without a large positive feedback effect there is really no way CO2 alone could cause enough warming to be any big deal. I don't know what assumptions the people trying to explain solar effects are using. However, the reason the predicted rise from CO2 is so large is because in the case of the CO2 they are assuming a large positive feedback that cannot yet be verified from observation. If, as the evidence suggests, the feedback effects are less than a third of what is predicted in the IPCC reports; than the amount of warming expected is much reduced. Since I like to end with a question, I can think of a way off the top of my head to cut CO2 emissions in North Amerrica by 50% in the next 10-15 years at zero net cost to the economy and with no new technology needed. If people in policy making positions are convinced of this impending disaster why are they wasting time with useless expensive junk like cap and trade and the Kyoto protocol?Response: Off the top of my head, I can think of several strong pieces of empirical evidence for positive feedback. Soden 2001 and Santer 2007 both use observations of atmospheric water vapour to confirm the positive feedback nature of water vapour (more on water vapour). And a climate sensitivity of around 3°C (which would require positive feedbacks to be that high) is empirically confirmed by Hansen 1993, Lorius 1990, Hoffert 1992, Gregory 2002 and Tung 2007 (more on climate sensitivity). But funny you should bring it up - I'm actually working on a new post describing other empirical observations of positive feedback (a followup to the model uncertainty post) - I'll post that within a week or two. -
StanislavLem at 17:21 PM on 16 November 2007Models are unreliable
I recommend this paper and it references for this section as well http://members.iinet.net.au/~glrmc/2007%2005-03%20AusIMM%20corrected.pdf -
StanislavLem at 16:37 PM on 16 November 2007CO2 lags temperature
All of the conclusions you make in your rebuttal of the skeptics argument are valid only if the Milankovitch cycles (which as you note provide relatively weak forcing) are indeed the sole cause for this whole process. This seems like a big assumption to me and I don't think the science behind that has been settled. Most of people sort of automatically assume it, but there are number of scientists starting with John Imbrie (the guy who led the whole CLIMAP effort and published the infamous Ice Ages: Solving the Mystery) that say Milankovich cycles (Earth's orbital variations and such) seem to explain only 50-60% of the whole insolation variance. So, adjusting one's model only using insulation curves generated by orbital modeling as they do in the papers you mention seems unjustified to me. In essence, the authors of the above papers precondition themselves to look only for models that fits their believes (that are only limited to Milankovich cycles as a driver). There are many other additional hypothesis that also make sense even though their quantification is not as simple as just writing an orbital mechanics models which is all nice and simple with nice math functions. A major examples for additional forcings on these time scales include changes in the solar irradiation due to the long-term manifestations of the solar activity that are ought to be much bigger that what we've observed with satellites for the past 20 years (I refer to the TSI measurements) and are not only related to the TSI, but to things like the solar diameter, the solar wind and its interactions with Earth's magnetic field and many other process on the Sun and inside the Earth's core. Many things in the Solar System seem to work in synergy. So, that many cycles and superpositions of cycles of completely different physical processes external or internal to the Earth's climate have similar length and appear as if only one factor is at work when in fact there are several. I acknowledge that there is the Occam's razor that advocates simplicity, but I don't necesesarily think it is the best approach when we are considering Earth's climate and the near-Earth environment. So, I wasn't really asking about the lags, but whether we can even begin to consider that these lags mean anything. As far as the error bars, I was asking for the errors of the reconstruction models that create those curves on the graphs you show. The lines only follow the positions of the 50% quantile of each model output point but tell us nothing about its possible range (due to original measurement errors and other uncertainties).Response: There's still a lot to be worked out re the whole mechanism of deglaciations. For example, there are various theories on what causes the CO2 increase after temperature increase, the most accepted theory being degassing from the deep ocean. I've read of theories that the 100,000 year cycle is caused by solar variations rather than orbital changes although the Milankovitch theory seems to be more established and confirmed by at least several papers I've read. But the main point of this page is to answer the argument that "the CO2 lag debunks anthropogenic global warming". The current scientific understanding of the CO2 record (and the papers quoted in citing CO2 lag) state that the CO2 lag confirms the warming effect of well mixed atmospheric CO2. -
StanislavLem at 15:34 PM on 16 November 2007CO2 lags temperature
First of all, John, thanks for spending the time to create and maintain this site. I do realize it must be quite substantial time commitment. Although, it is not exactly neutral and is somewhat driven by your current opinion that GW is mostly due to anthropogenic CO2 emissions, the forums on the site are still one of the few places where we can have some more meaningful debates based on some scientific thinking and facts. So, in some respect the website is just like Churchill's quote on democracy (I think, he is the right man to quote since as you've correctly noticed many things in the GW debates on both sides are politically motivated consciously or not): "It has been said that democracy is the worst form of government except all the others that have been tried. " Of course there are another two quotes from him that I think very much apply to the GW debate: "The best argument against democracy is a five-minute conversation with the average voter. " & "A lie gets halfway around the world before the truth has a chance to get its pants on." Well, enogh quotes. On a more serious note, sadly enough, the whole field of Climate Science and Global Warming has become just like Finance. There is so much easy money flowing around that there is a great number of people with all sorts of backgrounds and levels of knowledge that have no relation to climate/physics or anything distinctly related (although by all means I am not saying we should only used established scientists' work as a guideline) that would make most outrageous claims/predictions with arbitrary certainty backed up many low-quality science booklets/papers/reports, posh presentations and heavy media support to streer more funds their way. In general, what I'm refering to is the so-called "press release science", unfortunately endemic to so many other fields besides climate. And finally, refering to the following quote from your bio section: "I'm still yet to meet a skeptic argument that is even vaguely convincing." I would suggest looking at some arguments that come from people that don't exactly fit the typical skeptic stereotype you describe, for example take a look at this list http://www.warwickhughes.com/hoyt/climate-change.htm and the following scorecard on the same website http://www.warwickhughes.com/hoyt/scorecard.htmResponse: Love those quotes from Churchill. I must confess, I'm not particularly impressed with Warwich Hughes' climate change page which reads a lot like my Skeptic Arguments page (except mine is more comprehensive :-) His scorecard is interesting - if I have more time after maintaining this site (and responding to your comments), I'll give it a closer look. -
John Cross at 04:41 AM on 16 November 2007Mars is warming
StanislavLem: An interesting post, but even better for me is that it lets me play skeptic for a change ;-) . You do not specify what viable hypothesis explain how non-TSI manifestations of solar activity cause dust storms on Mars, so I can not address that, but I do not agree with your idea that the Martian atmosphere is a good test bed to allow observation of the effect of human activity. Off the top of my head, here are 4 major differences and, in my opinion, each one is enough to invalidate such a comparison without a large amount of research (i.e. several continuous martian weather stations). 1) No magnetosphere so there is a direct ionization of atmospheric particles. 2) I would disagree with your comparison about pressure. If you are looking at total atmospheric pressure, then Mars is more like the stratosphere. If you are talking about partial pressure of CO2, then the surface of Earth is the best we can get, but that is even too low. In any case, both of these do not produce some of the more important effects such as pressure broadening of the CO2 absorption spectrum. 3) There is no water to speak of and thus the vertical thermal transport associated with water does not exist. 4) Finally, the drivers also seem to be much different. Dust storms are a key part of the Martian climate as are sublimation winds from the poles. These have no equivalent on earth. Regards, John -
Wondering Aloud at 03:14 AM on 16 November 2007CO2 lags temperature
No, the American Chemical Society Conference at which I noted this discrepency in a presented paper was in 1989 because I was in Grad Chemistry courses at the time, so I much doubt that it was 2001 or 2003 data. Other than that I hope you're right because otherwise 1)we are being led down the primrose path and 2) I am freezing my butt off up here. The presenter after having this error spotted by a lowly physics type grad student was not well recieved in the question session by the roomful of chemistry PhD's that were present. None the less his hypothesis that CO2 causes global warming is still widely discussed. :)Response: I would be surprised if ice core records were of sufficient resolution back in 1989 to clarify CO2 was lagging temperature - it's only been more recent ice core records that have been of high enough resolution to clarify the CO2 lag. Spencer Weart has published a great online history of ice core measurements that is well worth a read.
Without knowing which older studies you're talking about, the most recent studies with up to date (and dare I say the most accurate) data (Monnin 2001, Caillon 2003) paint a similar picture of Southern warming -> CO2 rise -> Northern warming. But if you do know of any pertinent older papers, it'd be great if you could post the links here. And kudos for sticking it to the man :-) -
Wondering Aloud at 01:14 AM on 16 November 2007Models are unreliable
Models are the biggest gun in the arsenal for AGW. What people like Dyson are telling us is that the models use assumptions that are not validated by observation and that cannot account for many known effects. The models might be right but they haven't got a good track record except in hind sight. (After they've been fudged to fit the past) Someday they will probably be good they are better than 20 years ago. -
Wondering Aloud at 01:05 AM on 16 November 2007Climate's changed before
Thanks for trying to answer science with science. Most sites on the subject are propaganda vs science or propaganda vs propaganda. -
Wondering Aloud at 05:05 AM on 15 November 2007Are we heading into a new Little Ice Age?
..."the change in forcing even if in the extreme case of a Maunder Minimum is less than the forcing from CO2. ]" Doesn't that depend on whether or not the size of the feedback effects, that are supposed to magnify the CO2 forcings, are correct?Response: It doesn't matter - feedback is dependent on temperature rise, not the nature of the forcing. The feedback from 1 degree of solar warming would be the same as the feedback from 1 degree of CO2 forcing. -
Wondering Aloud at 04:54 AM on 15 November 2007It's cosmic rays
I always thought this hypothesis seemed unlikely, but... What about the last 10 years of global not warming? Why does CO2 get an 800 year wrong direction lag and the sun has to be exactly in step to be a viable hypothesis?Response: The point is that because the sun has correlated so closely with temperature in the past, when the correlation ended in the 1970's, it's reasonable to conclude some other forcing imposed itself on the climate. Re the CO2 lag, the ice core records actually confirm the amplifying effect of atmospheric CO2. As for the last 10 years of global not warming, you'll find the warming rate is the same over the last 10 years as over the last 30 years. -
Wondering Aloud at 04:45 AM on 15 November 2007CO2 lags temperature
RE: response Are we sure about that? I am sure the original data from way back then was actually from Greenland ice cores, showing that temperature was rising before CO2, there as well as in the Antarctic. The Antarctic data was not yet around. If CO2 is rising first in Greenland than your hypothesis may be correct. I know CO2 is supposed to cause warming, and I think I understand why. But, the data still seems to scream corelation does not equal cause and effect.Response: The "original data from way back then" was probably Monnin 2001 which used the Dome Concordia ice core or Caillon 2003 which used the Vostok core - both are from Antarctica. Caillon concludes "The sequence of events during Termination III suggests that the CO2 increase lagged Antarctic deglacial warming by 800 ± 200 years and preceded the Northern Hemisphere deglaciation." More recently, Stott 2007 found that tropical temperatures lag southern warming by ~1000 years. I agree with you - correlation does not necessarily imply causation. But the ice core record is consistent with the warming effect of CO2 and explains both the degree of deglaciation and how a localised warming (increased insolation in the south) spread across the globe. -
StanislavLem at 13:55 PM on 14 November 2007CO2 lags temperature
Provide error bars for the reconstructions, they tell quite a different story. Error bars are always necessary for meaningful interpreration of graphs like this.Response: Not sure what your point is - are you disputing that CO2 lags temperature? Monnin 2001 doesn't display error bars but quantifies the lag as around 800 ± 600 years:

Caillon 2003 constrains the CO2 lag to 800 ± 200 years (but again, no error bars):

Stott 2007 finds similar results - a CO2 lag of 1000 ± 300 years. Stott does include 200 year uncertainty on the benthic ages (in fact, Stott's graph includes everything but the kitchen sink):

-
StanislavLem at 13:52 PM on 14 November 2007Mars is warming
Sunspot numbers are extremely crude indicator of solar activity and do not encompass many other manifestations of it (sorry adding the F10.7cm Radio Flux Index also won't do the trick). So repeating the argument that sunspot numbers have leveled out since 1950 doesn't necesseraly mean what you want it to mean (no additional inputs from the Sun in the Earth's or any other planet's climate). Also, focusing only on the total solar irradiance (TSI) as the only possible way in which solar activity influences Earth type planets' climates is just selective presenting/lack of knowledge (I hope it is the second, since the first would imply very bad things about your presentation of facts). In fact, there some quite viable hypothesis that explain how non-TSI manifestations of solar activity cause dust storms on Mars (by the way those are possible for the Earth as well). Obviously there is still to little data to confirm or reject them. By don't "get rid of" Mars just yet. Mars is actually quite good "test case" for the anthropogenic vs. natural warming debate. As a planet it is quite similar to the Earth in many important aspects and it is as close as ti the Earth as it gets in the solar system. Some of the main advantages for a possible "Mars test case" are: 1. There is no human activity there to influence the Marsian climate in any way, so we can discount that factor 2. there is no ocean to provide huge termal inertia, so solar effects will be much more immediate, 3. Marsian day is almost identical to Earth's day, 4. Marsian atmosphere is similar Earth's mid upper atmosphere, so this simplifies estimation of the solar effects quite a bit. The geometrical effects that you mention (orbit's eccentricity, axis tilt) are quite easy to correct for, much easier that cloud structure in the current climates for example. -
StanislavLem at 13:08 PM on 14 November 2007Are we heading into a new Little Ice Age?
Consensus statements are meaningless in general, they are sort of popularity contest of who is more loud and famous, and who's got the biggest grants (not necessarily the best science). There's at least 2-3 solar models that have quite good track record at predicting coming solar cycles based on various patterns that hold quite well over time (i.e. statistically significant), some include physical mechanism and some are based on statistical relationships. We have much longer and better records for solar activity that for Earth's climate and they allow for much better verification. You can start with Sabatino Sofia's models, there are other less known as well. In conclusion: The graph you posted up there is quite misleading because it doesn't distinguish between quality of various models.Response: The point of mentioning "consensus" is that there is actually very little in the way of a single consensus position - that the solar prediction panel predicts either greater or smaller tells us little. But once again, the point is moot - the change in forcing even if in the extreme case of a Maunder Minimum is less than the forcing from CO2. -
nanny_govt_sucks at 06:24 AM on 13 November 2007Al Gore got it wrong
Al Gore also got "Dr. Thompson's Thermometer" quite wrong (please see http://www.climateaudit.org/?p=2335 for more) 1. The y-axis is inverted so the graphic actually shows temps are _cooling_ not warming! 2. The graphic is actually a reconstruction from Michael Mann, combined with Jones' CRU data, and not Thompson data at all. 3. The graph is centered at 0.5 instead of 0. It is also interesting to note that prominent AGW credulist Tim Lambert knew of these errors yet said nothing as revealed in the comments in this post - http://www.climateaudit.org/?p=2328 . It makes one wonder why Mann and Thompson did not say something about the misrepresentation. Perhaps they did not see the movie?Response: Thanks for the links - I've added a new post about Dr Thompson's thermometer. -
emmac at 23:35 PM on 11 November 2007Are we heading into a new Little Ice Age?
Thats a bummer, i was looking forward to a little ice age and thinking about how to prepare for one, todays society needs to be knocked down a peg or two. -
emmac at 08:45 AM on 11 November 2007Are we heading into a new Little Ice Age?
Is it possible that cycle 24 won't get very big at all and we could be entering into a maunder minimum now?Response: Anything's possible but it's very unlikely that the next cycle will be a Maunder Minimum which was a rare occurance of no sunspots for a number of decades. The most likely predictions for the next cycle are slightly less than usual or slightly more than usual. However, the pertinent point is even if we did enter a maunder minimum, the forcing from CO2 emissions far outweighs the change in solar forcing. -
joan lorraine at 11:08 AM on 10 November 2007Did global warming cause Hurricane Katrina?
No Al Gore does not get a pass on Hurricane Katrina. He clearly implies in his book and never once qualifies it that Katrina was caused by global warming. Katrina was a Category THREE -- count it -- Three hurricane when it hit New Orleans. This is far less intense than many of the worst hurricanes that the Gulf has historically produced. It also hit a city that was an accident waiting to happen: the result of decades of poor infrastructure maintenance and bad urban planning. Those who suffered the most in New Orleans -- poor people of color --deserve better than to have a group of elite white men prey upon their suffering to further their own agenda. The scientist who argues that we are currently seeing more intense hurricanes due to global warming, Kerry Emanuel, also wrote: "it would be absurd to attribute Katrina to global warming." The storm wasn't what caused the disaster, but I imagine that FEMA, the city mayor, and La's governor are all thrilled to be exonnerated by you. Where on earth is the liberal conscience here. What Al Gore wrote in the book where Katrina is concerned (which I understand captures almost word for word the film) is propaganda pure and simple. This does nothing for the cause of global warming, and the people of New Orleans deserve better. -
Wondering Aloud at 06:54 AM on 10 November 2007There is no consensus
Roverdc hits the nail on the head. To say there is bias in the science at this point is a wild understatement. What the public hears is claims that "all scientists except a few kooks agree that catastrophic global warming is immenent and caused by your car.". This is what they think you mean by consensus. Is it safe to say the real consensus is closer to the view of those so called deniers in the National Post series or to the alarmist panic that is being widely circulated through things like "An Inconvenient Truth"? -
Wondering Aloud at 06:42 AM on 10 November 2007CO2 lags temperature
It is reasonable that warming of the oceans is in fact causing CO2 increase in the paleo record. What I wonder about is how anyone can turn this into evidence that CO2 causes warming? When I first saw this at an ACS function nearly 20 years ago these curves were presented as proof of CO2 caused warming; despite the obvious fact that the graphs, even then, showed that the temperature change was not following but rather was leading the CO2 change. Now we are trying to explain away T changing first invoking creative models. It appears the fundamental premise that CO2 causes warming is simply not supported by the paleo record. It may still be true, but what evidence do we have in the climate record that supports this hypothesis? Here is another question: If ice ages are on 100,000 year cycles because the Earth's orbit is more elongated on 100,000 year cycles why is the Earth's orbit so round now? Shouldn't it be nearing maximum excentricity?Response: The paleo record shows that Antarctic temperatures rise about ~800 years before CO2 and Greenland temperatures rise after the CO2 rise. The CO2 warming effect is necessary to explain both how weak orbital forcing can get us out of an ice age and also how an orbital forcing that affects only southern areas can spread through the globe. The paleo record also enables us to compare Co2 forcing with temperature change to calculate climate sensitivity. -
Dave Rado at 09:57 AM on 3 November 2007Mt. Kilimanjaro's ice loss is due to land use
I've found a better link re. the Himalayas: Himalaya Ice-Melt Threat Monitored in Nepal, National Geographic News, which includes the following:For example, researchers at the National Institute of Hydrology in Roorkee, India, estimate that reduced glacier meltwater would cut July-through-September river flow of the Ganges by two-thirds. This decline would leave 500 million people and 37 percent of India's irrigated land short of water. Himalayan glaciers also feed six other of Asia's great rivers—Indus, Brahmaputra, Salween, Mekong, Yangtze, and Huang Ho—putting communities across this region at risk of water shortages.
-
Dave Rado at 12:09 PM on 2 November 2007Mt. Kilimanjaro's ice loss is due to land use
Okay thanks. Some more relevant links: 1) Alps Glaciers Gone by 2050, National Geographic News. 2) Mountain Glaciers Melting Faster Than Ever, National Geographic News, which includes the following:Lonnie Thompson, an expert in ancient climates at Ohio State University ... said ... "Kilimanjaro's glaciers are melting so quickly ... that the mountain lost nearly a quarter of its ice from 2000 to 2006 ... [it points out that melting is accelarating everywhere and adds] ... If you look at what's happened to these glaciers, they're not just retreating, they're accelerating [their retreat]," he said. "And it raises the question of whether this might be a fingerprint of [human-caused global] warming.
In other words, even if the melting of Kilimanjaro prior to 2000 contains 0% influence from climate change (which is unlikely), the influence of climate change on the melt rate of Kilimanjaro since 2000 is almost certainly well above 0%. No other factor, including deforestation, can credibly account for the sudden acceleration post-2000. 3) Himalayan glaciers 'melting fast', BBC:"Melting glaciers in the Himalayas could lead to water shortages for hundreds of millions of people"
Admittedly this article has the disadvantage that it quotes a WWF study - it would be nice to find a similar one that was independent of any lobby group. But it's mainstream stuff and worth quoting if you can't find a better one on the Himalayas' glacier melt and the likely effect of this on neighbouring countries. 4) China glaciers melting at alarming rate, Chinese National Coordination Committee on Climate Change. -
Dave Rado at 09:14 AM on 1 November 2007Mt. Kilimanjaro's ice loss is due to land use
To say that climate change is definitely not even partially responsible for the loss of glacier ice mass on Kilimanjaro is an inaccurate misrepresentation of the science. As Raymond Pierrehumbert's article that you linked to made clear, it is likely to be at least partially responsible. Furthermore, Gore did not "get it wrong" as you claim - in the movie, the retreat of Kilimanjaro is not claimed to be purely due to global warming , but it is given as an example of the sort of thing one can expect in a warmer world, and it is quite true that loss of major glaciers is something we can expect. I also think you ought to link to the global glacier mass balance graph at on the National Snow and Ice Data Center (NDIS) graph here, from which one can see that the worldwide trend is sharply downwards; and there is no dispute in the peer reviewed literature that this is mostly due to climate change. Admittedly, Gore could and should have chosen a better example than Kilimanjaro, such as the Andean glaciers, but he didn't "get it wrong", he just illustrated a valid and accurate point with a poorly-chosen illustration. Finally, I think you should point out that hundreds of millions of people (and huge ecosystems) rely for their water on the annual glacier summer melts that in many cases may cease during the next 50-100 years, as mountain glaciers start to disappear. This includes a large proportion of China's population, all of the “Stans” (Pakistan, Uzbekistan, Turkmenistan, etc.) and most of the Andean countries in South America (e.g. see here , here and here).Response: Dave, all good points and I confess updating the Mt Kiliminjaro page is high up on my to-do list. Thanks for the link suggestions (I do link to the NSIDC graph elsewhere but here is a good place also) - will attend to this shortly as soon as time permits. -
John Cross at 22:28 PM on 29 October 2007We're heading into an ice age
Hi John: Thanks for the thanks (although I will hasten to point out that all I did was offer some minor comments). I am especially delighted to me mentioned in the same acknowledgement as Dr. Solanki. I don't know if Dr. Solanki reads this blog, but if he does I would like to say that I have been reading his papers since I came across the Harold Jefferys Lecture that he did about 4 years ago. Very interesting work! Regards, John -
papertiger at 00:57 AM on 23 October 2007It's the sun
I notice John, that you have done some renovating. Where did your last thirty years of satellite measurements of the TSI disappear to? To the unpracticed eye nothing out of the ordinary is apparent, but to people familiar with the site, it looks as though you are erasing key information that supports Biocab's contention that in regard to TSI it is the minimum measurement extended over time that is the most important. And the minimum is trending up - or rather was. If the current lack of sunspots extends a while longer, and the next solar cycle sees a drop in overall activity followed by a drop in global temperature, will you become a co2 denier? What about you Phil?Response: Not sure what you're refering to but I haven't removed anything (I am constantly tweaking the site but it's mostly adding links to new studies as I encounter them). Perhaps you were thinking of the discussion of satellite TSI data at The sun is getting hotter. As for the next solar cycle and the prospect of a drop in global temperature, it's funny you should mention that - I'm working up a page on that very subject which I'll post later this week. -
horatio algeranon at 14:50 PM on 22 October 2007Climate sensitivity is low
Hi John, Excellent blog. With regard to the climate sensitivity issue, I did an analysis based on Schwartz' assumptions for climate sensitivity (1.1 deg C) and time constant (5 yrs) described here. I wanted to see what kind of warming (due to CO2) that his assumptions would predict for the past 3 decades and how that compares to what actually happened. His predicted result does not appear to jibe with what actually happened. -
ourphyl at 11:15 AM on 21 October 2007Solar cycles cause global warming
Very interesting, I'll study your link. There is much interesting work by UNC prof Jose Rial (and others)on D&O paleoclimate cycles. They need to consider "tipping points" and occasional chaos, extremes that might be of interest. Jose also is a seismic scientist, his abstract re arctic ice follows: Measurements of seismic activity in Greenland's ice sheet indicate the activity is related to the ice sheet's probable fragmentation due to global warming. Project SMOGIS (Seismic Monitoring of Greenland's Ice Sheet), a collaboration between UNC-Chapel Hill and the University of Colorado at Boulder, has detected intense microearthquake activity throughout the region close to the Jacobshavn glacier, one of the world's fastest moving glaciers. The seismic activity is clearly related to glacial sliding (at the base of the ice sheet) and crevassing, or large fractures expanding under the increased warming. "The area we are inspecting could be seen as belonging to the buttresses of a giant cathedral, which is the Greenland ice sheet," Rial said. "If the buttresses fail, the entire cathedral could collapse, perhaps in just a few years. This may be part of what has been called abrupt climate change." I don't know where this might fit in your list should it belong. Thanks and congratulations on a GREAT site. -
Philippe Chantreau at 12:29 PM on 12 October 2007Jupiter is warming
Now we're getting down to the aggressive and personal tone, as if it were going to give more credibility to your assertions. Satellite data for global temperature is in agreement with GISSTEMP, as shown in this graph: http://tamino.files.wordpress.com/2007/08/global2.jpg Since Tamino does not share your views, I expect that you'll try to attack the validity of the graph by suggesting dishonesty or bias, so interested readers should know that the thread of that graph's post contains references for all the data. A Climate Audit blogger used Anthony Watts data to compare with GISSTEMP and, funnily enough, found no significant difference. As a matter of fact, GISSTEMP had the best match with the stations rated by Watts as the better ones: http://www.climateaudit.org/?p=2061#comment-138432 The graph alone: http://www.inturnsoftware.com/downloads/crn12_crn5_giss.gif See also this work: Your accusation of fraud toward Hansen and GISS is interesting considering that the data gathered by their staunchest critics failed to produce any substantial difference. You apparently are ignorant of, or chose to ignore the fact that variations in solar irradiance are so small that they were not actually observed and measured until there were satellites. Because of the atmosphere, ground based instruments do not detect them reliably enough. Reconstructions have been done, however, as in the Solanki paper that skeptics like to cite, except for the conclusion section, of course:"It was shown that even under the extreme assumption that the Sun was responsible for all the global warming prior to 1970, at the most 30% of the strong warming since then can be of solar origin." The full paper is available as a pdf: http://cc.oulu.fi/~usoskin/personal/nature02995.pdf Your assertion on Jupiter makes no more sense. I never affirmed that the Sun had no role, but instead pointed to the dominant body of research indicating that the main driver of the weather is internal heat. Is it distance that best controls heat propagation or other properties? Does distance matter more than density? Convective clouds, fueled by heat from below, have been observed and photographed and I provided a link to one of these photos. Do you have a link to a scientific study attributing the Jovian weather to heat from auroras? How much heat is actually there? What is the mechanism for that heat to travel downward? The most active auroras are at the poles, but as you pointed the poles are cooler, how does that reconsiliate with the "heat from solar particles" idea? You can throw accusations and insults but the questions posed by your "theory" are still not answered. -
papertiger at 00:39 AM on 11 October 2007Jupiter is warming
Your five points rest on the first point - that Jupiters weather is driven by internal heat source. Lets suppose this is true for a minute. The heat would be distributed according to distance from the center of the gravitational compression. Since it is a shorter distance from the center of the planet to the pole then it is from the center to the equator, the pole would be warmer. It's not. In fact the poles are already ten or twenty degrees colder then the equator. Hot equator, cold poles. Exactly what you would expect from a solar dominated weather system. Funny isn't it? Then we got this NASA fellow predicting a change that he hasn't bothered to look for, or if he had he would have noticed that it already happened. You might want to quibble that the sun isn't any hotter then it was in the eighties (interesting that you want to rely exclusively on satellite data for solar irradiance, but then discount the satellite data of Earth's average warming in the troposphere, which shows no trend, in favor of the flawed surface station data manipulations of Hansen's team at GISS), but Jupiter's new red spot gestated in the 30's, slowly gaining momentum over time. An exclusive satellite record tells us nothing about the 30's thru the 70's, and is thus useless for explaining the Sun's impact on Jupiter's weather. But I can tell you are going to continue truncating history to suit your narrative. Some people are always trying to ice skate uphill. -
mvalisa at 17:42 PM on 7 October 2007CO2 lags temperature
Nice correlation between T and CO2 level. However, given a correlation between two variables one has still to clarify which is doing what. One might of course notice that in the most recent "burst" CO2 gets well above the temperature curve, unlike the previous cases. Does anyone know what in the past produced the "fast" T and CO2 growths? Marco -
Philippe Chantreau at 00:16 AM on 2 October 2007Evaporating the water vapor argument
Incidentally, it is fun to point that burning hydrocarbons from fossil fuels is also the only net addition of water vapor to the system, except for a comet impact. The simplest case, methane (natural gas) goes like this if I'm not mistaken (fully developed, with the "real" molecule numbers): 3CH4+6O2 gives 3CO2+6H2O. For every molecule of methane burned, 3 molecules of water are added to the atmosphere. It obviously does not change anything to the John's argumentation above and the existing research results, but, even in the absence of that evidence, arguing that water vapor is a more potent GHG would not undermine the argument that we should veer away from fossil fuels. -
roverdc at 17:32 PM on 27 September 2007There is no consensus
Concensus only has meaning if there is no pressure to conform in either direction. In the climate debate this is extremely far from being true. How far could we reasonably expect a questioner to go in an IPCC panel when that instantly collects a denialist label and probably guarantees a dead end to even the most able career? In the current climate it is reasonable to assume the dissent camp is at least ten times the admitted size. I know that as an admittedly uninformed questioner I get some pretty vitriolic responses from the eco faithful. -
Philippe Chantreau at 13:45 PM on 27 September 2007Jupiter is warming
Poles should be warmer than the equator? I'm not sure why. Are you sure that the atmosphere (i.e. the layer between the "altitude" at which hydrogen becomes liquid and the one where pressure becomes negligible) is actually thinner at the poles? The Kunde et al paper mentions the lack of latitudinal heat transport. If there was a mechanism for the heat from the ionospheric hot spots to somehow travel downward, it would still not be moving to the latitudes where heat would be needed to fuel the convective clouds, which have been precisely observed, as in this other pic I linked: http://pds.jpl.nasa.gov/planets/captions/jupiter/watercld.htm Because once again of the lack of latitudinal heat transport and the vortex shaped polar circulation, your argument applies negatively to your hypohesis too. If solar wind heat could warm up the polar atmosphere at the lower levels, that heat would remained confined to the poles. Also, how likely is it that this heat is quantitavely apt at generating Jupiter's weather? It seems that the solar wind heat hypothesis creates more problems than it solves. -
papertiger at 06:56 AM on 27 September 2007Jupiter is warming
Thick Jovian atmosphere. Jupiter is an oblate spheroid. The distance from the center of the planet is shorter from pole to pole then it is across the equator. In the storms are fueled internally model the poles should be warmer then the equator, because the heat would have a shorter distance to travel to reach the surface, less material to heat. The aurora are dissimilar from Earth's due to two factors. Jupiter's mag field is 1000 times more powerful, the particles are a 1000 times as hot, and Io is erupting fresh material at escape velocity which feeds and augments the mag flux. -
nrlen at 19:43 PM on 26 September 20071934 - hottest year on record
The graph cannot be right. 1934 is the hottest year, with 1998 second. The graph shows 2005 as hotter than 1998. The whole thing does not ring true, it looks manufactured to promote the alarmists assertions and to minimise the exposed errors.Response: The graph is of global temperature. '1934 is the hottest year' applies to US temperature. -
Philippe Chantreau at 08:31 AM on 26 September 2007Jupiter is warming
I should probably emphasize that the observations show localized hot spots in the upper ionosphere, just for clarity. Saying that solar heats up the polar atmosphere is a little bit of a stretch considering how thick the Jovian atmosphere is. -
Philippe Chantreau at 12:34 PM on 25 September 2007Jupiter is warming
Having the full paper is definitely better. I stand corrected. The warming mentioned by papertiger concerns the upper ionosphere at levels of a few microbars. In that sense, it is true that the atmosphere is heated by particle deposition and other sources not fully understood (Joule effect was mentioned). However, this is more relevant to the upper atmosphere's chemical composition and does not appear to have much implication for its weather, considering how high it is happening and that Jupiter's storms are fueled by heat from below. -
Philippe Chantreau at 11:54 AM on 25 September 2007Jupiter is warming
Hot dog!! Thanks for the tip John! -
Philippe Chantreau at 11:49 AM on 25 September 2007It's the sun
What it also shows for the 20th century is that the timing is not quite right. Temp increases sharply before the TSI and then, even before the TSI reaches its first 20th century spike, the temp actually starts to decrease, followed by a TSI decrease, and then the temp increases again, followed again (very modestly) by the TSI. If I was using a skeptical aproach to attempt a correlation between the 2 on this graph, it would appear that TSI was driven by temperature during the 20th century. -
Philippe Chantreau at 11:31 AM on 25 September 2007Jupiter is warming
Interesting paper. I don't have a subscription so I could not read the full article. I might miss something but from the abstract and the excerpt provided I do not see where it is demonstrated that heat from solar particle winds (?) warms up the polar regions. Any cites on how the particles would generate the heat? Whatever heat is there is unlikely (that's an understatement) to amount to more than the solar irradiance itself, which is, as we have well reviewed, 2.4 times less than the internal heat. I have not read anything suggesting that internal heat is confined to the equatorial regions. Although the lower latitudes Jovian auroras are somewhat mysterious, the polar ones are mostly similar in nature to those of Earth, as suggested by the Cassini/Galileo data: http://www.jpl.nasa.gov/releases/2002/release_2002_46.html I don't know of any research attributing a significant part to auroras in the atmospheric heat budget of any planet and I still have not burned my hand by touching a neon tube. If there is some research about that, a cite would be nice. From my (modest) recollection of physics, I would think that trying to heat anything with particles is like trying to boil a kettle by throwing hot pebbles at it. Eventually you may succeed with a super-dense barrage of particles, but that's not what the solar wind is.Response: Phillipe, for the record, free registration to the Science website will get you access to that article. Science has a window of free access (providing you're registered) - the only articles requiring subscription are recent ones and much older papers but 2004 is fair game. -
papertiger at 05:09 AM on 25 September 2007Jupiter is warming
Let's return to the main thrust of your post. You say "Temperature is relatively uniform on Jupiter - the temperature at the poles is nearly the same as at the equator. This is due to the chaotic mixing of heat and airflow from vortices (eg - the White Ovals). The oscillatory motions of the White Ovals ceased after they merged, dampening the movement of heat from Jupiter's equator to its south pole." This is all falsified by observation of the Shoemaker Levi 9 comet aftermath. When the comet hit it created certain shock chemicals which were tracked over the years by Galileo's CIRS; hydrogen cyanide (HCN), carbon monoxide (CO), and carbon monosulfide (CS). The HCN is long lived and provides a footprint to study latitudinal transport. From the paper Jupiter's Atmospheric Composition from the Cassini Thermal Infrared Spectroscopy Experiment -HCN latitudinal distribution. Once produced by shock chemistry during the SL9 impacts, HCN is stable and almost inert in the stratosphere, so that it is a tracer of atmospheric motions. In fact, the peak abundance is still at the impact latitude [emphasis is mine], and the total HCN mass in Jupiter's stratosphere observed between 1995 and 2000 is comparable to what was inferred right after the SL9 impacts in 1994. The sharp falloff of HCN observed at high latitudes cannot be due to chemistry driven by particle bombardment in the auroral regions. Ion chemistry does not break the CN bond but only efficiently recycles HCN. Thus, a dynamical explanation is the most logical explanation, and HCN should provide a powerful constraint on mixing at mid-latitudes in the southern hemisphere by meridional winds and horizontal wave-induced diffusion. The CIRS observations yield a maximum 5° latitudinal shift in the location of peak abundance from the impact latitude, a behavior consistent with a meridional velocity of zero and a spreading due to diffusion. The equatorward spread of HCN is then mostly by diffusive transport. If horizontal diffusion were constant with latitude, the SL9-produced HCN would maximize at the south pole. The most probable dynamical reason for the southward decrease is the inhibition of wave-induced diffusive mixing of HCN in the presence of strong circumpolar winds (vortices) in Jupiter's polar regions. This effect is analogous to the polar vortex that produces a confinement vessel for the Antarctic ozone hole from mid-latitude air in Earth's stratosphere and dynamically isolates polar regions from lower latitudes. Latitudinal temperature gradients measured by CIRS in Jupiter's upper stratosphere indicate the existence of strong polar vortices near 65°N and 65°S, yielding jet streams with eastward velocities of about 20 m s–1 or higher near 1 mbar. Ground-based observations at the Infrared Telescope Facility confirm the presence of a north polar vortex.
So you can see that there was no appreciable latitudinal heat transport for Red Jr. to interrupt. Also this paper proves that Jupiter's polar regions are heated by solar wind particles accelerated to relativistic energy level by the magnetic flux, rather then heat mixing from the equatorial region.Response:There are actually "5 thrusts" to my post, any one of which puts paid to the idea that climate change on Jupiter is due to a warming sun:
- Jupiter's storms are fueled internally, not by the sun
- The changes occuring (eg - disappearance of vortices, creation of Red Spot Jr) are the result of internal turbulence, not an external forcing
- Global warming isn't happening on Jupiter - it's a change in the distribution of energy with more in the equator, less in the poles due to disappearing vortices
- The climate change cited by skeptics (changes of 10 degrees) haven't even been observed yet - they are model predictions
- The sun isn't getting hotter
-
Philippe Chantreau at 01:54 AM on 25 September 2007Other planets are warming
Rereading through Papertiger posts, I thought it would be interesting to address the issue of water on Jupiter. Here is what I found in 10 minutes of straight, basic googling. Observations by the Galileo probe in orbit around the planet led to more information on this subject than the atmospheric probe, which entered over a very dry, cloudless area. This release gives the skinny: http://www.nature.com/nature/journal/v446/n7136/abs/nature05718.html Here is also a cool pic from JPL: http://pds.jpl.nasa.gov/planets/captions/jupiter/watercld.htm I had conversations with proponents of outer SS planetary warming before and for some reason, they seem to be fond of Dr Beebe. She contributed to this paper: http://www.aas.org/publications/baas/v31n4/dps99/212.htm. Overall, it does not seem that Jupiter suffers a lack of water such as to invalidate the convective models proposed by Gierasch and many (most) others. -
Philippe Chantreau at 02:55 AM on 24 September 2007Mars is warming
This seems to be the best work so far on Mars' recent weather: Global warming and climate forcing by recent albedo changes on MarsResponse: Thanks, this was the study I was refering to but I didn't have a direct link to the study. I've updated the page with the link added. -
Philippe Chantreau at 02:36 AM on 24 September 2007Mars is warming
Once again, it is useful to ask ourselves this question about other planets: how unusual is this (the recent southern ice caps sublimation)? This link gives a hint: http://www.msss.com/http/ps/seasons/seasons.html. Consider also that Mars' orbit takes about 589 days, letting us observe only three full seasonal cycles in 5 years. It has long been known that Milankovitch cycles are the best fit to the available evidence for historic glaciation-deglaciation cycles on Earth. The energy source, the Sun, is extra-terrestrial but there is no evidence that it got brighter or dimmer in proportions apt at changing our climate and in any case, that is not what Milankovitch cycles are. As far as I can recall, the energy received changes because of the planet getting closer, farther, or being oriented slightly different, which is a function of its orbit and precession; in that sense, extra-terrestrial is a little misleading, since these qualities could really be called intrinsic to the planet. The point of the paper cited by papertiger is that Earth and Mars' Milankovitch Cycles could be resonant. I wonder if anyone has tried to obtain some level of confirmation from pure celestial mechanics calculation. In any case, it is interesting but quite irrelevant to the current terrestrial warming, which does not correlate well with neither Milankovitch nor with the so-called Martian warming. That Martian warming is really a re-warming back to the kind of weather seen by the Viking crafts, and the Earth should now be heading for cooler climate if only Milankovitch was at play.

Prev 2635 2636 2637 2638 2639 2640 2641 2642 2643 2644 2645 2646 2647 2648 2649 2650 Next


