


 Arguments


Recent Comments
Prev 261 262 263 264 265 266 267 268 269 270 271 272 273 274 275 276 Next
Comments 13401 to 13450:
-
scaddenp at 07:25 AM on 24 August 2018Comprehensive study: carbon taxes won't hamper the economy
indy222, you insert links and images via the toolbar in the "Insert" tab of the comments editor.
My problem is reconciling the graph I constructed from worldindata (which at its base is not too different in source from that used by Garrett) with Garrett's plot.
Also important from the climate perspective, is that while increasing wealth requires increasing energy use, the energy does not have to come from FF.
-
JevonsRevenge at 00:10 AM on 24 August 2018Comprehensive study: carbon taxes won't hamper the economy
scaddenp Thank you for taking this seriously, and setting me straight in a calm, professional manner, despite my unabashed arrogance. I feel a freedom I have not felt since I first stumbled upon Garrett's work years ago.
-
indy222 at 17:25 PM on 23 August 2018Comprehensive study: carbon taxes won't hamper the economy
And note that my graph is linear, not log.
-
indy222 at 17:23 PM on 23 August 2018Comprehensive study: carbon taxes won't hamper the economy
scaddenp, it doesn't look like you even noted how flat the ratio is on the log plot. Over a time when GDP more than doubled and Power more than doubled, and we went through big oil price spikes, plunges, recessions, transformations from a US/Europe dominated world to an Asian one... the Power/Wealth ratio stays within a band only 16% wide and that is easily within the (unstated - what's wrong with economists anyway??) error confidence of the World Bank data. Yours is just not a valid complaint here. You want to see the graph with full spending, including the "shadow economy", and a conservative correction for the under-stated inflation? It's all within a band of only 13%, and the first and last year's data is on top of each other. See slide 238 from LINK Sorry, but I don't see how to insert a .jpg into these responses, only URL's.
Moderator Response:[DB] Shortened link and activated hyperlink.
-
scaddenp at 15:31 PM on 23 August 2018Comprehensive study: carbon taxes won't hamper the economy
The graph trick applies to the ratio of power to GDP. Use Log to make numbers small and then use axis range much large than range of value to claim something is constant.
-
indy222 at 15:09 PM on 23 August 2018Comprehensive study: carbon taxes won't hamper the economy
Here's my last comment for now. Even people who sort of accept that improving efficiency may help us grow, don't quite appreciate exactly how close the relationship is. Realize that it is the actual putting into practice the new energy efficiency that CAUSES the spurt in growth and hence the spurt in total energy consumption. We're like the not-too-bright donkey who's owner on his back is dangling a carrot on a stick and string a foot in front of his nose. Every gallop forward only carries the carrot farther in front to make a mockery of his efforts. Every instance of growth encumbers ongoing new power to support that negative entropy growth in the ordered system called Civilization, AND, it also makes us bigger, badder, better at accessing NEW energy reserves and we take full advantage of that. CO2 emissions grew 2% last year, and are expected to grow another 2% this year, and again in '19. Hence accelerates our energy consumption in total. That's what history shows, right up to the present. And for decades now, the fraction of that energy consumed which must be carbon emitting, has not improved. A constant fraction of an exponentially rising total primary energy consumption, is an exponentially rising CO2 emission rate, and an upward arcing atmospheric CO2 - which is exactly what we see right up through the present moment. We're not decarbonizing anywhere near fast enough to change this. And, if we tried, we'd have to work HARDER, and that means spending MORE energy to accomplish that mission, and that means MORE CO2 emissions to get to a day of smaller fraction of CO2 energy sometime in the future. We're between a rock and a very hard place.
I'm not arguing against trying to improve energy efficiency. But it's not our salvation. We've done it forever, and it's only gotten us to this very frightening place. We need improving energy efficiency AND Tibetan-monk level belt-tightening in our consumption at the same time. BOTH. Channeling every dollar not essential for survival, into decarbonizing.
-
indy222 at 14:55 PM on 23 August 2018Comprehensive study: carbon taxes won't hamper the economy
Equally vital to understand, is that this "Garrett Relation" is ONLY applicable to GLOBAL power and global spending. California is meaningless. So is the U.S., So is Europe. Only the total globe is relevant. Trade in materials, energy, money across borders render looking at individual countries or continents meaningless. They are not "closed systems" and don't obey simple thermodynamics. But then, ths same is true of CO2, which is well-mixed and climate too is a completely GLOBAL phenomenon. We NEED to consider both CO2 and economics only in a global context. You'll fool yourself if you try to make generalizations based on regional data. There's a perfect correlation between the fraction amount of our manufacturing which we've outsourced to China and the apparent improvements in our efficiency of GDP per unit of power. Very convenient - China gets the bad rap and the CO2 guilt, and we get the rosy-looking energy graphs as their goods come back to the U.S. See.... LINK
Next, realize that achieving energy efficiency is not new. We've been continually and strongly and consistently improving the efficiency with which energy produces wealth. It is not in conflict with the Garrett Relation (GR). As long as global GDP is growing faster than energy efficiency, there need be no conflict between constantly improving energy efficiency and Power/Wealth=Constant. What's really interesting is that if you look at recessions, when d(GDP/dt is negative, then to be consistent with the GR then energy efficiency trends must reverse and get worse. What's interesting is that the "fake data" from China during their economic contractions shows exactly this. Overstated GDP (for political reasons) makes their local Power/Wealth look better than it is. Even taking the official World Bank figures at face value shows that energy efficiency improvements halt during each of the recessions of the past 30 years over which they give data. Again, those figures are in the pdf of the powerpoints presentation I have on this subject LINK
Moderator Response:[DB] Shortened URL and activated hyperlink.
-
indy222 at 14:32 PM on 23 August 2018Comprehensive study: carbon taxes won't hamper the economy
Let me clear up the misunderstanding. Cullenward's bogus criticism only betrays that he didn't pay attention while reading Garrett's paper(s). The "Garrett Relation" that "Power/Wealth= Constant" means the following: "The global Current Power Consumption rate is directly proportional to the sum total of all GWP spending over all time (==Wealth)". Cullenward assumed he was saying that GWP is proportional to power. But that's false, it's the SUM TOTAL of ALL GWP over ALL TIME, that is proportional to current power. I am writing a paper with Tim Garrett as co-author which shows that this relation is even better obeyed than Garrett's original paper showed, as there are sublties to how inflation is corrected, how different currencies are calibrated, about the "shadow economy", and a bias in GDP reporting from big countries like China which skew official figures as well. Don't confuse the fundamental "Garrett Relation" with the much less significant CO2 vs GDP graph. That graph Garrett himself down-plays, but it's interesting as a visual proof at how badly we're doing in de-carbonizing. Back to the Garrett Relation; Jevons' Revenge (my term, I hope it catches on, to distinguish from the original "Jevons' Paradox" by Jevons himself, which is more restricted and so not relevant here) says that all improvements in energy efficiency result in MORE total energy being consumed. Because human civilization is driven (genetically?) by the goal to achieve the most rapid, efficient growth possible, and improving energy efficiency aids the expansion of civilization. The point of Jevons' Revenge is that any savings resulting from energy efficiency WILL BE SPENT, and it doesn't matter where, because the Garrett Relation shows that ALL spending sum totalled over all time, remains proportional to current energy consumption rates. It is explicitly in the mathematics of the CThERM model which includes the Garrett Relation and which is very well verified in historical data right up to the present. Now, the carbonization of energy is a parameter in the model which you can tune any way you feel is realistic, but Garrett has made a few projections under the assumption of (A) no decarbonization (that has been the history of the 21st century so far) and (B) decarbonize exponentially with a halving time of 50 years; meaning the CO2 emissions per joule of energy expended, is cut in half every 50 years. Both result, with a wide range of assumptions of the resiliencey of civilizataion to the decays caused by climate change, to increasing CO2 at different rates. If we REALLY got serious, we could do better than t(1/2)=50yrs, but so far, we're doing nothing remotely like this. FF's are still growing at an absolute rate that is about equal to that of renewables, so that the % of global energy from FF's has remained about 83% the entire 21st century so far.
-
JevonsRevenge at 13:47 PM on 23 August 2018Comprehensive study: carbon taxes won't hamper the economy
scaddenp This, he claims to be a linear plot of the same data. Is the same trick present here?
 Moderator Response:
[DB] Shortened URL and activated link. Reduced image width.
-
scaddenp at 12:08 PM on 23 August 2018Comprehensive study: carbon taxes won't hamper the economy
Jevons, the energy production has increased and it mostly comes from FF, then CO2 of course continues to rise. The ratio of power to wealth however is about how efficiently we generate wealth from that power. Those graphs show we are getting much more efficient at generating wealth from power. Also, the longer time interval gives a better perpective.
Looking at Garret's graph, I havent tried to reproduce from his sources, but I note that he is plotting power/wealth on a log axis which covers a much larger range than the actual data. In short, a well-known graphing trick.
Frankly, I think my plot is better.
-
JevonsRevenge at 11:33 AM on 23 August 2018Comprehensive study: carbon taxes won't hamper the economy
@michael sweet Thank you for sharing Cullenward et al's criticism! The last time I tried accessing it, all but the abstract was hidden behind a paywall. I look forward to reviewing these criticisms.
-
michael sweet at 10:48 AM on 23 August 2018Comprehensive study: carbon taxes won't hamper the economy
Jevons Revenge,
Perhaps the extra CO2 is coming from thawing permafrost, methane clathrate decompositon or released by forest fires. There is no reason to believe that nature will continue to absorb all we emit at the same rate.
This SkS article indicates that we may be near, or already past, a point where the climate tips against us and natural releases of CO2 control the temprature no matter what we do.
-
michael sweet at 10:37 AM on 23 August 2018Comprehensive study: carbon taxes won't hamper the economy
Jevon's revenge,
Tim Garrett, the author of the blog you cite, has had a lot of criticsm of his work. Since he also claims that humans cannot affect the climate, in contradiction to what anyone who reads the newspaper can currently see, perhaps his data is off. I note that your graph at 43 is truncated at the year 2000. Where I live it is 2018. A lot of progress has been made in producing more GDP per unit energy since 2000. Scaddenp's graph appears closer to what I would expect to see.
Since he is not mentioned at Desmog Blog he must be a minor character in the Climate Debate.
-
JevonsRevenge at 10:36 AM on 23 August 2018Comprehensive study: carbon taxes won't hamper the economy
@scaddenp this is Garrett's original paper on the subject, detailing how the relation is derived: link.springer.com/article/10.1007%2Fs10584-009-9717-9
Offhand, I know it used inflation-adjusted 1990 US dollars to calculate global wealth. It's also worth noting that China and several other developing nations have over-reported their respective GDPs and under-reported their energy usage. After all, the continued increases in atmospheric CO2 have to be coming from somewhere, right?
-
michael sweet at 10:18 AM on 23 August 2018Comprehensive study: carbon taxes won't hamper the economy
Jevons Revenge,
Since California only generates 1% of global CO2 source, how big of a dent do you expect to see? Even if California completely stopped using fossil fuels it would be impossible to see on a graph of world emissions. Is your question serious??
In order to solve the CO2 problem everyone has to contribute. Each countries emissions by itself does not make muc hdifference. When the US refuses to control emissions it delays other countries emission reductions. A classic tragedy of the commons.
-
scaddenp at 10:05 AM on 23 August 2018Comprehensive study: carbon taxes won't hamper the economy
Trying a very quick Excel plot and using data from ourworldindata.org/ I do not reproduce your constant relationship between wealth and power. World GDP in 2011 international dollars, Energy is primary energy production. I get:

I would say world is getting more efficient at using energy to create wealth and that ratio to fossil fuel is dropping more steeply than that of total energy use. What is the source of your data?
-
JevonsRevenge at 09:46 AM on 23 August 2018Comprehensive study: carbon taxes won't hamper the economy
I recently asked Katharine Hayhoe about this. She said that FFs and economic growth have already begun to decouple, citing this report from California: arb.ca.gov/newsrel/newsrelease.php?id=933 If this is true, where is the California-sized dent we would expect in Global CO2 levels, and why does the Keeling curve continue to show CO2 level growth at *precisely the same* rate as it did before California enacted these policies?
Moderator Response:[JH] Enacting policies and fully implementing them are two different things.
-
scaddenp at 09:09 AM on 23 August 2018Comprehensive study: carbon taxes won't hamper the economy
I dont think there has been much effort to get off FF yet but the past is no reason to say that we cant do so. Especially as renewables get to point where they can compete with FF on price without subsidy. I will willingly concede power/wealth not changing much but no reason to assume that power=FF into the future. I am willing to bet you could draw similar graphs for animals of burden and water wheels which would suddenly go off trends as technology changed. Give it another decade or so especially we inact actually effective policy.
-
JevonsRevenge at 08:57 AM on 23 August 2018Comprehensive study: carbon taxes won't hamper the economy
@scaddenp it's not a belief, it's an observation, though I suppose that's not evident from this particular graph.
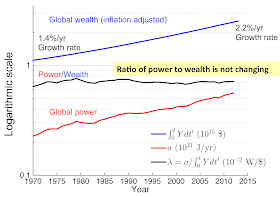
This one shows the trend persisting into more recent years. The growth rates of Global Primary Energy production (Global power) and Global GDP accumulated (Global wealth) have remained constant for at least as long as we have been keeping records, and this trend continues unabated despite all our attempts to free ourselves from it.
There is no evidence in the data that any policy measures, individual actions, or technologies implemented to date have made any difference in fossil fuel consumption on the Global level.
Moderator Response:[DB] Shortened URL and activated hyperlink.
-
One Planet Only Forever at 14:21 PM on 22 August 2018State of the climate: 2018 set to be fourth warmest year despite cooler start
Mal Adapted,
The likes of Roy Spencer could learn a lot from Sean Carroll's book "The Big Picture" published in 2016. It is an extensive presentation of the developed improved awareness and understanding of what is going on, including how the human mind works.
It was a NY Times Bestseller. However, it did have critics, mainly the angry group of evangelical purists that disliked the way that Carroll explains that our current understanding of what is going on in our Universe does not require an Intelligent Designer, and the way he effectively makes the case that it is unlikely that there is a God-being influencing what is going on.
So the likes of Spencer would not likely learn anything from reading Sean Carroll's book.
As you say, they have already decided not to be open to improved awareness and understanding. They deliberately limit their scientific methods and critical thinking to the defense of the limited worldview they have personally chosen to try to hold on to and defend.
Sadly, scientific investigation and critical thinking can be very harmful when it is applied by people who are not open to a holistic worldview (not liking the understanding presented by Sean Carroll), and who are focused on narrow-minded selfish interests (not interested in more altruistically helping to develop a sustainable better future for humanity).
More people need to develop improved awareness and understanding of what is really going on and strive to help develop a sustainable better future for all of humanity (all of the future generations), rather than seeking excuses for a sub-set of current day humanity getting away with an unsustainable activity that is undeniably harmful to future generations (and harmful to a significant portion of current day humanity).
-
sailrick at 13:55 PM on 22 August 2018Sunshine Blogger Award
I think Tamino's Open Mind blog is worthy of a nomination
-
scaddenp at 13:07 PM on 22 August 2018Comprehensive study: carbon taxes won't hamper the economy
Why do you believe that the relationship would continue to exist if we transitioned off fossil fuels? This tells you about the past but it doesnt have to be our future. Not to mention being fairly skeptical log/log plots and estimates of world GDP pre-1700.
-
scaddenp at 12:58 PM on 22 August 2018State of the climate: 2018 set to be fourth warmest year despite cooler start
And for further perspective on the what 80N means. The area north of 80N is ~4M sq kms (slightly less). The arctic region is 14.5M sq kms. The area of the arctic ocean is 15.5M sq km. Area of globe is 510M sq km.
-
JevonsRevenge at 12:17 PM on 22 August 2018Comprehensive study: carbon taxes won't hamper the economy
It's telling that the study only examines the future evolution of the U.S. economy. Truly, this is a shockingly naïve oversight of epic proportions.

"Consider the above plot, which shows the relationship between the atmospheric concentration of CO2 above a baseline of 275 ppm and the world’s total GDP, adjusted for inflation to 1990 dollars (see Garrett, 2012 for details). Data is taken from a mixture of ice cores for older dates and gas samples for newer dates.
What is immediately evident is that, on a log-log plot, there has been an extraordinarily tight relationship between GDP and CO2 concentrations for at least 2000 years. As long as we look at global scales, each ten-fold increase in GDP has always corresponded with an approximate four-fold increase in excess CO2."
Moderator Response:[DB] Shortened URL and activated hyperlink. Reduced image width.
-
michael sweet at 10:25 AM on 22 August 2018State of the climate: 2018 set to be fourth warmest year despite cooler start
Bob Hoye,
From the OP:
"The Arctic has been strikingly warm so far this year, with many areas 3C warmer than the global average."
But if you want to cherry pick only a tiny fraction (80 North) for only part of the year (summer only) than everything looks great!
Who gives you your cherries? I also suspect Steve Goddard.
-
Mal Adapted at 09:21 AM on 22 August 2018State of the climate: 2018 set to be fourth warmest year despite cooler start
nigelj:
According to wikipedia, Roy Spencer who compiles the UAH data is an agw climate change sceptic to some extent, and has strong religious fundamentalist views and has signed declarations that say our climate change is natural.
Well, Spencer signed An Evangelical Declaration on Global Warming, which states:
WHAT WE BELIEVE
We believe Earth and its ecosystems—created by God’s intelligent design and infinite power and sustained by His faithful providence —are robust, resilient, self-regulating, and self-correcting, admirably suited for human flourishing, and displaying His glory. Earth’s climate system is no exception. Recent global warming is one of many natural cycles of warming and cooling in geologic history....
WHAT WE DENY
We deny that Earth and its ecosystems are the fragile and unstable products of chance, and particularly that Earth’s climate system is vulnerable to dangerous alteration because of minuscule changes in atmospheric chemistry. Recent warming was neither abnormally large nor abnormally rapid. There is no convincing scientific evidence that human contribution to greenhouse gases is causing dangerous global warming....
Ellipses represent arguments from consequences, boiling down to "mitigation will harm poor people."
IOW, evidence be damned: AGW can't be a threat because God wouldn't allow it. By signing this document, Spencer has publicly announced his determination to fool himself, and IMHO has forfeited all scientific credibility thereby.
-
scaddenp at 07:40 AM on 22 August 2018State of the climate: 2018 set to be fourth warmest year despite cooler start
I am not sure quite information you think the DMI is giving you, but if that is the only temperature record you look at, then surely you should look at what DMI itself have to say about the record and what it is fit for. Ie it is not a climate data record. Furthermore, if you have watched over a no. of years you will notice that there is very low variability in the mid summer temperatures (generally stuck at just above zero) especially compared to the winter temperatures. Reason? Above 80N is mostly ice. The air temperature above ice is forced to close to 0C or below because the insolation goes into just melting the ice. While the ice persists, temperature will be nearly constant. Looks to me like you are looking for a record that makes you feel comfortable about doing nothing but unfortunately this isnt the one if you understand what it tells you. Did you find the more complete analysis of snow cover statistics that I pointed you to comfortable? Or did you choose not to follow the link because winter snow cover fits what you would like to believe whereas spring and summer are unconfortable?
Furthermore the extraordinary high temperatures in winter on DMI is by contrast a real cause for concern - linked to other unpleasant weather phenomena.
Cherry picking one aspect of Greenland ice balance while ignoring the larger picture is also not convincing. I dont suppose your opinions are being "informed" by Tony Heller aka Steve Goddard instead of science?
-
nigelj at 07:35 AM on 22 August 2018State of the climate: 2018 set to be fourth warmest year despite cooler start
Please can people get their facts right before they post stuff on the net (me included). I just feel I wasted a few minutes of my life readings Bobs post about one single unexceptional summer north of 80 degrees.
Having said that, the heatwave is causing big issues in the arctic sea ice right now
-
MA Rodger at 03:58 AM on 22 August 2018State of the climate: 2018 set to be fourth warmest year despite cooler start
Bob Hoye,
The DMI 80N temperature reanalysis you are examining is not presented in a manner that allows a useful understanding of trends in high Arctic temperatures. Recently they have added a page showing the seasonal temperature record and you will note the summer temperatures show no rise. If the data through the year is plotted out as decadal averages (usually 2 clicks to 'download your attachment'), the increase in temperatures through autumn-winter-spring can be plainly seen as can a small reduction in summer temperatures, this due to the melt up in the high arctic now sucking energy out of the climate system.
-
Bob Hoye at 01:54 AM on 22 August 2018State of the climate: 2018 set to be fourth warmest year despite cooler start
Mod.
Sorry did not wish to be obscure. Full Title:
Arctic Temperatures
Daily Mean Temperatures North of 80 degrees North
Archived, each year, back to 1958.
Moderator Response:[DB] Again, Temperatures North of 80 degrees in the Arctic are not very representative of global temperatures. However, if you want to look at Arctic temperatures, then you need to compare modern temperatures in the Arctic to those of previous centuries for full context. From Shi et al 2012:
"20th century warming reverses a long-term orbitally driven summer cooling and that the mid-and late 20th century temperatures were the highest in the past 2 millennia"
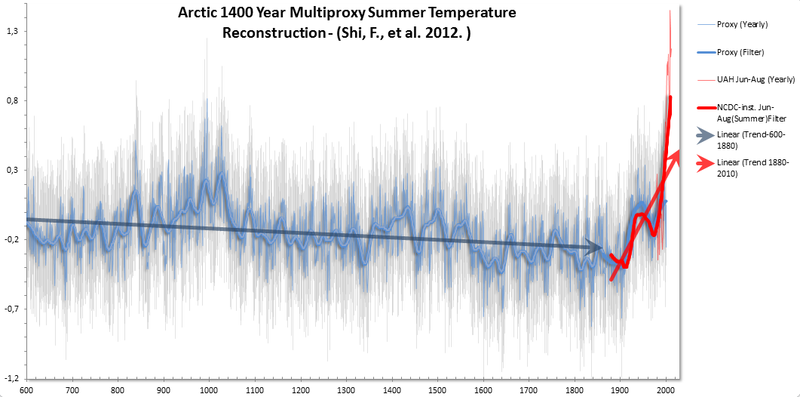
The above conclusions and results were confirmed by Werner et al 2018, which also found:
"the instrumental data suggest much warmer temperatures in the last decade (2006–2015 CE)"
-
Bob Hoye at 00:09 AM on 22 August 2018State of the climate: 2018 set to be fourth warmest year despite cooler start
Lengthy article.
I keep it simple for myself by following the Danish Met Institute (DMI) stuff. Their temperature of "North of 80" has been below the mean for most of the melt season. Their Surface Mass Balance of ice on Greenland has been well above the mean, and their chart of the rate of melt is shutting down fast. Well, this is on schedule.
The Canadian Cryogenic chart of NH and NA snow-cover extent for July and into August has been above the mean.
I think that these numbers are reliable, but my issue for the snow cover is that the charts are not updated every day. Seems to be every ten days.
Moderator Response:[DB] "North of 80" is nowhere near a global metric. Further, Greenland Ice Sheet (GIS) surface mass balance (SMB) is only a metric pertaining to snowfall additions in the accumulation zone, and do not reflect losses at the lower perimeter edges, in the ablation zone of the ice sheet. So SMB is a misleading metric and should not be used, even for the GIS itself.
Per the DMI itself:
"Over the year, it snows more than it melts, but calving of icebergs also adds to the total mass budget of the ice sheet.
Satellite observations over the last decade show that the ice sheet is not in balance.
The calving loss is greater than the gain from surface mass balance, and Greenland is losing mass at about 200 Gt/yr."
-
nigelj at 20:19 PM on 21 August 2018Sunshine Blogger Award
Well done and fully deserved.
Heres a little thing that has worked for me. I like rock music, but when working I have got into the habit of listening to classical instrumental music like Bachs or Mozarts piano music. I'ts light sounding, and not distracting.
-
scaddenp at 12:20 PM on 21 August 2018State of the climate: 2018 set to be fourth warmest year despite cooler start
Well UAH, RSS and STAR use MSU to produce temperature records for lower troposphere (think averaging over lower 4km of atmosphere), whereas the surface records are well surface temperature records. Recent discussions of UAH versus RSS at Tamino.
RSS publish their methods with new release, Spencer and Christy, not so much plus a record of mistakes. See here for some history.
Their history and political leanings however is not a reason to reject UAH. Perhaps a better way is to compare temperatures from RSS and UAH against say radiosonde data (RATPAC). Difficult but doable. See here from David Piepgrass and draw your own conclusions.
-
nigelj at 08:10 AM on 21 August 2018State of the climate: 2018 set to be fourth warmest year despite cooler start
The biggest difference seems to be between the UAH satellite temperature data and everything else particlualry the RSS data.
Its hard to see why there's such a difference between UAH and everything else. Why is Roy Spencer right and everyone else wrong? He would need a compelling reason, so what is it? Does anyone have technical knowledge on it?
According to wikipedia, Roy Spencer who compiles the UAH data is an agw climate change sceptic to some extent, and has strong religious fundamentalist views and has signed declarations that say our climate change is natural.
-
Evan at 13:06 PM on 20 August 2018Climate change and wildfires – how do we know if there is a link?
Global warming is different. Switching refrigerants is easy compared to burning fossil fuels without producing CO2. CO2 is not a pollutant, it is simply what you get when you burn fossil fuels. There is no easy fix except to not burn fossil fuels.
-
william5331 at 08:27 AM on 20 August 20182018 SkS Weekly Climate Change & Global Warming News Roundup #33
Hi Nigelj
It is an interesting balance. If humid air rises from the ocean and blows accross to Greenland, indeed this could result in more snow. On the other hand, The specific heat of the phase change from water vapor to water is about 5 times as great as the heat of the phase change from ice to water. In other words, a liter of water condensing out of air which is warmer than the ice it comes in contact with gives out enough heat to melt 5kg of ice. Moreover, if this contact occurs, let's say, at the top of Greenland, 3km above sea level, and the air is made more dense by the cooling effect of the ice, air density currents are created with the denser air pouring down the sloping ice. From 3km up to sea level the compression of the air would heat up the air almost 30 degrees C. Of course it wouldn't actually heat up. This heat would be given up to the ice, melting more ice. A fascinating problem in balancing temperature, pressure latent heat and wind direction. My guess would be more snow initially but at some point hugely increased melting of Greenland.
-
Tom Dayton at 07:03 AM on 20 August 2018Water vapor is the most powerful greenhouse gas
Silbersulfid: No one claims temperature is the only influence on humidity. Everyone agrees that other factors also affect humidity. Your assertion that anyone thinks temperature is the only influence, is a “straw man” argument. That means you constructed a straw man just so you could claim victory in knocking it down.
Those other factors, plus variations in temperature locally in time and locally in space, plus the probabilistic nature even of the dependence of humidity on temperature, all together are responsible for relative humidity being less than 100% (and more than 100%) often and in many places—even over bodies of water. No one disputes that. Despite all that variation of humidity over time and space, it is perfectly legitimate, sensible, and useful to compute average humidity over time and space.
Temperature can increase without any of those other factors changing. That increases the water-vapor carrying-capacity of the air everywhere that the temperature has increased—in other words, the relative humidity has decreased. But that reduction is fleeting, because quickly the newly extra carrying capacity is filled by extra water vapor molecules—in other words, the relative humidity quickly returns to whatever it was before the temperature increased. The new presence of more water vapor molecules is described as an increase in absolute humidity. All that happens without changing the variabilities of both relative and absolute humidities across time and space.
-
nigelj at 06:52 AM on 20 August 20182018 SkS Weekly Climate Change & Global Warming News Roundup #33
Good comments Swayseeker, but wouldn't evaporation from warming oceans primarily cause more snow to form rather than to melt?
-
william5331 at 06:19 AM on 20 August 20182018 SkS Weekly Climate Change & Global Warming News Roundup #33
On the other hand, in the short term, there could be short periods of severe cooling of the Atlantic as the warmer conditions greatly accelerate the melting of Greenland and the more mobile ice exits the Arctic ocean in larger amounts. The corollary is that tropical waters will warm up as the heat is not exported to the north with some very nasty stroms as a result.
-
Silbersulfid at 05:51 AM on 20 August 2018Water vapor is the most powerful greenhouse gas
@Eclectic: Ok I see your point, that makes sense. I see that we agree on the topic of water molecules and IR transmission.
But you say, that "warmer air will contain more water vapor molecules - on average. And on average, more water molecules will reach the high altitudes". But where do you take this wisedom from? There must be a whole lot more factors, which influence the amount of water vapor molecules in air (also called humidity, and relative humidity being the humidity related to the maximum possible humidity for air of a special temperature). I could imagine that wind, cloud coverage and cloud condensation nuclei would influence the humidity of air as well, to just name a few. But I am not originally a meteorologist or a clima scientist, so for weather phenomena you should be way more firm than me. To me it seems just very over-simplified to assume that the humidity is solely a function of temperature and nothing else. It also makes absolutely no sense to me to refer to the "Clausius–Clapeyron Relation", since this relation only describes the maximum capacity of water in air, but not the actual humidity air will have for a certain temperature. So when you never refer to 100% relative humidity (which means that the air actually reached its maximum capacity of water), there is absolutely no use then to mention this relation, and to mention that air can hold more water now. When air never holds is maximum capacity, why mention that the maximum capacity just increased? This seems to be totally irrelevant. -
Eclectic at 00:56 AM on 20 August 2018Water vapor is the most powerful greenhouse gas
Silbersulfid @327 :
I placed the term "optical density" in quotation marks because it is a term that really belongs in a different field (in certain liquid measurements). Sorry, if that was leading your thoughts into an unhelpful direction. I was hoping the term would suggest to you the idea of — how far the Infra-Red photons can penetrate into a volume containing a large number of water vapor molecules.
At low altitudes, the IR photons can travel only a very short distance before being absorbed by another water molecule. At sufficiently high altitude (where the inter-molecular distances become extremely large between water molecules) it becomes possible for significant numbers of IR photons to avoid re-absorption and escape to "outer space".
It is the density of water molecules which controls the IR energy escape. In other words, it is the absolute distance between molecules. Therefore it is irrelevant whether the "relative humidity" is a bit higher or a bit lower (at this high altitude).
Warmer air will contain more water vapor molecules — on average. And on average, more water molecules will reach the high altitudes where their IR emissions will be lost to space.
Therefore it is completely unnecessary to have 100% Relative Humidity. Relative Humidity is irrelevant to the greenhouse mechanism. It is all a matter of inter-molecular distances. (And of course, the rate of IR energy loss will be related to the air temperature at this altitude.)
-
Swayseeker at 00:16 AM on 20 August 20182018 SkS Weekly Climate Change & Global Warming News Roundup #33
With ocean warming there is going to be more evaporation and a higher specific humidity and this will increase snow melting. People might find it strange that the albedo of fresh snow is 0.90 or so (it reflects about 90% of solar radiation and only absorbs about 10%), yet the absorptivity of snow can be about 99% (absorbs 99% of the radiation falling on it). The albedo refers to absorptivity of sunlight (solar energy) and the absorptivity here refers to the absorptivity of the usual radiation (about 3 microns to 100 microns in wavelength) from objects on earth. So snow acts almost like a blackbody concerning normal temperature objects around it, absorbing practically all radiation received from surroundings, but is a good reflector of sunlight (reflecting about 95% of solar energy). The atmosphere radiates mostly radiation of wavelengths from about 5 to 8 microns in wavelength and from about above 14 microns. So practically all radiation from the atmosphere is absorbed by snow and most radiation from the sun is reflected by snow. Because atmospheric radiation is increasing I am saying we are going to see rapid melting of snow and ice. I have free Delphi code for night radiative cooling at www.facebook.com/DelphCode/. So solar absorptivity of snow could be about 0.1 and absorptivity for snow for the normal radiation from objects at the earth's surface could be about 0.99. The "downwelling sky radiation code" at the above site could help you determine whether snow will melt at night.
-
Swayseeker at 00:08 AM on 20 August 20182018 SkS Weekly Climate Change & Global Warming News Roundup #31
More fire tornadoes with more water vapour: I want to propose this theory (which I have not seen any site mention): A fire can reach 800 deg C or so. Water vapour and CO2 in the atmosphere absorb radiation of 0.82 to 3.2 microns in wavelength and also in about the 4 to 8 microns range. Now an 800 deg C fire radiates about 36.9% of its radiation in the 0.82 to 3.2 range and about 20.1% of its radiation in the 5 to 8 micron range. With more carbon dioxide and more water vapour in the air the heating of the air by fires could be causing more more convection and therefore oxygen to be supplied to fires and more fire tornadoes.
-
Silbersulfid at 23:21 PM on 19 August 2018Water vapor is the most powerful greenhouse gas
@Eclectic: True, all the water vapor has to be considered, not just the vapor at ground level. But I would not say that relative humidity is irrelevant. Because when you talk of a 'water vapor feedback', you imply that the increased capacity for water in air also will be used. But that does not follow logically.
We know that relative humidity in higher altitudes is quite low. So when we have, let's say, 5 g/m^3 water capacity in air at a height of 10 km, but we only have a relative humidity of 20% (this would result in 1 g of water per m^3), then what is the effect of increasing the capacity to, let's say, 6 g/m^3? There will be no effect, because increasing the maximum limit (due to a higher temperature) will not automatically rise the water level in the atmosphere. The water has to come from somewhere. And if there would have been water available, it could have evaporated in the air before, because the air was not saturated with a relative humidity of 20%. Or in other words: In order for the water vapor feedback to be logically, you must assume a relative humidity of 100% at all times and all locations. Or you have to provide another law which links the value of relative humidity to temperature only, and thus makes relative humidity a function of temperature only and no other effects.
To your second paragraph: I think you are mixing up some fundamental different terms. What you mean is the absorbance (https://en.wikipedia.org/wiki/Absorbance) of a material. The absorbance defines, how much radiation will be absorbed by the material. The more molecules there are, the more radiation will be absorbed. How much radiation will be absorbed per molecule is defined by the 'molar attenuation coefficient' (https://en.wikipedia.org/wiki/Molar_attenuation_coefficient), which is an intrinsic property, and thus will *not* change in higher altitudes. Thus water vapor at ground level and in high altitudes should be equally effectively, at least concerning this parameter.
What indeed does change with higher altitudes (because with higher altitudes pressure changes as well), is the optical density as a synonym for 'refractive index'. But this index does not specify how much radiation will be absorbed by the material, but rather how fast electromagnetic waves travels through the material.@scaddenp: I looked up your reference. I found a graphic in the latest report (AR5): Figure 2.31 (b). It is not a good graphic, considering the fact that the axis label says something different than the description, and that the reverence value for the diagram is never stated. But one can see a trend that the water vapor is rising. This is not very surprising knowing that water vapor is a greenhouse gas and that the global temperature is also rising. But how can you be sure, that the rising water vapor is the effect, and not the cause of the rising global temperatures? When reading the text, though, there is a very interesting statement: "Satellite measurements also indicate that the globally averaged upper tropospheric relative humidity has changed little" (AR5, Chapter 2.5.5.3). This would be at least an indication (but not a prove), that relative humidity is indeed a fixed value and does not fluctuate randomly. The only problem is: This statement is not proven sufficiently. Because when looking up the original source referenced in the AR5 (Shi and Bates, 2011), the authors never make such a statement. Anything I missed, or any other remarks?
-
nigelj at 18:29 PM on 19 August 2018Climate change and wildfires – how do we know if there is a link?
I agree those of us talking about the dangers of climate change have to try to lead by example. I have done some things. I own a small home and drive a small petrol car by choice, and I only use it a couple of times a week. Our public transport is very good. I don't fly very much
But I don't want to sound sanctimonious. Some of those decisions were made for several reasons, I can be indecisive, and I buy some utter rubbish at times, and my heaters are also not very efficient, and I never get around to doing anything about it. Etcetera.
However I dont think anyone expects people to cycle or be cold. I loathe being uncomfortable, so its off the agenda.
But here's another thing. We resolved the ozone problem by using new types of refrigerants, and it was virtuaully entirely an industry issue. Nobody expected people to go without fridges, so we have to keep the climate issue in a similar perspective.
-
scaddenp at 15:15 PM on 19 August 2018Water vapor is the most powerful greenhouse gas
There would be doubts about water feedback if measured total precipitable water differed from models. This comparison is discussed in opening observations chapter of the latest ipcc report. German translation is available I believe, so I strongly suggest that you check.
-
Evan at 13:06 PM on 19 August 2018Climate change and wildfires – how do we know if there is a link?
alea@17 Quite a change of lifestyle. I understand your points and mostly agree. I do not bicycle because of the dangers, yet we made the change to an EV. Not perfect, not enough, but a step.
I can't argue against your points from the perspective of people choosing the easy path. This is human nature. I am changing my lifestyle because I feel it is incumbant on those of us who are leading the efforts to do so.
If people could connect the dots beween their driving and a more difficult life for their children and grand children, I think that would make a big difference in how people responded.
We also don't know what factors will cause a person to change. We may push gently for years and one day a sequence of factors may come together to cause another person to change. We must set the stage with our actions and keep the pressure on, so that when those opportunities for change come, people are somewhat prepared by positive examples of others, such as what you've been doing.
Where I respectfully differ from your view is that I see the individual action as paramount. I'm not calking about the effect of one bicycle on the rode versus thousands of cars in reducing air pollution, I'm talking more about setting the example and letting others know that the status quo is not acceptable. At a rollerskating rink where we work, a school group came in for a session and brought their own food for the kids. It inlucded some stuff they liked and some fruits and vegies a lot of the kids did not like. A lot of perfectly good food ended up in the trash. So I stood outside in the dumpster for about 30 minutes digging through the trash pulling out the good food. To me this is the worst transgression in the developed world: to throw away perfectly good food. So here I am driving a modern EV and digging through a dumpster to pull out good food. My wife started personally recylcing stuff at the rink that was being thrown away, and now others help her with the recycling effort. I think that deep down people have a sense of what is right and wrong, and they need to be pushed in the direction doing the right thing.
So I really don't disagree with your assessment that it is too easy to do the convenient thing, just saying that there is not time to wait for action to come down from on high. We must act individually if we are going to turn this thing around.
-
Philippe Chantreau at 10:44 AM on 19 August 2018Pluto is warming
The commenters above only show they have not read the materials below and others related to TSI variations.
Pnyikos says "More discussion is needed!"
No, it's not. If the sun's output was to increase enough to cause a temperature increase on Pluto so large that it would be observable from Earth, we might as well kiss our bunnies good-bye. The effect would be seen on Earth first and would be of such concern that discussions about Pluto would be delayed until the emergency abates. There is no way that the sun could warm Pluto and we see nothing on Earth first. That is the height of idiocy. Variations on Pluto are going to tell us things about Pluto, not about Earth. We watch the sun closely from here and its output variations are so minute that we could not effectively measure them before satellites. Get real. The Pluto argument is the most grotesque piece of nonsense ever spewed up by deniers. Only one with no quantitative thinking skills whatsoever could be swayed by such drivel.
-
Eclectic at 09:29 AM on 19 August 2018Water vapor is the most powerful greenhouse gas
Silbersulfid @324 :
When considering the greenhouse effect of water vapor, you need to be interested in the absolute water vapor densities in the upper troposphere — not at the ground-level meteorological stations. Relative humidity is irrelevant.
At low altitude, water vapor has a very high "optical density" [to the appropriate Infra-Red wavelengths]. At high altitude, the water vapor density becomes thin enough for IR radiation to escape from the Earth's atmosphere. The high altitude temperature determines the rate of loss of IR energy. (A similar mechanism operates for CO2, but at different wavelengths and altitude, natuerlich.)
-
alea at 08:41 AM on 19 August 2018Climate change and wildfires – how do we know if there is a link?
Just spotted an error, I meant to say at the beginning that there is a big difference between talking the talk, and walking the walk.
Prev 261 262 263 264 265 266 267 268 269 270 271 272 273 274 275 276 Next


