


 Arguments


Recent Comments
Prev 280 281 282 283 284 285 286 287 288 289 290 291 292 293 294 295 Next
Comments 14351 to 14400:
-
Nick Palmer at 22:45 PM on 9 May 2018The 1970s Global Cooling Zombie Myth and the Tricks Some People Use to Keep it Alive, Part II
My memory of the time was that the media articles mentioned increasing pollution (particulates and acid gases - remember 'acid rain'?) on top of the slow slide towards the next glaciation, due to the current state of the Milankovitch cycles, plus there was also concern about a 'nuclear winter' (a lot of dust thrown up) should a war break out adding a lot to the several cooling elements.
It's pretty clear from the 1940s onwards cooling that pollution from the expanding use of fossil fuels was temporarily overwhelming the global warming from their use until we started cleaning up the smoke stacks - not that I'm suggesting that a solution to global warming should involve us choking ourselves with a lot of smoke again! -
michael sweet at 19:43 PM on 9 May 2018Increasing CO2 has little to no effect
User 1001,
I could not find a reference that exactly matched your question.
Most (90%) of the atmospheric ozone is in the stratosphere. It blocks incoming UV radiation and protects the Earth's surface. This ozone has degraded in recent decades from attack by chlor-flouro chemicals. The Montreal Protocol has strated the healing process for stratospheric ozone.
At the surface of the Earth (the troposphere) the situation is different. Here ozone is created by pollutants humans release into the atmosphere. The concentration of ozone in the troposphere is increasing. Wikipedia says:
"Quantifying the greenhouse gas potency of ozone is difficult because it is not present in uniform concentrations across the globe. However, the most widely accepted scientific assessments relating to climate change (e.g. the Intergovernmental Panel on Climate Change Third Assessment Report)[47] suggest that the radiative forcing of tropospheric ozone is about 25% that of carbon dioxide."
Ozone in the troposphere absorbs outgoing IR radiation. Thus at the same time as overall concentrations of ozone decreases (causing more UV radiation to reach the surface), there is more ozone in the troposphere causing less UV radiation to get out (the basis of the green house effect). We get screwed both ways.
-
user1001 at 16:40 PM on 9 May 2018Increasing CO2 has little to no effect
In Figure 2 comparing spectral absorbtion of outbound radiation 1970 till 1996 why doesn't the O3 absorbtion decrease as the amount of O3 in the atmosphere decreased over that period I expected to see the opposite effect to the CO2 but it seems to be the same effect for a decrease in concentration. I found a chart showing a fall of around 5% O3 over that period:

-
Digby Scorgie at 12:46 PM on 9 May 2018SkS Analogy 11 - Cabinets, airplanes, and frame of reference
MA Rodger @21
I'd be happy with that.
-
nigelj at 07:23 AM on 9 May 2018The 1970s Global Cooling Zombie Myth and the Tricks Some People Use to Keep it Alive, Part II
The papers predicting cooling are clearly small in number and not a consensus. This prediction of cooling appears to me to be largely dependent on reasoning about fossil fuel particulates increasing.
But scientists could not have known that S02 emissions would be filtered out and reduced from 1980 onwards causing about a 30% drop in these emissions since then. It's unreasonable to accuse scientists of a mistaken scientific prediction on the basis of yet to be invented or applied technology!
-
nigelj at 06:28 AM on 9 May 2018Global warming will depress economic growth in Trump country
Jef @2
"Unless we tax the heck out of every carbon emitting activity (which is just about everything) and use ALL of that money to pay people to NOT do carbon emitting activities then there will be no net gain in a carbon tax, certainally not any that makes a difference."
We don't have to tax "the heck out of nearly everything". Just fossil fuels and products like cement etc. Other products have a carbon content because of the energy used in manufacture and transport, so you wouldn't tax them twice. It really depends on how the tax is structured, and there are various approaches.
I dont see that you have to pay people (the consumer) specifically not to do carbon emitting activities, and its hard to see how you would enforce this practically. For example Several countries have carbon taxes, and British Columbia for example has a small carbon tax which has provided a net gain as in this article.. They dont give all the tax back to the people or spend it on low carbon activities, as far as I'm aware. I stand to be corrected.
From the article :"The tax, which rose from 10 Canadian dollars per ton of carbon dioxide in 2008 to 30 dollars by 2012, the equivalent of about $22.20 in current United States dollars, reduced emissions by 5 to 15 percent with “negligible effects on aggregate economic performance,” according to a study last year by economists at Duke University and the University of Ottawa."
I agree obviously it will need to be set much higher to lead to 50% reductions, but if its tax and dividend this keeps power in consumers hands. The economics suggest enough would be spent on low carbon goods to make a difference.
However personally I think some of the tax should however go to manufacturers subsidising electric cars, so it would be a 'partial' tax and dividend scheme. I think the important thing is not to have such a dividend end up in general government spending on education, military etc.
-
MA Rodger at 02:40 AM on 9 May 2018SkS Analogy 11 - Cabinets, airplanes, and frame of reference
Digby Scorgie @20,
Myself, I think the world will probably end up using that 0.61°C adjustment from HadCRUT4 1850-1900 as being pre-industrial. The scientific debate about revising that value was covered in The Guardian a month ago. I reckon the main problem faced by those wanting to set the baseline period earlier is the difficulty the likes of Hawkins et al (2016) & Schurer et al (2017) in providing a single number rather than a range with all its attendant ambiguity. (Hawkins et al argue for using 1720-1800 as pre-industrial and with it a range of 0.55°C-0.80°C to replace the 0.61°C.)
-
jef12506 at 00:38 AM on 9 May 2018Global warming will depress economic growth in Trump country
Out here in the real world the more money you have the larger your carbon footprint......period!
Unless we tax the heck out of every carbon emitting activity (which is just about everything) and use ALL of that money to pay people to NOT do carbon emitting activities then there will be no net gain in a carbon tax, certainally not any that makes a difference.
-
Digby Scorgie at 16:04 PM on 8 May 2018SkS Analogy 11 - Cabinets, airplanes, and frame of reference
MA Rodger @19
Scrogie? Well, that's another new one!
Anyway, what baffles me about all this is how one can talk about limiting warming to x degrees above pre-industrial (as in Paris-style agreements) if one has not defined what warming has already occurred. The latter would be the warming from pre-industrial to some specified period in the twentieth century when temperature measurements can be considered reliable.
-
scaddenp at 14:40 PM on 8 May 2018Climate's changed before
Unless there is confusion between an outward flux and the net flux. It is "voodoo economics" to have amount of CO2 dissolved in oceans increasing (the reducing pH) while claiming net outflow from ocean to atmosphere.
-
scaddenp at 11:00 AM on 8 May 2018Climate's changed before
" Also,Milankovitch was obviously brilliant to have figured out the spinning shifts of the earth." Not sure what you are trying to say here. He was brilliant, but for calculating the magnitude of the effects without a computer. The orbital cycles discovery is simply astronomical observation and discovery of some of them date back to ancient history (maybe Babylon).
CO2 did come from oceans as they heated up at end of ice age cycles with significant contributions from eurasian swamps as well. If you want a new theory, make sure it matches the observations of methane as well and also accounts for the isotope composition of both in ice cores.
However, ocean outgassing from current warming is not happening yet - not even close. You cannot seriously posit a new theory that violates basic physical and chemical laws and observations.
" I have read that they are warming and thus giving off a lot more CO2 than our burning of fossil fuels now."
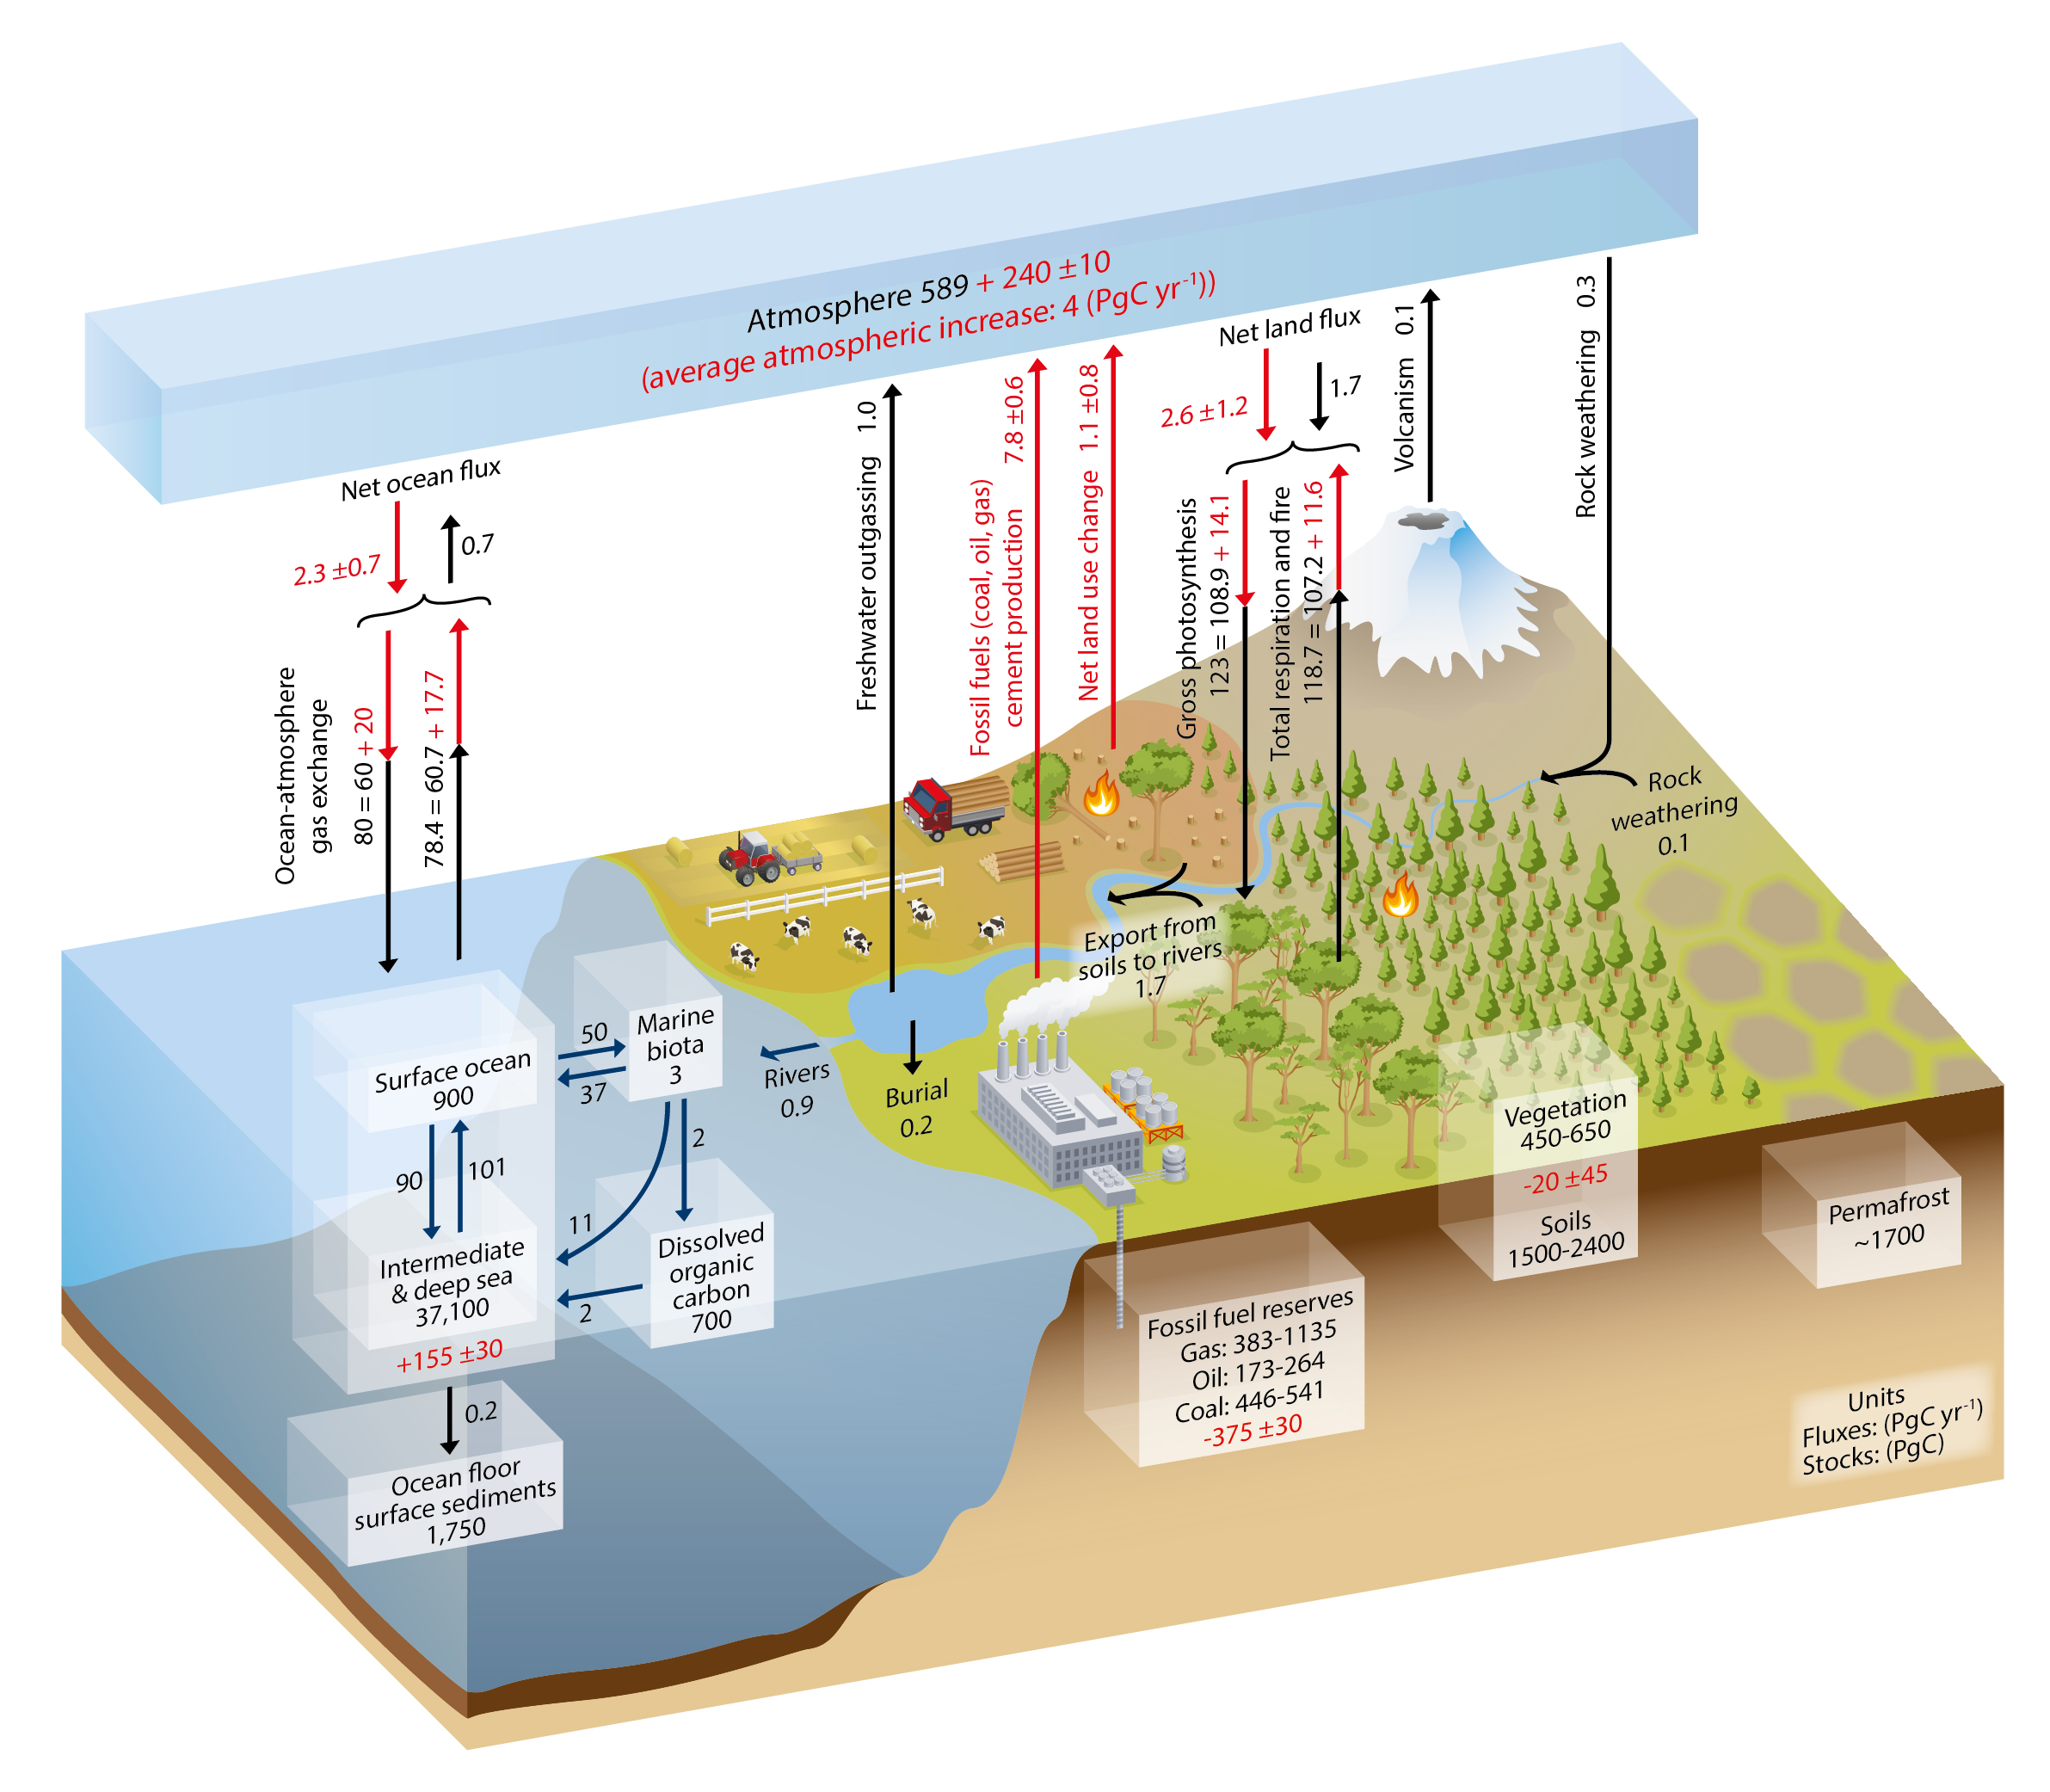
You dont say your source but it is clearly untrustworthy. The actual fluxes are well established as the mass of papers associated with that diagram in the IPCC report show.
-
Philippe Chantreau at 09:22 AM on 8 May 2018Climate's changed before
mkrichew, your theory will have some serious hurdles to overcome in order to fit the present warming. The oceans are net carbon sinks at present, not sources; part of the gigantic amounts of carbon dioxide injected in the atmoshere go into solution in the oceans, and lead to acidification. There is an entire thread devoted to the subject on this site. Furthermore, what would be warming up the oceans in the first place? You'd have to find some seriously exotic source of heat to explain the kind of energy accumulation seen across the planet's oceans, another subject that is explored in SkS threads. Even if there was such a mysterious forcing, oceanic chemistry shows that they are not outgasing any CO2. I don;t feel obligated to link any references considering that all these considerations figure in already existing SkS threads. Use the search engine.
-
Eclectic at 09:17 AM on 8 May 2018Climate's changed before
Mkrichew @604 , your Mike Krichew theory was previously called the Murry Salby theory. To see why Murry Salby was wrong, please read Climate Myth #142 (and elsewhere).
-
Daniel Bailey at 09:16 AM on 8 May 2018Climate's changed before
"where does all the carbon dioxide come from in previous ice ages? I believe it came from warming oceans"
Conceded. However, the rise in atmospheric concentration of CO2 driving the modern warming is NOT coming from the oceans, but from the human burning of fossil fuels. This we know pretty thoroughly, due to the distinctive isotopic signature of the rise. Also, we know that the rise in atmospheric CO2 is not from the oceans because the oceans are still acidifying. This is well-understood by science and not contested in any meaningful way.
Read this post for background. If questions, place them there, not here.
The Koch Industries-funded BEST team found that, WRT 'Is CO2 leading or lagging temperature rise':
"we know that the CO2 is not coming from the oceans but from human burning of fossil fuels"
And
"it is clear that it is the CO2 that comes first, not the warming"
Due to the thermal lag of the oceans in response to the anthropogenically-forced warming imposed upon them, the world will continue to warm and its climate will continue to change, for decades after the cessation of the usage of fossil fuels. Again, pretty well understood by science.
This is a science- and evidence-based venue, with regulars well-versed in the science.
-
nigelj at 08:08 AM on 8 May 20182018 SkS Weekly Climate Change & Global Warming Digest #18
One of the accusations is that EPA environmental regulations kill jobs. Not according to this research.
-
nigelj at 07:55 AM on 8 May 20182018 SkS Weekly Climate Change & Global Warming Digest #18
The EPA is indeed under vicious attack and regulatory capture, and it highlights the fundamental tension between capitalism and the environment. Capitalist free maket competition is a great thing and economically efficient, but has the well known negative side effect of environmental damage as costs are transfered to third parties, future generations, or swept under the carpet to fester.
Relying on the goodwill of the leaders of industry to do the right thing regarding the environment and other matters has a poor history, as with some individuals the profit motive coincides with sociopathic tendencies, short term thinking and disregard for the well being of anyone outside their immediate inner circle of people. But then all of us are genetically wired to favour our immediate group, according to scientific research although. this varies form individual to inndividual. As below.
en.wikipedia.org/wiki/In-group_favoritism
But anyway the EPA was established to be a strong body independent of business and government capable of counter acting the tendency of free markets and rogue leaders of industry to pillage and destroy the environment. It balances economic and environmental concerns. It ensures the public good is protected. If it abuses its power, there are already sufficient checks and balances.
The attack on the current EPA is clearly is a full scale attack by corporate vested interests and small government ideologues. They might acquire slightly more material wealth, or so they think, but the net result is the quality of life of the overwhelming majority of people is seriously downgraded.
-
nigelj at 07:30 AM on 8 May 2018Global warming will depress economic growth in Trump country
Yes climate change will hurt red states and Trumps supporters more, however the blue collar workers won't be able to work it out, and are under his spell because Trump knows how to play them, and Trumps more astute business supporters dont care, because they are wealthy enough to escape the problems, or so they believe. But climate change will ultimately make everyone poorer than they would have been, because it degrades the wealth creating ability of the overall system.
It's interesting that the highest income tax period in America was from from 1945 - 1975 and this coincided with the highest rates of economic growth and personal prosperity. While correlation doesn't necessarily mean causation of course, it does suggest that higher taxes don't necessarily impede growth.
Imho it probably depends on the nature of the tax, and what its used for, and with a revenue neutral carbon tax, or carbon tax and dividend the money is likely to flow back into job creating activities rather the black hole of government. So I struggle to see how it would reduce gdp growth, and its more likely to be neutral in effect, but of course when you factor in the growth destroying aspect of climate change, such a tax is effectively enhancing growth.
-
mkrichew at 06:20 AM on 8 May 2018Climate's changed before
I disagree with your statement that science has a good understanding of past climate changes and their causes. It does not. Also,Milankovitch was obviously brilliant to have figured out the spinning shifts of the earth. I believe he said that it might explain ice age cycles. Wikipedia gave a good explanation of the faults with that theory. I prefer my own theory listed as the Mike Krichew theory of what causes ice ages. So ask yourself the question: where does all the carbon dioxide come from in previous ice ages? I believe it came from warming oceans. This would explain why CO2 levels lag global warming in the data. So, what does the data say about warming oceans today. I have read that they are warming and thus giving off a lot more CO2 than our burning of fossil fuels now. Thus, I argue that even if we stop all fossil fuel burning today it will not stop global warming.
Moderator Response:[JH] You are already skating on the thin ice of sloganeering by not providing science-based references for your own theories about what caused the ice ages and what is driving global warming.
Sloganeering is prohibited by the SkS Comments Policy.
Please note that posting comments here at SkS is a privilege, not a right. This privilege can be rescinded if the posting individual treats adherence to the Comments Policy as optional, rather than the mandatory condition of participating in this online forum.
Please take the time to review the policy and ensure future comments are in full compliance with it. Thanks for your understanding and compliance in this matter.
-
MA Rodger at 19:28 PM on 7 May 2018SkS Analogy 11 - Cabinets, airplanes, and frame of reference
Digby Scrogie @18,
And keeping climatologists to a 1961-90 baseline is a bit like herding cats while the pre-industrial-to-std-baseline warming is only offered with the greatest reluctance, a reluctance absent with the likes of sea level, GHG levels, or even pre-industrial-temps relative to the Early Eocene. As an example, the IPCC AR5 Technical Summary will talk of limiting ΔT to 1.5ºC or 2ºC above "pre-industrial" but resorts to using 19th century temperatures without eplicitly saying 'this is being used as the pre-industrial T' and even then with this being "assumed" rather than set more confidently. Thus AR5.Technical Summary TFE.8 'Climate Targets & Stabalisation':-
"In the near term (2016–2035), global mean surface warming is more likely than not to exceed 1°C and very unlikely to be more than 1.5°C relative to the average from year 1850 to 1900 (assuming 0.61°C warming from 1850-1900 to 1986–2005) (medium confidence). " (My emphasis)
(And note the 1986-2005 baseline employed.)
You have to delve into the AR5 Synthesis Report before you find somebody sneaking in explicit use of "relative to pre-industrial" (eg on the y-axis of Figure SMP10b, which is a graphic re-used from Figure SMP5b that does not.) I can understand the reluctance but this "relative to pre-industrial" thing is a nettle that requires being better grasped.
-
nigelj at 16:10 PM on 7 May 20182018 SkS Weekly Climate Change & Global Warming Digest #18
Regulatory capture seems like an understatement to me. More like total evisceration.
This article is relevant to the Scott Pruitt issue : "Trump Picks TV Snake Oil Salesman Dr. Oz, of All People, to Serve on Health Council".
Yes its another inappropriate person for the job, and the article has interesting insight on why Trump may have made this particular choice. You will laugh or cry, depending on your mood.
-
Digby Scorgie at 14:30 PM on 7 May 2018SkS Analogy 11 - Cabinets, airplanes, and frame of reference
MA Rodger @17
Dogby? Well, that's a new one!
I see the problem with baselines, but it seems to me there is a solution: Agree to use, for example, 1961 to 1990 as the historical baseline, and then arbitrarily specify the warming from pre-industrial up to that baseline as equal to some consensus amount. It's like agreeing on the freezing and boiling points of water for the Celsius scale — well, sort-of. Maybe someone can think of a better analogy.
-
bozzza at 16:26 PM on 6 May 2018TV Meteorologists Seen Warming to Climate Science
'Peer review' is of course just another part of standardised method! Otherwise it's just anarchy with beakers.... without method you have man in his natural state bordering on the side of cruelty!
-
MA Rodger at 22:11 PM on 5 May 2018SkS Analogy 11 - Cabinets, airplanes, and frame of reference
Dogby Scorgie @15,
The use of a 30-year baseline set before the second half of the 20th century is made difficult as much of the data used to calculate such an early baseline will be of low quality and much entirely absent. The WMO approach used to be to update the baseline used every 30 years but that has become every 10 years as AGW creates significant change while the baseline data will be used by some without consideration of that change. Thus the WMO decided to update baselines every 10 years (so now it is 1980-2010) but to keep 1961-90 "as the historical base period for the sake of supporting long-term climate change assessments." Note baselines will be used for all types of data not just temperature. And for global temperature records,1961-90 is the anomaly base used by HadCRUT but BEST & GISS use 1951-80 and the NOAA 'Climate at a Glance' Global ime Series pages say "Please note, global and hemispheric anomalies are with respect to the 20th century average. Continental anomalies are with respect to the 1910 to 2000 average. Coordinate anomalies are with respect to the 1981 to 2010 average."
-
DrivingBy at 12:39 PM on 5 May 2018The 1970s Global Cooling Zombie Myth and the Tricks Some People Use to Keep it Alive, Part I
Eh, there's no use arguing directly with most who post that retread, they've checked out of any countertext by the fourth sentence. They're doing politics, not science.
In any case, Edward Teller state in 1957 that global warming would occur, and even with an offhand estimate calculated the rise in CO2 with surprising accuracy (estimating "about360ppm" for the 1990s), and also hitting the range of warming ("it's hard to say whether it will be 2 degrees Farenheit or 5). We're now a bit past 2 degrees F from a 1900-1950 baseline and a little more from pre-industrial.
So when Doofus cries that "they" predicted global cooling, reply that Teller would nuke his ask at that comment.
-
Evan at 12:16 PM on 5 May 2018SkS Analogy 11 - Cabinets, airplanes, and frame of reference
Digby @15
For an example of just how hard this is, check out the following Scientific American article and the following quote (emphasis mine).
In what’s become a spring tradition like Passover and Easter, carbon dioxide has set a record high each year since measurements began. It stood at 280 ppm when record keeping began at Mauna Loa in 1958. In 2013, it passed 400 ppm. Just four years later, the 400 ppm mark is no longer a novelty. It’s the norm.
Yes, they are saying that when CO2 measurements began in 1959 that we had 280 ppm CO2. Not only is there a problem defining consistent baselines, but there is further confusion about getting simple facts correct.
-
Digby Scorgie at 12:00 PM on 5 May 2018SkS Analogy 11 - Cabinets, airplanes, and frame of reference
Regarding temperature anomalies, I've seen it expressed thus: increase your body temperature by two degrees and you don't feel well, but increase it by four degrees and you're dead!
Regarding baselines, as I understand it, the various teams investigating the problem use different baselines. Has there not been a move to get everyone using the same baseline? It would really help if the baseline was close to what is considered to be "pre-industrial".
-
nigelj at 08:54 AM on 5 May 2018New research, April 23-29, 2018
Some very good research, however it's astounding that there doesn't seem to be any proper published research on why mitigation of emissions is so slow, and why public and politicians are slow to make the changes required. I'm thinking something that polls the public, and asks wide ranging questions.
There are obvious well known potential reasons, but one should never assume what reasons exist, or what reasons are dominant. Efforts to persuade the public and politicians to change things are just guesstimates, if they aren't based on good research.
We have the denialist campaign and corporate capture of politicians etc. People in colder climates probably think a warmer climate is good, and they rationalise away sea level rise as a price worth paying. They would be wrong, and are not looking at the full range of problems. But a research study would clarify if these are real concerns.
Apply occams razor, and the basic problem is human stupidity.
-
william5331 at 06:10 AM on 5 May 2018The 1970s Global Cooling Zombie Myth and the Tricks Some People Use to Keep it Alive, Part I
All things being equal (us not mucking up the natural flow of events) we should be going into a glacial period right now. (not an ice age -an ice age is the approximately 3m year period in which there have been around 30 glacial and interglacial periods). In fact, the lichen halo around the Baffin island High lands shows that we were already heading that way. For a really great treatment of the subject, read Plows, Plagues and Petroleum by Ruddiman. We now may have put off this glacial (or glacial period, if you like) or more likely, when we collapse our civilization, it may come on like gang busters and wipe the slate clean right down to and past the latitude of New York. That would be something to see. A contenental glacier pushing over sky scraper after sky scraper. The bottom few floors would already be submerged.
-
Evan at 05:22 AM on 5 May 2018SkS Analogy 11 - Cabinets, airplanes, and frame of reference
rocketeer @12
Perhaps the other issue is that many simply don't realize how sensitive the atmosphere is. I had an adult tell me, "You mean we humans can affect a planet that has been here for 4.5 billion years?" As if age implied stability (at least it does not in the case of humans), and as if our actions were small. Eat 10% more calories than is recommended (i.e., 2200 instead of 2000/day) and your body can adapt and handle it. And the rate at which you eat the extra calories does not matter too much. But increase the temperature of the Earth by 10% (use whatever baseline you prefer), and the atmosphere and other environments go through a huge readjustment. The atmosphere within which we live is simply a sensitive system, and many people don't get that, because there is a time lag between our actions and the response.
Your reference to small changes in body temperature having big effects is perhaps the best example of a sensitive system to which we can identify.
-
Dcrickett at 04:27 AM on 5 May 2018The 1970s Global Cooling Zombie Myth and the Tricks Some People Use to Keep it Alive, Part I
Ref #1 nigelj
Good point in ¶3.
I remember an article in a popular slick magazine, most likely in 1973, that mentioned both global warming and cooling; it ventured that one might cancel out the other. In Table 1, by 1973 the number of warming papers was pretty much the same as the total of cooling and neutral papers, so a presumption of "no consensus" at that time appears to me as reasonable. However, in the time it takes to get a kid out from the maternity ward into a kindergarten, it is clear that a warming consensus had developed.
-
Evan at 04:17 AM on 5 May 2018SkS Analogy 11 - Cabinets, airplanes, and frame of reference
MA Rodger @10.
Thanks for the educational tutorial. I'm always sure that if I take stab at it and miss something, that someone like yourself will come along to clarify.
Perhaps I was not clear in my explanation. I understand that surface temperatures over the ocean are cooler than over land. And I understand that the data set is not perfect, and appreciate your detailed explanation of where it is not perfect. My main point (which I think is still valid) is that the only thing that really makes sense to track is the combined land+ocean temperature, because that gives the most consistent picture of how things are changing from year to year.
In any case, thanks for your detailed explanation.
-
rocketeer at 03:56 AM on 5 May 2018SkS Analogy 11 - Cabinets, airplanes, and frame of reference
I think the real issue is not the datum whihc is designated as zero, but the implication that small percentages are unimportant. This is patently silly. Would you be concerned if only 0.3% of an Airbus 380 was falling on your head? Or to make it more relevant to the Kelvin scale, consider that a 1% increase in body temperature is the difference between being perfectly healthy and being in the hospital.
The difference between the last glacial maximum when there was mile-deep ice covering much of North America and today is a global temperature change of about 5 K. That is only a change of about 2% according to Giaver's reasoning, but it sure isn't trivial.
-
MA Rodger at 03:26 AM on 5 May 2018SkS Analogy 11 - Cabinets, airplanes, and frame of reference
Evan @10,
Your graph in the OP is plotting GISS LOTI and that is "Combined Land-Surface Air and Sea-Surface Water Temperature Anomalies," a combined record using GHCNv2 SAT & ERSSTv5 and not as you say @10.
Oh, no! I am yet another engineer. But I will still have a stab at the Qs @8:-
(1) The 2ºC limit is the global land & ocean temperature rise. It does make a difference. GISS LOTI, for instance rose +1.2ºC above the 1880-1900 average in 2016. Yet GHCNv2 SAT rose +1.7ºC, a significant difference.
(2) The relationship between ocean SAT & SST is quite strong although the season, time of day and geographical location will impact that relationship. Beyond those considerations (which are fixed through a temperature record), my understanding is that the variation of the relationship is then mainly down to wind speed (which is not fixed through the record). Note that the Land SAT is the average of Tmax & Tmin which differs from the actual daily average.
So we do have apples and oranges, but that is the only data available if we want a full 20th century record. We are therefore stuck with it.(3) Anomalies are required to create a global average from point measurements as the anomaly remains constant over a far wider area than an absolute temperature. So we are stuck with anomalies even if we weren't combining SST & SAT.
(4) The idea that the global average temperature anomaly is a simply and cleanly derived quantity (non-weird abet a combination of SST & SAT) does tend to become a difficult idea to sustain when the decisions required in creating the global anomaly begins to be better understood. As an example, take the SST-over-ocean/SAT-over-land situation and consider that each year 10 million sq km of Arctic sea ice and 15 million sq km of Antarctic sea ice melts away being replaced by ocean. Thats 5% of the global area. And with AGW the actual ocean being thus exposed in the Arctic is much different today than it was back in 1900. (Antarctic temperatures are not addressed by GISS LOTI until the second half of the 20th century. It is the same with temperatures in the high Arctic but we can assume they were premanently frozen through those years.) The BEST global temperature record gives two different approaches to tackling the sea ice problem and one way adds roughly +0.15ºC to the warming since 1900 than the other does.
-
Evan at 23:15 PM on 4 May 2018SkS Analogy 11 - Cabinets, airplanes, and frame of reference
John @8, have a look at the following link where the GISS methodology is explained. When referring to Land+Ocean, the GISS plot I included is still an air-temperature anomaly, referring to global surface temperature. As such, it is simply tracking an average temperature that is a combination of surface temperature over land and over ocean. It is not, as I understand it, the ocean-water temperature, but rather the average surface temperature over the ocean and land.
-
Evan at 22:59 PM on 4 May 2018SkS Analogy 11 - Cabinets, airplanes, and frame of reference
John @7. I am not any kind of authority on the topic of temperatures, but let me offer my thoughts based on what I've learned.
We are really concerned with the total energy accumulated by the combination of land+oceans. We want to express this total energy as a single temperature difference that gives us a single index. That is, layman like us (I am a chemical engineer, but not a Climate Scientist) can more easily grasp the meaning of temperature than we can energy. But to make this meaningful, the "average temperature change" needs to correlate to what's happening over the entire surface of the earth, and not just one part. So combining land+ocean simply reflects that we live on land but that our energy system is dominated by a water world. The two are linked, and because the oceans strongly control temperature fluctuations, we must include both oceans and land to come up with any kind of meaningful index, such as "average temperature anomaly."
Until you raised this good question, I had never thought about it being meaningful to separate land and ocean temperatures, simply because what we want is a single temperature that gives the average temperature change over the entire earth.
Taking a stab at your questions
1) My understanding is that the 2-degree limit corresponds to combined land+ocean average.
2) No, because land+ocean are a linked energy system. El Ninos transfer lots of energy from the oceans into the air, and La Ninas transfer a lot of energy from the air to the oceans. They really need to be considered as a linked system. Obviously if you live in the Arctic the temperatures there control what happens locally, but for the purpose of creating a global index with a single number, we must look at the entire system.
3) I will pass on this question. Hopefully someone can step in.
4) See above comments.
Now we are waiting for a real Cliamate Scientist to respond. :-)
-
John Hartz at 22:56 PM on 4 May 2018SkS Analogy 11 - Cabinets, airplanes, and frame of reference
I inadvertantly deleted the following post. My apology to John S.
John S at 21:13 PM on 4 May 2018
I recall watching Glaevers talk and being unimpressed by him making fun of climate scientists for supposedly thinking it possible to get an accurate average absolute temperature of the whole globe. It was as if he had never noticed that the vertical axis was labled "tempeature anomaly". Or maybe he didn't understand that it simply means change from a baseline (to be fair it is a bit of an unusual use of that word - different from its use in everyday language). I had previously read an explanation on the NASA website as to why the so-called "temperature anomaly" is used.
However, this posting reminded me of questions I have re the rationale and justification for using combined land and ocean data; first I should reveaL I am a retired engineer struggling to understand the science and know I never will entirely, but I keep on trying, so I'm hoping some compassionate scientist out there will take my questions at face value and provide explanations in layman's language:
1) what does the 2 degree limit of Paris Agreement refer to, land only or land and ocean?
2) isn't combining land and ocean a bit like adding apples and oranges?
3) is the answer to 2) no more than the use of anomalies and the fact that the data in succeeding time intervals always come from the exact same locations, plus the fact it is useful to refer to a single number?
4) is there anything else anyone can say that might me feel better about combined land and ocean data, as it seems a bit weird to me?
Cheers
in my e purpose of me posting this is an enquiry
-
John S at 21:29 PM on 4 May 2018SkS Analogy 11 - Cabinets, airplanes, and frame of reference
it always happens - a minute after I hit 'submit' I realized I had garbled some language myself so this correction is to avoid possibly leading anyone else astray or creating unnecessary side-tracks .. I had wrongly referred to "anomaly" as being a change from a baseline whereas I should have said "difference" .. subtle but open for misinterpreation .. also to be fair then I checked Thesausrus provided by Word and sure enough one of the synonyms of "anomaly" it gives is "difference" so maybe it is not such an unusal use of language
-
Glenn Tamblyn at 18:25 PM on 4 May 2018CO2 lags temperature
mkrichew
To expand on pscadden's comment. If CO2 concentrations in the atmosphere were steady and temperatures were rising, then the ocean would be outgassing. That is basic chemistry from Henry's Law.
However, since we are adding lots of CO2 to the atmosphere, the need to equilibrate CO2 concentrations in the ocean and the atmosphere means that CO2 levels in the oceans need to rise. The temperature dependent aspect of Henry's Law is outweighed by the partial pressure dependency. -
KingInYellow at 17:14 PM on 4 May 2018The 1970s Global Cooling Zombie Myth and the Tricks Some People Use to Keep it Alive, Part I
@nigelj
When doing my course we also used the Barry & Chorley book, and mine was 5th edition ~1988 (it's in storage as I am between houses) and once again made no mention of a potential cooling instead focusing on the basic physics as you would expect.
-
scaddenp at 14:02 PM on 4 May 2018CO2 lags temperature
mkrichew - the first graph (Fig 1) is cyclic in sense that it is the superposition of the 3 Milankovich cycles. These orbital cycles affect climate by making large variation to insolation around 65N, affecting the albedo by changes in snow cover which in turn sets up other feedbacks. However, they only came to affect climate when CO2 dropped below 400ppm (long term geological sequestration). They dont do much in a warmer earth. Note also that those cycles are slow. A maximum change in forcing of around 0.25W/m2 per century at 65N compared with 1.66W/m2 per century from CO2 alone across entire whole globe.
"I believe but could be wrong that the ocean is already warming and giving off more carbon dioxide than we do burning fossil fuels"
Fortunately, you are wrong. The oceans are still net absorbers of CO2 and will continue to do so for centuries (ocean mixing takes a long time). Details in Ar5 chp 6.
-
mkrichew at 13:00 PM on 4 May 2018CO2 lags temperature
This has probably been said but the first graph looks cyclic to me. Also, the graphs have been correlated to two other scientific phenomena, oxygen isotope ratio variation and extinctions. The point is, climate change has happened before and likely will happen again. Check out the Mike Krichew theory of what causes ice ages on my facebook page. If my theory is correct and the IPCC has pretty much proved the first part of it, then unless you want to spend money on cooling the ocean and removing CO2 from the air then we are going to see what global warming is. I believe but could be wrong that the ocean is already warming and giving off more carbon dioxide than we do burning fossil fuels. Folks, the ship has sailed or the train has left the station. We are going to find out the results of what we started.
-
Evan at 12:04 PM on 4 May 2018SkS Analogy 11 - Cabinets, airplanes, and frame of reference
Thanks Wol for the clarification. I changed "altitude" to "elevation". For those interested, here is a link explaining the different elevations used in aviation.
-
David Kirtley at 11:17 AM on 4 May 2018The 1970s Global Cooling Zombie Myth and the Tricks Some People Use to Keep it Alive, Part I
That's very interesting, nigelj.
I have a Putnam's Geology from my college days in the mid-80's. Published 1982, so it too should represent "1970s" science. It says a little bit about possible causes of past ice ages, and discusses other factors like CO2 and dust/aerosols impacting climate, but there's next to nothing about a "cooling consensus" or a future ice age.
-
Wol at 10:43 AM on 4 May 2018SkS Analogy 11 - Cabinets, airplanes, and frame of reference
>>The altitude of an airplane landing on a runway is only useful if measured relative to the ground, and not to sea level.<<
It behoves someone writing about the interpretation of words to get his own interpretations correct!
"Altitude" in the context of that quote IS actually measured with respect to sea level - the distance between the aircraft and the runway is "height".
(Tongue in nit-picking cheek.)
-
nigelj at 07:14 AM on 4 May 2018The 1970s Global Cooling Zombie Myth and the Tricks Some People Use to Keep it Alive, Part I
When I was at university in the early 1980's I did a few papers in physical geography, among other subjects. I still have one of the introductory text books "Atmosphere, Weather and Climate, Barry and Chorley, 1971 edition, reprinted 1975, so written right at the time of the supposed global cooling consensus.
There's absolutely nothing in this text about any cooling consensus, or anything similar. If there was such a thing, it would probably have got a mention. The authors talk about the post 1940s cooling period, and they say it remains to be seen if its temporary or continues, and they present no consensus or predictions either way.
The climate denialists rush together distorted, cherrypicked studies hoping nobody will check. They aren't interested in facts and the complete picture, only in finding ammunition. They use the same tactics as lawyers, including long superficially intimidating lists, but all hollow inside.
-
scaddenp at 06:47 AM on 4 May 2018SkS Analogy 11 - Cabinets, airplanes, and frame of reference
mbryson - love it! Maybe I will buy that beachside holiday house after all :-).
That is an excellent analogy.
-
mbryson at 23:24 PM on 3 May 2018SkS Analogy 11 - Cabinets, airplanes, and frame of reference
So you're telling me that sea level at the end of the ice age only increased by a factor of about .00002 (relative to the centre of the earth)? Why would anyone worry about that?
-
nigelj at 07:21 AM on 3 May 2018SkS Analogy 11 - Cabinets, airplanes, and frame of reference
“From ~1880 to 2013 temperature increased from ~288K to 288.8K (0.3%). If this is true, to me it means that the temperature has been amazingly stable.”
No it hasn't, because that 0.3% change has happened in a very short part of human history so its not stable from humans point of view, and what we are adapted to.
Gaiver must know this, so is being deliberately obtuse probably for political reasons. For proof he does work for the Heartland Institute, and talks in their language.
The analogy is the article is very good.
-
scaddenp at 07:04 AM on 3 May 2018TV Meteorologists Seen Warming to Climate Science
Every one of us does motivation reasoning. Also known as rationalization. Highly intelligent people are just especially good at devising very complex support for what they want to believe.
Visiting a highly intelligent person in prison to try and help with his drug problem really brought this home to me. You had to work very hard to spot the loose links in his chains of logic - which naturally concluded that drugs werent an issue for him - just his choice same way other people drank coffee - and that it was everyone else at fault.
Scientists are not immune so no matter how much you believe your conclusions are data-driven, you still need peer-review.
-
ubrew12 at 06:48 AM on 3 May 2018SkS Analogy 11 - Cabinets, airplanes, and frame of reference
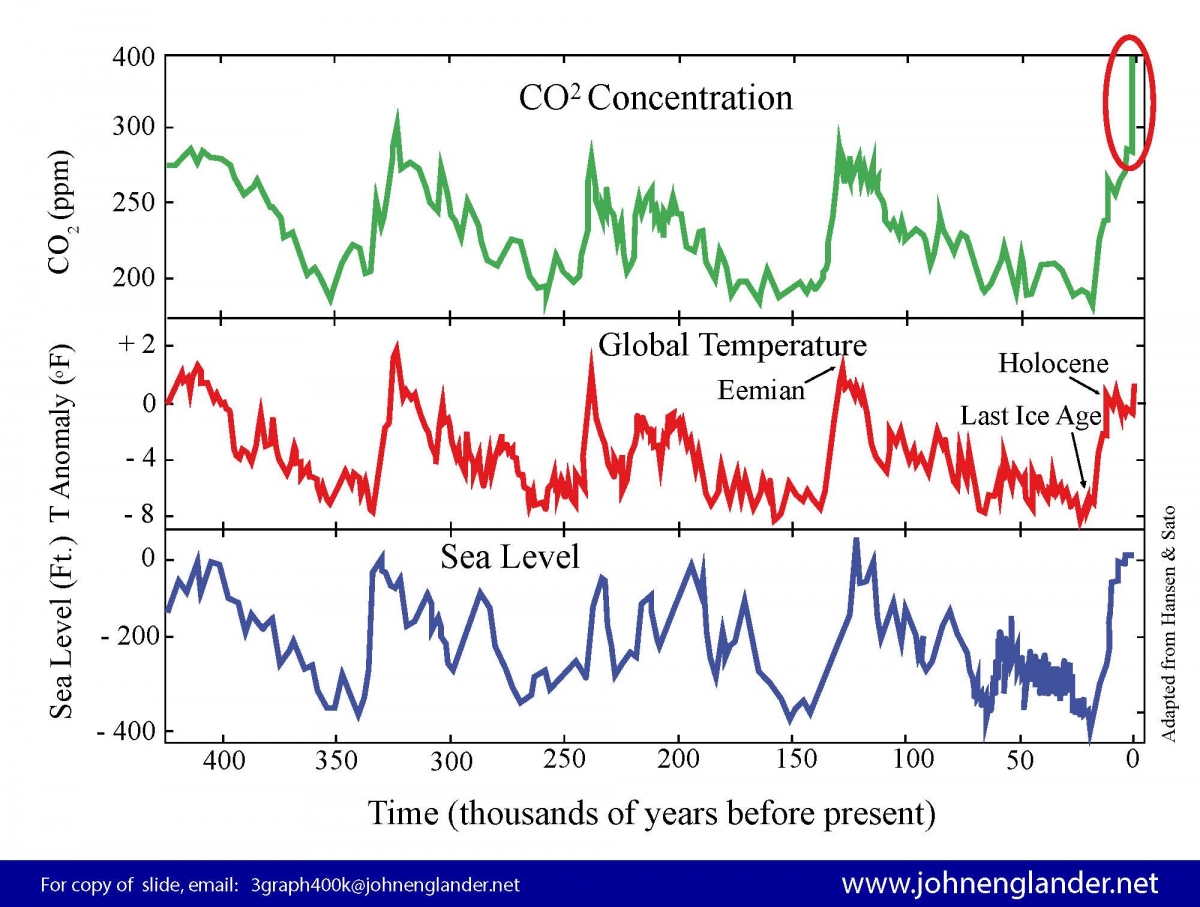
A friend on facebook forwarded Giaever's talk. I told him it shouldn't take someone 5 minutes of their time to find such a massive mistake. I refer people to this graph of the last 400,000 years of global temperature, CO2, and sea level, point out that the depths of the last ice age was only 3.3 C (6F) cooler than present, and then ask them if having Chicago under a mile of ice was a significantly different climate than present and, if so, why wouldn't 3 C warmer than present also be a difficult adaptation to make?
Prev 280 281 282 283 284 285 286 287 288 289 290 291 292 293 294 295 Next


