


 Arguments


Recent Comments
Prev 346 347 348 349 350 351 352 353 354 355 356 357 358 359 360 361 Next
Comments 17651 to 17700:
-
Digby Scorgie at 17:20 PM on 20 September 2017Australia's Transition to Renewable Energy
There's no bloody master plan in New Zealand either. Is there anybody with a master plan?
-
Eclectic at 10:47 AM on 20 September 2017Scientific models saved lives from Harvey and Irma. They can from climate change too
Thanks for that, OnePOF @16 .
It is worth re-emphasizing the bigger picture [as touched on, in post #4]
That is — until such time as a real pause can occur in nett radiational energy inflow at the planetary level [at Top Of Atmosphere], it remains impossible for any actual physical pause in global warming to occur. Essentially, a real pause or warming-trend slowdown can only occur after the atmospheric CO2 level has stopped rising. And there is no sign of that happening within the next 3 decades.
Sure, there will always be brief fluctuations in "trend", from minor natural variations in ocean currents and/or volcanic eruptions — but no pause is possible in real terms. To suggest otherwise is to commit obfuscation [to put it politely!] .
-
nigelj at 10:37 AM on 20 September 2017Scientific models saved lives from Harvey and Irma. They can from climate change too
Getting back to the article, picking just one of Hansen’s predictive scenarios was far too “selective” (choosing my words carefully) but I would go further and say its rather selective to focus just on Hansen. It would have been more representative to pick an average of all projections made at the time for "business as usual"
I say this with huge respect for Hansen who is quite possibly some kind of genius, but the world doesn’t revolve entirely around him and Al Gore. A lot of people have concluded we are warming climate going right back to Arrhenius a century ago.
Moderator Response:[PS] You said it. Hansen had his sensitivity too high in 1988 for reasons that are actually interesting. You dont see pseudo-skeptics giving much attention to the oldest quantitative estimate for global warming - Broecker's paper of 35 year ago.
-
One Planet Only Forever at 10:01 AM on 20 September 2017Scientific models saved lives from Harvey and Irma. They can from climate change too
Tom13,
I have used the SkS Temperature Trend Calculator with the 15 year rolling average (180 months) the Met Office used. The 15 year average would show some of the variability of global averages that does not appear in longer roling averages.
I do indeed see a levelling off of the trend line in the teperature data sets when looking at that 'shorter-term trend line'. The leveling-off occurs in the early 2000's not at 1998. And the level period is quite short with a clear return to the rate of rise that was occurring before the brief leveling off.
It is harder to see the change of short term trend in the satellite data sets. But the satellite data are not surface temperature so the less noticeable change of trend in those data sets are not really a relevant issue.
Note that using a shorter term rolling average would show an even 'noisier' trend line. Using a 60 month average makes it very difficult to see the actual trend in any of the data sets (lots of ups and downs). And using a 13 month rolling average is almost useless for appreciating what is actually going on in terms of the long-term.
Moderator Response:[PS] This is straying offtopic. If want to talk more about models reliability, then the "Models are unreliable" thread is more appropriate. And Tom13, note models have no skill at decadal level prediction and dont have claim to have any so no sloganeering around that please.
-
John Hartz at 07:59 AM on 20 September 2017Scientific models saved lives from Harvey and Irma. They can from climate change too
Tom 13 @10:
If you read the Met Ofice news release, A Pacific flip triggers the end of the recent slowdown, and watch the two short videos embeded in it, you will learn that PDO and ENSO are two different cycles.
Two key paragraphs from the news release...
Prof Stephen Belcher said: “After a period during the early 2000’s when the rise in global mean temperature slowed, the values in 2015 and 2016 broke records and passed 1 °C above pre-industrial levels. Data from the Met Office shows that the long-term rate of global warming has now returned to the level seen in the second half of the 20th century.”
Although there has been scientific debate about the exact framing of the so-called ‘slowdown’, by looking at rolling 15-year trends, the Met Office confirmed that while the globe remained at near record warmth, the rate of global warming did slow between 1999 and 2014, but now this rate has picked up once more.
-
nigelj at 07:23 AM on 20 September 2017Scientific models saved lives from Harvey and Irma. They can from climate change too
Even 2015 - 2016 would not normally prove anything or indicate fundamental change. It's too short and mixed in with some natural variation, and some agw.
2015 - 2016 is significant mainly because it clearly ended the pause, and this is indeed significant as it shows models are not "broken" and never were.
-
One Planet Only Forever at 07:15 AM on 20 September 2017Scientific models saved lives from Harvey and Irma. They can from climate change too
Tom13,
I am not sure what you are talking aboutregarding trends around 1998.
When I review any of the temperature data sets using a rolling 30 year average (what you would look at to see a 'trend') I do not see any marked change of the slope/trend at 1998. (The exercise I refer to is simple using the SkS Temperature Trend Calculator, just set the moving average to 360)
In the surface temperature data sets there is a flattening in the 50s and 60s. But since then the trend line has just been up. Other than that clear trend change, all I see is a momentary blip in the data line that may disappear if 1998 is igonored as an aberrant value (such a large departure from the other data it is to be excluded from the evaluation).
The satellite data sets are not really the surface temperature, are manipulations of satellite data that are still being adjusted in attempts to get reasonable results, and have too short of a time frame to meaningfully see the trend. But if you set the duration to 25 years (300 months) there is still no sign of a change of trend around the time of 1998 in any of the satellite data sets.
So to be clearer, please explain what you mean when you refer to trends around 1998. Providing mark-ups of the charts of temperature data history that can be generated using the SkS Temperature Trend Calculator would be helpful from my perspective.
-
nigelj at 07:12 AM on 20 September 2017Australia's Transition to Renewable Energy
There seems a lack of a master plan here. They appear to be making it up as they go along. I appreciate its partly politics, but its chaotic and a bit scary.
Say for example if Australia has total reliance on a mix of solar and wind (which seems the sensible thing given their climate) then you will need "x" quantity of gas fired backup, or alternaively "y" quantity of surplus solar and wind as a backup, or alternatively "z" quantity of storage. Or some combination of these. Surely someone has some sort of master plan and calculations? I would be interested if anyone knows and can point me at specific information.
-
nigelj at 06:50 AM on 20 September 2017Scientific models saved lives from Harvey and Irma. They can from climate change too
Tom 13 @5
"The rate of warming since the end of the 2015/2016 El Nino has been very similar to the rate of warming post 1998 El Nino."
Why would you even focus on changes of less than even one year? Its at least partly natural variability, so doesn't indicate anything much about agw. It may continue at a slower rate for a few years as you say, for what its worth but so what?
We are more interested in long term trends. We have an obvious global warming trend over particularly the last 50 years that stands out clearly compared to data over the last 2000 years as in link below. No real sign of last 50 years slowing.
Theres no sign of things fundamentally slowing from 1998 - 2017 either. There was a slowdown from about 2002 - 2010 in the trend line as in the link below from NASA, but it was within realms of natural variability.
I mention all this because you claim to be interested in "historical trends".
-
Tom13 at 06:28 AM on 20 September 2017Scientific models saved lives from Harvey and Irma. They can from climate change too
Nigelj #9
read my post at 10
-
Tom13 at 06:01 AM on 20 September 2017Scientific models saved lives from Harvey and Irma. They can from climate change too
One planet - not sure what you asking -
1998 was a big el nino year and subsequent to the 1998 el nino, the rate of warming slowed considerably until the 2015/2016 el nino. My comment was only that the rate of warming after the 2015/2016 el nino has reverted back to a similar rate of warming that was observed after the end of the 1998 el nino. That slower rate of warming is likely to continue at least in the short term (3-5 years).
-
nigelj at 05:55 AM on 20 September 2017Scientific models saved lives from Harvey and Irma. They can from climate change too
Tom13 @5
"My basis - Historical trends - always a good place to start."
Then follow your own advice. Look at the overall global temperature trend for the last 150 years, a clear historical trend. Theres no sign of a slowdown here.
-
One Planet Only Forever at 05:43 AM on 20 September 2017Scientific models saved lives from Harvey and Irma. They can from climate change too
Tom13,
Just to be clear, are you referring to the temperature trend that can be seen to have been happening around 1998 if the extremely aberrant 1998 temperatures are ignored? Looking at any of the surface temperature data histories 1998 sticks up/out like a sore thumb.
-
Tom13 at 05:27 AM on 20 September 2017Scientific models saved lives from Harvey and Irma. They can from climate change too
A Pacific flip triggers the end of the recent slowdown, News Release, Met Office, Sep 18, 2017
Thats what normally happens after an el nino. though eclectic was the one who questioned the reversion back to a similar warming trend that was in play after the 1998 el nino.
-
John Hartz at 05:25 AM on 20 September 2017It's Pacific Decadal Oscillation
Recommended supplemental reading...
Following three record years for global surface mean temperature in 2014-2016, the observed recent slowdown in average global temperature has ended.
A Pacific flip triggers the end of the recent slowdown, News Release, Met Office, Sep 18, 2017
-
John Hartz at 05:07 AM on 20 September 2017Scientific models saved lives from Harvey and Irma. They can from climate change too
Tom 13 @5: Per the Met Ofice...
Following three record years for global surface mean temperature in 2014-2016, the observed recent slowdown in average global temperature has ended.
A Pacific flip triggers the end of the recent slowdown, News Release, Met Office, Sep 18, 2017
-
Tom13 at 01:21 AM on 20 September 2017Scientific models saved lives from Harvey and Irma. They can from climate change too
Eclectic -
Tom13 @3 : quite so — though you are bold to predict a flattening of the rate of warming (for 2017 onwards). Do you have any reason for suggesting that?
My basis - Historical trends - always a good place to start. The rate of warming since the end of the 2015/2016 El Nino has been very similar to the rate of warming post 1998 El Nino.
-
Eclectic at 01:06 AM on 20 September 2017Scientific models saved lives from Harvey and Irma. They can from climate change too
Tom13 @3 : quite so — though you are bold to predict a flattening of the rate of warming (for 2017 onwards). Do you have any reason for suggesting that? After all, there has been no reduction of the rate of heat energy accumulation (i.e. no reduction of the rate of nett energy inflow at Top Of Atmosphere).
The "geoethic" reference you supplied, is a link to a determinedly foolish denial of the physical processes that are causing the ongoing global warming (as evidenced by recent years' observations of surface temperature and ocean heat content). It's a case of denialism both stubborn and foolish.
-
Tom13 at 23:06 PM on 19 September 2017Scientific models saved lives from Harvey and Irma. They can from climate change too
I agree that it is inappropriate to only compare Hansen's A scenario against actual observed temps.
Hansen had three basic scenarios A: increase in CO 2 emissions by 1.5% per year, B: constant increase in CO 2 emissions after 2000, C: No increase in CO 2 emissions after 2000.
Through 2013, the observed global temps were slightly under the C scenario while the emissions were running slightly ahead of the projected A scenario. Then in 2015& 2016, with El Nino, the observed temps are running slightly under the Scenario B projected temps. So far in 2017 (after the 2015/2016 El Nino), the temps appear to be reverting back to the rate of warming observed since the 1998 El nino. (it is premature to reach a conclusion as to whether the slower rate of warming will hold since we only have 8 month of data.)
geoethic.com/2015/11/27/james-hansens-climate-models-versus-observations-1958-%C2%AD2015/
Moderator Response:[PS] Discussion of Hansen 1988 goes here.
-
nigelj at 15:46 PM on 19 September 2017Scientific models saved lives from Harvey and Irma. They can from climate change too
Moderator, ok I should not have implied dishonesty. My bad.
But your own article above said and I quote "In his testimony, Michaels essentially committed perjury in a reprehensibly dishonest effort to discredit Hansen’s 1988 global warming predictions."
So you see how I was tripped up? You have a problem with consistency somewhere here. Its very confusing the mixed signals.
I stand by all the rest of what I said. I cant see how any of it infringes comments policy and you don't say. I quoted his wikipedia profile all of which include original source material referenced in a bibliography. I dont have all day to do more. And I wont be doing more.
-
scaddenp at 13:36 PM on 19 September 2017How much does animal agriculture and eating meat contribute to global warming?
Thanks very much. That is the general gist that I wanted. And plantago cultivars is what is being pushed.
-
nigelj at 13:28 PM on 19 September 2017Scientific models saved lives from Harvey and Irma. They can from climate change too
My personal view is P Michaels has no scientific integrity at all. It's lies by omission, with huge implications. Its just not something that can be brushed off lightly.
The guy has very little actual climate expertise. His degree is in biology. Quite why politicians listen to a biologist on predicting climate trends is beyond me, as its a question of atmospheric physics, climate history and processes, and computer modelling.
From Michaels wikipedia page:
"Climate scientist Tom Wigley,[33] a lead author of parts of the report of the Intergovernmental Panel on Climate Change, has stated that "Michaels' statements on the subject of computer models are a catalog of misrepresentation and misinterpretation … Many of the supposedly factual statements made in Michaels' testimony are either inaccurate or are seriously misleading."[34]"
"Michaels acknowledged on CNN that 40 per cent of his funding came from the oil industry.[39]"
Moderator Response:[PS] Time to have another look at the comments policy.
-
RedBaron at 12:56 PM on 19 September 2017How much does animal agriculture and eating meat contribute to global warming?
@ scaddenp,
Well there are a lot of considerations my friend. Not sure exactly what you are getting at.
The general rule of thumb is that carbon improves the cation exchange capacity of soil, which makes for more efficient use of all nutrients including Nitrogen.
Black Carbon Increases Cation Exchange Capacity in Soils
One of the benefits of mycorrhyzal fungi symbiosis is a far more efficient use of nitrogen. The fungi trades this for sugars that ultimately become part of the LCP (Liquid Carbon Pathway).
So over fertilizing with nitrogen means the plant has no need for the symbiosis. Less carbon gets sequestered by the LCP. It's even worse with phosphorus cycle. That will shut down the LCP completely even in some cases killing off the AMF. Once they are gone the nitrogen and phosophorus will leach rapidly. Lower carbon lower cation exchange capacity, lower efficiency of use of fertilizers, more being applied and more leaching. It is a downward spiral until the soil essentially gets beat to death so badly it is no longer arable.
But there is a different side to it as well. Carbon will hold nitrogen and help prevent its leaching too. But if the carbon is the labile fraction of soil carbon, then the effect is both temporary and will eventually result in excess CO2 production. It can in certain cases even cause well stabilized humus to break down into CO2 too.
I hope that gives you a general gist and for more details, just be more specific and I will reply with references in greater detail too.
PS You mean plantains like bananas? Or plantains like genus Plantago?
-
nigelj at 11:54 AM on 19 September 20172017 SkS Weekly Climate Change & Global Warming News Roundup #37
Chriskoz @2
I agree with several of your criticisms! There was some obvious"hype" in Tonys presentation and he's not a scientist, engineer or inventor as such.
I just thought the video was interesting and well worth time spent. It was quite interesting even on just progress to date, which is more than I realised.
But you are right its very danagerous taking a past trend and projecting the trend forever. Moores law has run out of steam and drifted sideways into multiple computer cores.
Solar panels will drop more in price, but won't decrease in price forever or even that much hugely more, especially as they use a significant volume of raw material, unlike a microprocessor or smartphone!
His revolution will take longer than five years (or whatever it was). But that doesnt make it a failure.
Batteries. Theres enough lithium in known reserves for a billion cars from some calculations I saw, and that's before more reserves are found or its recycled. So I dont think he was unrealistic on lithium power.
Other battery technologies are quite well advanced like aluminium batteries. Im a dry old realist, but I do think its basically looking promising.
What am I saying? Tony is over optimistic and naieve on some things, but the total picture still looks pretty good.
Another thing. Convergent technology is a valid factor but half the reason the Iphone took off was probably sexy looks, reliability, pocket size. Theres more to it than Tony thinks.
-
scaddenp at 10:28 AM on 19 September 20172017 SkS Weekly Climate Change & Global Warming News Roundup #37
While I certainly dont believe in limitless growth, I think EV and solar can expand massively. As far as I know Li-ion batteries dont use any rare earth minerals (which as has been pointed out are neither rare nor earth) though NiMh used by Prius does. Various rare earths are very useful for making powerful magnetics and certainly are heavily used by EV. But is this necessary for the tech or simply a good economics at the moment? Turbines are also big users of RE for the exactly the same reason. However, you dont need RE for a turbine. Enercon have 40% of market for wind turbines in Germany and dont use any.
While there are environmental impacts from solar cell production, I am far from convinced that they are larger than the other forms of generation that they are replacing.
-
chriskoz at 08:45 AM on 19 September 20172017 SkS Weekly Climate Change & Global Warming News Roundup #37
Nigel, let me criticize Tony's talk.
He introduces the technolog adopting curve as an "s-shape". Then focuses on the assending part of the "s" only for trhe rest of his talk. I.e. he assumes that his exponential, even more than exponential, growth in adoption of solar, battery storage, EV and AV (authonomous vehicle) will continue unconstrained.
He does not even considers the known limits of expensive rare earth mineral mining needed for production of batteries and environmental impact of solar cell production and keeps counting the years till solar energy doubling every year becomes so cheap that it disrupts not just utilities but the whole buseness model.
To that bunkum, I can respond: you don't need to fly to the Moon just keep folding a piece of paper until you manage to fold it 50 times. After 50 doublings, a 0.1mm think piece of paper becomes 500,000 km those reaching the Moon. Here is your space trip! It puts the entire NASA program obsolete and all world space agencies of of business. My example is of course sarcastic but logically there is no deifference between it and Toby's talk.
Obviously, Tony's bunkum is a typical application of a pyramid scheme without any considerations of physical resource limits while scaling his ideas to the level of "global disruption". In order to be more realistic, he must show that there is enough resources on the planet for his disruption to be physically possible. Certainly there is enough sunshine, but I'm not so sure about batteries though and speed of battery recharging. There are just basic things. Maybe he explains it a bit in his book and someone who read it can convince me his ideas are a bit more than just pramid scheme, because just listening to him talking, I'm just skeptical and don't even want to waste money on this book.
-
scaddenp at 08:10 AM on 19 September 2017How much does animal agriculture and eating meat contribute to global warming?
Calling Red baron - what do you about the relationship between nitrogen utilization by plant and effects on soil carbon? Nitrogen leaching into waterways is big issue here and there has been some trumpeting over a strain of plantain that can halve nitrogen leach rates. I was wondering what effect that might also have on carbon pathways since I remember a talk which linked the two.
-
william5331 at 06:16 AM on 19 September 20172017 SkS Weekly Climate Change & Global Warming Digest #37
To the deniers, I say, Forget Climate Change
http://mtkass.blogspot.co.nz/2010/10/forget-climate-change.html
-
Breakyerself at 05:30 AM on 19 September 2017There's no empirical evidence
A lot of the links to sources on the intermediate section are dead links or just go to a top level domain. I've found new links for a few if you want to update them. It's probably not all of them. Just the ones I was looking for anyway.
http://onlinelibrary.wiley.com/doi/10.1029/2003GL018765/abstract(Philipona 2004)
http://onlinelibrary.wiley.com/doi/10.1029/2009JD011800/abstract (Wang, 2009)LINK (Chen, 2007)
http://spie.org/Publications/Proceedings/Paper/10.1117/12.556803(Griggs, 2004)
LINK (Harries, 2001)Moderator Response:[PS] Sadly, an endless problem. Thanks for those. I have converted to links.
[RH] Shortened links.
-
Tom Dayton at 00:20 AM on 19 September 2017Water vapor is the most powerful greenhouse gas
MartianSky: The CC relation by itself applies if all else is equal. But Earth's atmosphere is very diverse, so the CC relation applies in very local conditions. For example, when rain forms in the atmosphere, relative humidity is 100% at that precise spot at that precise time. But even as those raindrops fall, often they pass through air of such different pressure or temperature that the rain evaporates before hitting the ground. The atmosphere varies dramatically and dynamically in pressure and temperature at scales from tiny to huge, so the CC relation can be perfectly valid in each of all those locales, but the availability of water in a given piece of air at a given moment can be inadequate for the water to fully fulfill that role. The availability of particles that act as condensation nuclei also affect the ease of condensation; ultra clean and unmoving air can have relative humidity of more than 100%, similar to a supersaturated solution. In short, the CC relation is not the only thing relevant to relative humidity, and it applies only in approximation at scales larger than micro in the real atmosphere, due to the inhomogeneity of the real atmosphere.
But none of that matters for the purpose of figuring out whether water vapor is a feedback or a forcing of temperature in Earth's conditions. What matters is that, all else being equal, water vapor injected into air at a given temperature and pressure will condense out--in 10 days as a global average.
Moderator Response:[DB] This is yet another iterative sock puppet of serial spammer cosmoswarrior. Leaving the interchange up for edification purposes and transparency.
[PS] Wont do anything to edify our sockpuppet master based on past ironclad ability to miscomprehend anything that contradicts his/her denial.
-
RedBaron at 21:56 PM on 18 September 2017Exit, Pursued by a Crab
Andy,
I suppose I have delayed posting simply due to the subject cutting a bit too close for comfort. I just lost my Dad this year after a decades long struggle with congestive heart failure. But I wanted to show my appreciation for all you have done in the fight to educate and mitigate AGW.
Indeed we don't agree often. I don't see us needing to sacrifice to mitigate AGW. The opposite in fact. We are spending billions making sure it does happen...foolishly. Your comments on Geoengineering seem crazy to me. Completely ignoring that 1 we are geoengineering now, and 2 the LCP works because the fossil carbon has to oxygen attached, not in spite of it. Though we disagree on a few thing I still count you as an important ally though, especially your vids.
Keep up the good work.
-
John McKeon at 21:03 PM on 18 September 2017Exit, Pursued by a Crab
My post is too late to speak to Andy, but I want to say anyway how much I appreciated watching and listening to him on video talking about climate change along with its social context & problems. My best wishes to those closest to him.
-
Rovinpiper at 20:34 PM on 18 September 2017IPCC admits global warming has paused
I strongly recommend you have a read of the paper.
Thanks. I'll do that.
-
MartianSky at 17:02 PM on 18 September 2017Water vapor is the most powerful greenhouse gas
John Cook
Are you certain it is the Clausius-Clapeyron (CC)relation that governs the amount of water vapor brought into the atmosphere by evaporation? Remember that this relation predicts equilibrium (or saturation) values of the water vapor concentrations, which may or may not be the actual concentrations. If the CC equation is used for obtaining H2O vapor concentration as you explain, we would be assuming 100 percent relative humidity everywhere, which I believe leads to a great over-estimation of the water vapor positive feedback you describe.
Moderator Response:[DB] A general note to readership: this user is yet another fake-account sock puppet created by serial spammer cosmoswarrior (who's real identity I shall refrain from publishing). Posting rights rescinded as per the Comments Policy; this interchange shall remain for transparency and edification purposes.
-
Ari Jokimäki at 15:51 PM on 18 September 2017New research, August 21-27, 2017
Thank you all. :-)
-
scaddenp at 09:01 AM on 18 September 2017Arctic sea ice loss is matched by Antarctic sea ice gain
The final nail in myth? A study of long term satellite observations shows that increase in absortion of shortwave due to arctic seaice loss is not being compensated by the Antarctic.
-
scaddenp at 07:05 AM on 18 September 2017IPCC admits global warming has paused
Further to that, note that I said OHC was calculated as temperature change integrated over depth. ie it is always with respect to a baseline. The methodological paper describing OHC say this right at the start: "We use the term “ ocean heat content” as opposed to “ocean heat content anomaly” used by some authors because “ocean heat content” is an anomaly by definition. OHC is always computed with a reference mean subtracted out from each temperature observation. Otherwise the OHC computation depends on the temperature scale used."
Thus you obviously get "negative" OHC when temperature is less than baseline. I strongly recommend you have a read of the paper. This was calculation done in 2012, but you can follow results from same methodology published here.
-
supak at 04:04 AM on 18 September 2017New research, September 4-10, 2017
Thanks, barry!
-
One Planet Only Forever at 01:53 AM on 18 September 2017Global weirding with Katharine Hayhoe: Natural Cycles
nigelj@8,
My summary take-away from the article is that the timing and rapid rate of CO2 addition currently occurring is not helpful.
The increase of CO2 from 240 ppm to 280 ppm that occured before the 1800's is indicated to be sufficient to delay glaciation for 50,000 years.
What is currently being done is Too Much, Too Rapidly, Too Early to be beneficial.
So, the maximum amount of Fossil Fuels needs to be kept in the ground to give future generations the best opportunity to sustain advancements/development.
Perceived advancements that cannot be sustained are delusions. And some of those popular delusions about 'advancement of properity' are understandably very damaging yet remain popular and profitable, continuing to be encouraged or 'permitted' to be gotten away with.
I consider the desires to abuse the 'increased understanding of how to Win through misleading marketing' to be the greatest threat to the future of humanity that humans have ever developed.
SkS is well focused on the real problem as it relates to climate science - diminishing the ability of people to Win by abusing the science of marketing.
Every group pushing for one or more of the Sustainable Development Goals needs to have the same focus on misleading marketers. And all of those different groups need to support each other so that their collective 'pursuit of increased global awareness and better understanding to sustainably advance all of humanity' can Win over 'the United Groups trying to Win the Right to benefit from the understandably harmful things they want to prolong their ability get away with through the abuse of Poor Excuses to Temporarily Regionally Tempt people to support things that do not deserve to be Popular or Profitable'.
-
Eclectic at 22:10 PM on 17 September 2017IPCC admits global warming has paused
Rovinpiper @15 , the IPCC chart you mention has the basic purpose of showing the alteration in accumulated energy — so you must expect a "negative" level as you go back in time. If you were thinking of the tiny "negative dips" around 1980 and 2000 etc, then you will have noticed that they are insignificant compared with the uncertainty bounds of the measurements.
Possibly a real "negative dip" could occur for a year or two if there were some very major volcanic eruption that shot enough fine [reflective] particles into the upper atmosphere. But that would be brief, and global warming would soon resume. When you think it through, you will see that the warming greenhouse effect of [primarily] CO2 is causing a heat inflow into the planet [an inflow averaging approximately 2 watts per squ.meter or in other words roughly 7,000 horsepower per squ. mile] and this is going on 24/7 and year round . . . and will continue until Earth reaches a new higher equilibrium temperature (many years after we have achieved zero net CO2 emissions in [hopefully] year 2050 or 2060 — or maybe 2080, the way our politicians are dawdling over the emissions problem! ].
And you will recognise that a genuine pause is impossible, under the present conditions of ongoing CO2 emission. That's why any "pause" can only be a Myth !
-
Rovinpiper at 21:01 PM on 17 September 2017IPCC admits global warming has paused
Okay, so that means that temperature is measured and the energy is calculated from the temperature, mass, and specific heat of the media in question, right?
It's strange to me that the energy accumulation is below zero at c. 1971. Negative energy isn't possible, is it? Am I right to conclude that it has to be an artifact of the comparatively huge uncertainties in the measurements at that time?
The energy content of ice is not something that I'd ever thought about before, but it makes sense. Earth can get much colder than 273 K, so much of the ice has considerable warming up to do before it melts. -
nigelj at 17:51 PM on 17 September 20172017 SkS Weekly Climate Change & Global Warming News Roundup #37
This video is well worth a look regarding future of electric cars, disruptive technologies, and solar power:
It also covers self drive cars and future of personal transport generally. By pulling it all together with in depth historical evidence and studies of falling prices as well as projections, it really is an eye opener, and shows how much just the economics alone is driving this thing, as well as reducing emissions.
-
Tom Curtis at 13:13 PM on 17 September 2017Greenhouse Effect Basics: Warm Earth, Cold Atmosphere
RSaar @128, first I need to correct myself slightly. What I should have written is that:
"If the gas is at the same temperature as the source of the IR radiation (and ignoring reduction of intensity of radiation due to the inverse square law), the combined energy radiated from the ghg in any given direction will equal the amount absorbed by the IR gas from the IR source."
In my original statement I had in mind only the outward radiation.
What this means is that if the temperature of the atmosphere was uniform, and the same as that at the surface, the outgoing IR radiation at the Top Of the Atmosphere (TOA) would be the same as the outgoing IR radiation at the surface. In fact, however, the temperature generally falls with altitude, and nearly always does in the thickest part of the atmosphere from which most outgoing radiation from the atmosphere originates (the troposphere). The consequence is that at those wavelengths where all, or nealy all of the upwelling IR from the surface is absorbed, the outgoing IR radiation from the atmosphere, which comes from a cooler source, is less than that from the surface. That is illustrated in the first graph from the OP (shown below):
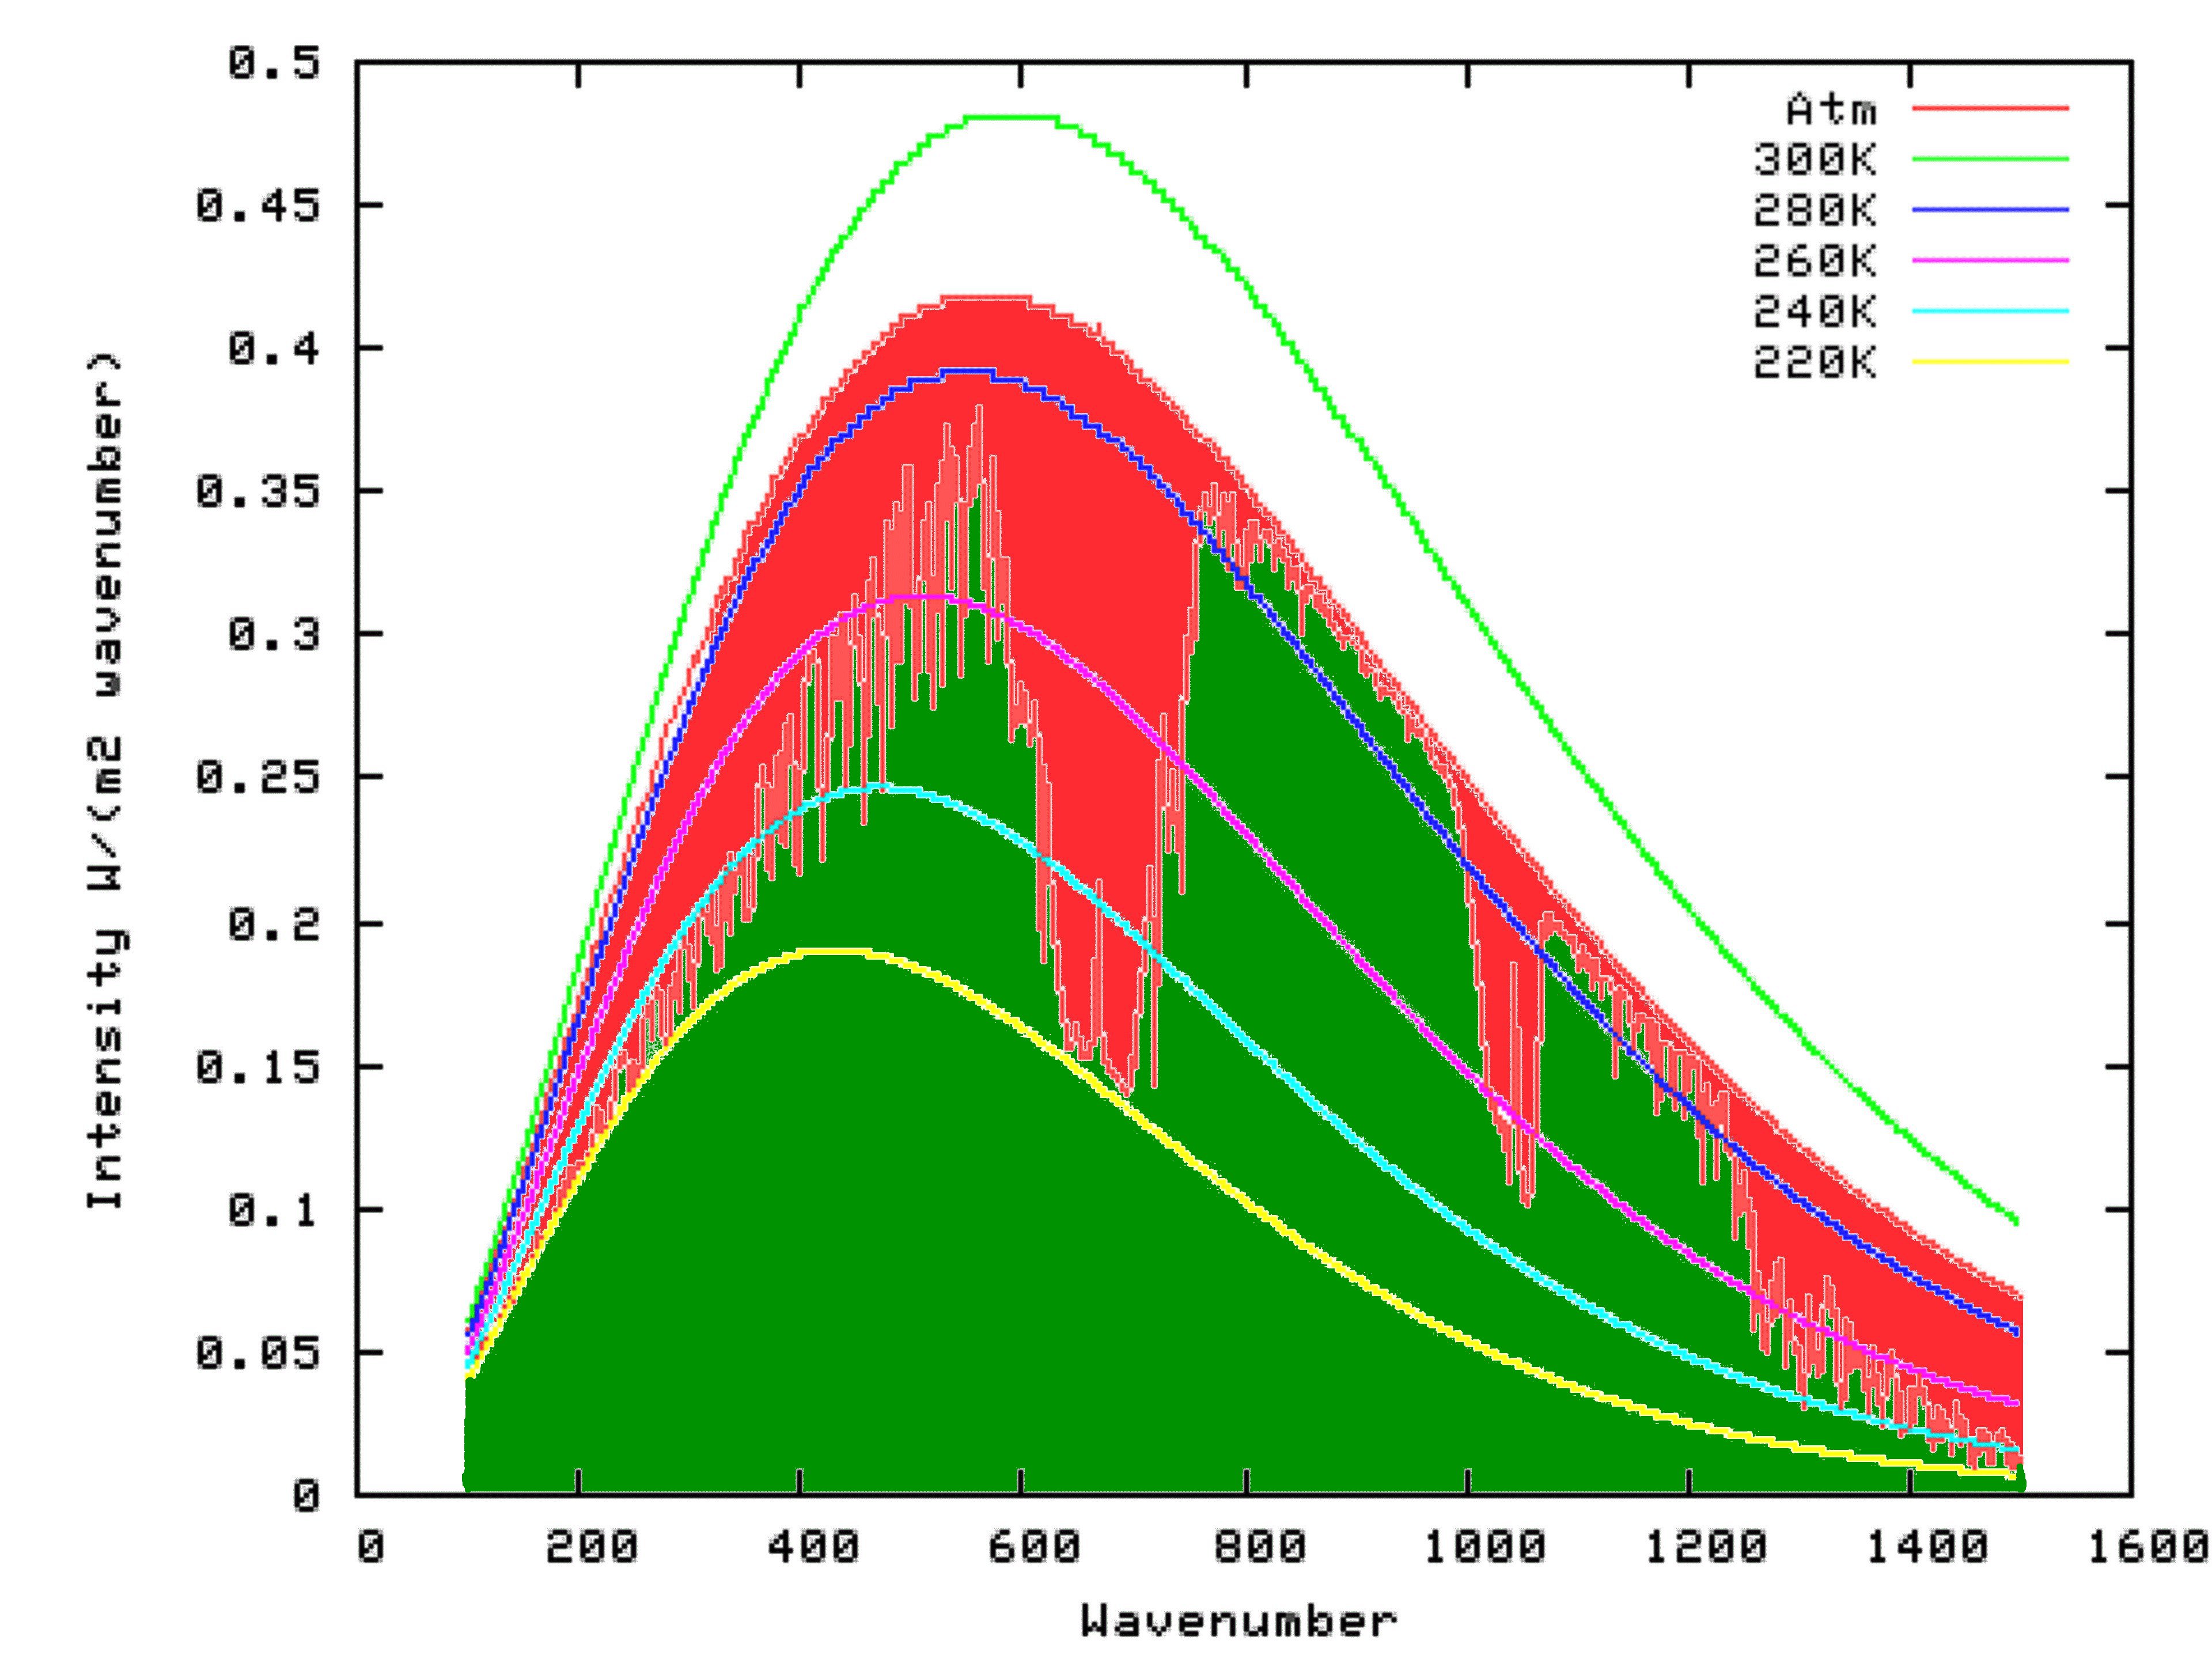
Averaged across the entire Earth, the effect is that the upwelling IR radiation at the surface is significantly greater than the outgoing IR radiation at the TOA (consisting or upwelling IR radiation from the atmosphere, plus whatever IR radiation from the surface which was not absorbed by the atmosphere), and that difference is the greenhouse effect. The point of the OP is that this is directly a function of the temperature structure of the atmosphere. With equal temperatures there would be no greenhouse effect, and if the atmosphere were warmer than the surface, you would have a reverse greenhouse effect.
-
scaddenp at 07:53 AM on 17 September 2017IPCC admits global warming has paused
Yes, the oceans are warming, and the energy accumulatation is calculated by integrating temperature change over depth.
-
Bob Loblaw at 23:25 PM on 16 September 2017Greenhouse Effect Basics: Warm Earth, Cold Atmosphere
RSaar:
This post over at Rabett Run gives a good explanation of the likelhood of CO2 losing energy by emission or collision. You will find it in agreement with what Tom Curtis said.
Air and earth are not at the same temperature - air temeprature generally decreases with height. If you look at surface net IR, it is overal a loss of energy from the surface, but the rate varies.
Outgoing IR is roughly estimated by the Stefan-Boltzman equation using surface temperature. (Surface is a very good, but not perfect emitter). It can 250, 300, 400 W/m^2 at a typical range of cold-to-warm temperatures.
Incoming IR from the atmosphere is not so easily estimated, as the atmosphere is a less efficient emitter and what arrives at the surface comes from a range of heights (and air temperatures). With low oevercast, it will be similar to outgoing IR - cluds are good emitters. In clear skies the incoming IR is substantially less than outgoing IR. A typcial range is for incoming IR to be anywhere from a few to 150 W/m^2 less than outgoing IR. This holds true over a wide range of surface temperatures.
-
Swayseeker at 23:02 PM on 16 September 2017New research, September 4-10, 2017
Regarding aerosols and decreased cyclone activity research, as I have said before, one can cool Earth and especially the hurricane region by evaporation by using floating spray mist pumps operated by wave motion. Scientists once believed that evaporation could even warm Earth because of increased water vapour (a greenhouse gas), but when more evaporation was fed into climate models it showed that with increased low level clouds, from increased evaporation, the Earth cools with evaporation - see some of the sites that talk about this ( https://www.sciencedaily.com/releases/2011/09/110914161729.htm for example). Mist spray over the ocean (which happens when the wind blows hard), from mist spray generators, would prevent solar energy from entering the ocean and would cool by evaporative fine mist cooling. With cooler ocean hurricanes will not form so easily.
-
Rovinpiper at 21:34 PM on 16 September 2017IPCC admits global warming has paused
I don't understand the concept of the warming of the entire climate system. If the oceans, for instance, are accumulating energy is that reflected as an increase in their temperature?
The first figure shows energy accumulation. I think the units are Zettajoules. Is that right? How is energy accumulation measured? -
JohnSeers at 19:51 PM on 16 September 2017Greenhouse Effect Basics: Warm Earth, Cold Atmosphere
Hi Tom
Just to say that the link to MODTRAN above does not work:
http://forecast.uchicago.edu/Projects/modtran.doc.html
How about this one:
http://climatemodels.uchicago.edu/modtran/
Moderator Response:[PS] Fixed link. Thanks for finding that.
-
RSaar at 16:19 PM on 16 September 2017Greenhouse Effect Basics: Warm Earth, Cold Atmosphere
Thank you for the reply. Though not sure i can put this quote to context at all.
If the gas is at the same temperature as the source of the IR radiation (and ignoring reduction of intensity of radiation due to the inverse square law), the combined energy radiated from the ghg will equal the amount absorbed by the IR gas.
Air and earth being at same temp? Was this meant to say that against 3K cosmos, eventually all that absorbed from IR source (earth) gets emitted?
-
barry1487 at 13:07 PM on 16 September 2017New research, September 4-10, 2017
Eg, from this 2010 paper:
The results support the Intergovernmental Panel on Climate Change Fourth Assessment Report; reduction in global frequency but increase in more intense TCs.
http://onlinelibrary.wiley.com/doi/10.1029/2010GL042518/full
Prev 346 347 348 349 350 351 352 353 354 355 356 357 358 359 360 361 Next


