


 Arguments


Recent Comments
Prev 410 411 412 413 414 415 416 417 418 419 420 421 422 423 424 425 Next
Comments 20851 to 20900:
-
MA Rodger at 21:11 PM on 21 February 20172nd law of thermodynamics contradicts greenhouse theory
Rob Honeycutt @1491,
I agree that when explaining the GH effect, at a minimum there is a willful prejudice being employed when an immutable counter-argument wielded against both "blanket" and "greenhouse" as an analogy (or metaphor or whatever) is of the form as presented @1482 (ie - "One is a solid and one is a gas.").
But my thought is to break that immutable nonsense rather than live with it. Thus my position trying to revitalise both the "blanket" and the "greenhouse" as strong analogies for the GH effect.
Thus I would argue as follows.
Note the follow-on comment @1482 "A solid object like a blanket will impose on the rate of heat loss through the loss of convection." A blanket does not trap air anything like as well as the lower atmosphere. The plume of hot gas passing through a blanket is travelling at quite a rate (as this test shows - note 400ft/min =2m/s) And greenhouses are not hermetically sealed but are actually far more leaky that the lower atmosphere, even commercial ones. The lower atmosphere retains parcels of air for a week or more. The same cannot be said for either any blanket or any greenhouse.
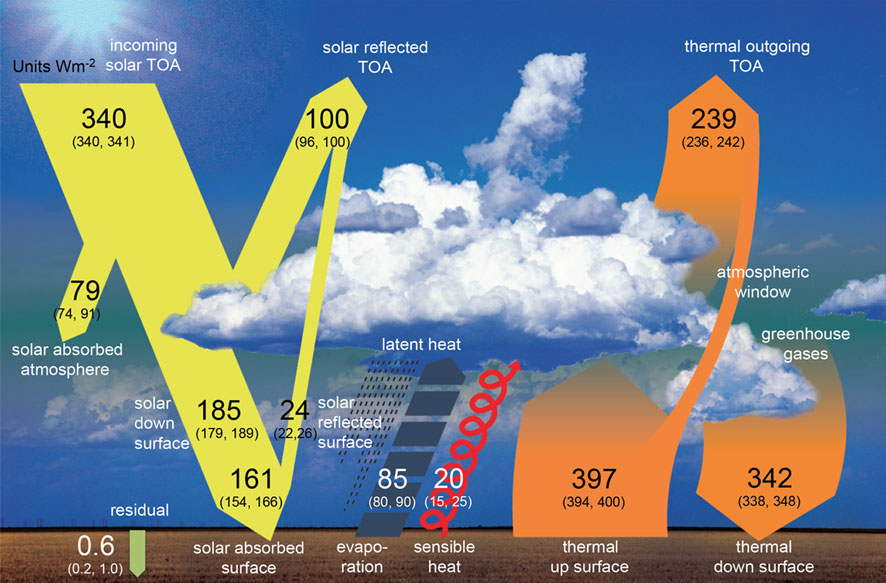
And this slow action of the atmosphere circulation is probably best explained by the planet Earth being so big and tha atmosphere so shallow. In the tropics a latitudinal band measuring say 1,000 km is heated and so it is wanting to rise up and displace the cooler air above it. This creates a Walker Cell which will flow away from the tropics at the top of the atmosphere where it cools by radaition into space and so cooled drops back down to the surface outside the tropics. The problem for the "big convetion" argument is that the longitudinal winds at the top of the atmosphere (and the balancing ones in the lower atmosphere) are much less than 10m/s. This speed of wind is the result of the upward convetion flow from the tropics but the <10m/s represents a massive acceleration from the vertical convetion speeds - because comparatively the tropics are very broad but the atmosphere is rather shallow. If the vertical motion feeding this <10m/s is 1,000km wide, the upward speed has to be <0.02m/s which means the air in any "big convetion" cooling circulation will take >600,000 seconds or seven days to reach the top of the atmosphere. Radiation, on the other hand, is flying about at the speed of light. So it's not much of a contest, is it? Thus the values of the various fluxes in the Earth Energy Balance diagram as shown @1488 show very small quantities of convection in operation.
Now this last bit referring to the diagram is a bit of a throw-away remark. The diagram in its original form did describe the sensible heat flux as "thermals" (eg in Trenberth et al 2009 figure 1) which is wrong. But I'm not sure it is entirely wrong.
-
michael sweet at 20:52 PM on 21 February 2017Expect to see more emergencies like Oroville Dam in a hotter world
Jipspagoda,
It is common knowledge that there are large rains in the American West on 100-200 year intervals. California and the feds decided that it was not worth ,spending the money for an event that has not happened since 1862. As pointed out above, AGW made the flood worse. It is very unlikely that with natural forces alone that Oroville dam would have neared faliure this year. AGW added the extra to force failure.
They are expecting 10 inches (25 cm) of rain at Oroville this week from a new storm. Other reservoirs are full and there will be significant flooding. Oroville expects to be low enough to slow the flood as long as the damaged main spillway holds out. The rainy season is nearing its end. How much water will fall in March?
What Ubrew12 said x2.
-
chriskoz at 19:59 PM on 21 February 2017Expect to see more emergencies like Oroville Dam in a hotter world
Situation in CA is identical to "inland tsunami" fluds in QLD 6 years ago. After a decade of misarable drought, the freak and very intense rains filled Wivenhoe Dam to some 170% of its capacity. The dam operators must have spilled signifficant amount of water, otherwise it may not have held. Everyone was quick to blame dam operators (ditto as jipspagoda@1,3 above) but refused to acknowledge the unprecedented weather event (weather on steroids is avery accurate term here) leading to the tragedy; and at the same time tried to dismiss any links to AGW with "weather has always been unpredictable" trolls (exactly as jipspagoda@1,3 above). Give me a break, deniers: how many times do we need to repeat the obvious that AGW signal is responsible for increasing magnitude of extreme precipitation events like this one in CA and recent one in QLD? You can argue that the dam operators could have better handled the emegrencies (if they could have predicted the magnitude of these emergencies 50y ago) but do not dismiss the obvious influnce of AGW signal here, as proven by climate scientists and the long term weather data.
-
ubrew12 at 19:14 PM on 21 February 2017Expect to see more emergencies like Oroville Dam in a hotter world
The main spillway failed due to unprecedented volumes of water cascading down its length. Where did all that water come from? 1) falling as rain rather than snow (AGW), 2) unprecedented amounts of rain (AGW), 3) falling on hillsides denuded by five years of unprecedented drought (AGW). I'm not surprised that infrastructure like this is taxed past its design limit by the unprecedented conditions that have long been associated with AGW. It's part of a pattern, as the author states "what we’re seeing is consistent with climate scientists’ expectations of a hotter world." Munich Re recently reported that severe flood events in Europe have doubled since 1980. So it would be folly to not ready our infrastructure for more of this: the point of this article.
-
scaddenp at 13:19 PM on 21 February 2017Expect to see more emergencies like Oroville Dam in a hotter world
The issue is that GW increases the frequency of major rainfall events and thus the risk, something the environmental groups challenging the spillway safety 12 years were well aware of.
-
jipspagoda at 12:22 PM on 21 February 2017Expect to see more emergencies like Oroville Dam in a hotter world
MS,
http://www.mercurynews.com/2017/02/12/oroville-dam-feds-and-state-officials-ignored-warnings-12-years-ago/
Extreme droughts and floods have happened in the past and will happen in the future. Seems more like failure to plan for the past and the future to me
-
Tom Curtis at 12:13 PM on 21 February 2017Correcting Warren Meyer on Forbes
"One more error is, he claims Al Gore states that, "...we will see a tipping point where temperatures will run away, [Gore] is positing that feedbacks will be nearly infinite (a phenomenon we can hear with loud feedback screeches from a microphone)." Nope. Sorry. That is Mr. Meyer's misunderstanding and is nothing that Al Gore has ever stated."
I did a bit of research and managed to find the source for Al Gore's claims about "tipping-points". It turns out to be a conflation of a comment Gore made to CBS news in 2006, and a review of An Inconvenient Truth, by James Hansen.
CBS reported on January 26th, 2006 that:
"And politicians and corporations have been ignoring the issue for decades, to the point that unless drastic measures to reduce greenhouse gases are taken within the next 10 years, the world will reach a point of no return, Gore said.
He sees the situation as "a true planetary emergency.""
You will notice that while the sentiment is Gore's, the initial sentence contains no quotations, and hence no indication that the term "point of no return" was Gore's.
Meanwhile, in his review of "An Inconvenient Truth", Hansen expressed similar views when he wrote:
"Any responsible assessment of environmental impact must conclude that further global warming exceeding two degrees Fahrenheit will be dangerous. Yet because of the global warming already bound to take place as a result of the continuing long-term effects of greenhouse gases and the energy systems now in use, the two-degree Fahrenheit limit will be exceeded unless a change in direction can begin during the current decade. Unless this fact is widely communicated, and decision-makers are responsive, it will soon be impossible to avoid climate change with far-ranging undesirable consequences. We have reached a critical tipping point."
In January, 2016, Anthony Watts published an article by Jaclyn Schiff, which quoted the NBC article, before saying:
"Well, the 10 years are about up, by now, warming should have reached “planetary emergency levels” Let’s look at the data:
...
As you can see, little has changed since 2006. Note the spike in 1998, in the 18 years since the great El Niño of 97/98, that hasn’t been matched, and the current one we are in isn’t stronger, and looks to be on the way to decaying. So much for the “monster” El Niño."
In the space covered by the ellipsis, Schiff published a graph of the UAH TLT temperature through to Nov 2015. Why November, given that the Dec 2016 data was published by Roy Spencer on January 5th, 2016. Perhaps it had something to do with the December values being higher than those of October, hence giving the lie to the claim that the temperatures "looks to be on the way to decaying". Regardless, hindsight shows her claims to be utterly baseless:
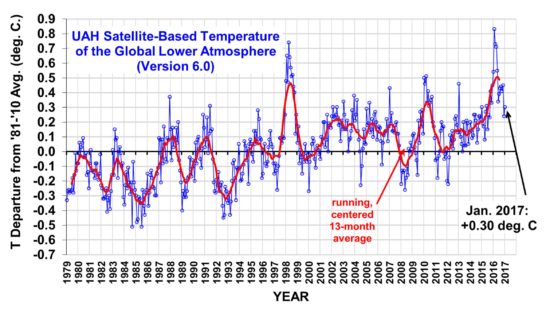
Indeed, so also did foresight for anybody aware of the relative delays of surface and mid troposphere temperature responses to ENSO fluctuations.
More important than any shenanigans with out of date temperature data is the complete misunderstanding of what Gore is reputed to have said.
Going back to the original NBC metaphore, a point of no return is that point in a flight, or expedition, were turning around will not leave you with sufficient fuel (or supplies) to return to base. It could also be used of a scenario where you are driving rapidly towards the lip of the Grand Canyon, in which case the point of no return is that point at which no amount of braking, or rapidity of turning will prevent you from going over the lip. In neither case is there any sudden change in your conditions. The point of no return on a flight is not a point of sudden turbulence; and the point of no return as you follow Thelma and Louis to a premature death is as smooth as any other point you had traversed on the trip thus far.
Applying this to Gore's thought, clearly he was saying (whether using that phrase or not) that if radical action was not taken by (approximately) 2016, then we would have reached a point where no economically achievable measures could prevent CO2 concentrations rising sufficiently to cause temperatures to pass the threshold beyond which their impacts are considered dangerous. No sudden jump in temperature is predicted, and nor is it predicted that the temperature increase by 2016 will itself have passed a dangerous threshold.
In any event, Schiff's misunderstanding was then picked up by the deniasphere, with Hansen's term frequently substituted. From there, it was apparently further misinterpreted by Warren Myer.
Ignoring the gross misrepresentations without which deniers have no argument, the question is whether or not we have in fact passed Gore's 'point of no return', or Hansen's "tipping point". The answer is that we do not know. We may have, and if we have not we certainly will do so soon. My feeling is that we have for a 1.5oC increase above the preindustrial, but not quite yet for a 2oC threshold. Unfortunately, whether we have or have not passed it, the actions of Trump in the US, and Turnbull in Australia seem geared to ensure we pass it very soon, if we have not already.
-
Rob Honeycutt at 08:51 AM on 21 February 2017Correcting Warren Meyer on Forbes
joe... I think you're misinterpretting here. In the article, I'm stating that Warren says the IPCC merely makes up positive feedbacks. That is clearly not true. On the other hand, Warren does make up the idea of negative feedbacks dominating, which would make CS lower than the direct effect of CO2. That is not scientifically supportable.
And, no, there's not been any retreat from the position on the estimates of climate sensitivity. They remain basically where they've been for many decades.
-
michael sweet at 08:46 AM on 21 February 2017Expect to see more emergencies like Oroville Dam in a hotter world
Jipspagoda,
Do you really want to not tell people that a large part of the problem is caused by AGW? Even if AGW is only responsible for 20% of the precipitation, the flooding would not have happened without that contribution. The main spillway is reported to have failed due to erosion from the heavy rains so it has the same ultimate cause. If it was not warmer due to AGW the rain would have been snow and they would not have had any problem. Can you suggest a situation where this flooding would have occured without AGW? It would be extremely unlikey.
All weather is affected by AGW. Whenever there is record damage from weather it is always worse because of AGW. People need to be reminded every time. Most people in the USA do not really remember when Pakistan or Bangladesh is flooded. They notice California a lot more.
-
joe - at 08:16 AM on 21 February 2017Correcting Warren Meyer on Forbes
Rob - thanks will gladly clarify. The statement is made to the effect that Warren made up the second part of the theory catastrophic warming based on positive feedbacks. (ie he pulled it out of his backside and/or his imagination) .
I was only pointing out the theory has been put forth by many from the climate science community, including this site. Granted, there has been some retreat from this position.
(my second part of my comment was pointing out that i originally posted to the same/similar comment to a different blog post in error)
-
Rob Honeycutt at 07:59 AM on 21 February 2017Correcting Warren Meyer on Forbes
joe... Your comment is fairly nondescript. Can you clarify your point or be a little more specific?
-
joe - at 07:27 AM on 21 February 2017Correcting Warren Meyer on Forbes
Warren like most skeptics got his idea from one of these posts (this response was previously posted on different topic -)
https://www.skepticalscience.com/understanding-climate-feedbacks.html
https://www.skepticalscience.com/clouds-negative-feedback.htm
https://www.skepticalscience.com/sensitivity-training.html
https://www.skepticalscience.com/Anderson.html -
jipspagoda at 06:54 AM on 21 February 2017Expect to see more emergencies like Oroville Dam in a hotter world
The emergency spillway had to be used because the main spillway failed and then had to be put back into service because of the imminent catastrophic failure of the emergency spillway. It is likely that if the main spillway had not been damaged the level of the lake could have been lowered without using the emergency spillway and therefore evacuations would not have been required. Is this a road we really want to go down where everything is attributed to CAGW?
-
Jim Hunt at 23:28 PM on 20 February 2017This is why conservative media outlets like the Daily Mail are 'unreliable'
This story is set to run and run! The 3rd instalment of David Rose's anti NOAA fantasy fiction saga was published in Sunday's MoS:
"Climategate 2 – Episode 3 of David Rose’s Epic Saga"
A couple of UK Met Office scientists have already identified some gaping holes in Mr. Rose's latest set of "Alternative Facts" -
Rob Honeycutt at 03:20 AM on 20 February 20172nd law of thermodynamics contradicts greenhouse theory
MA Rodgers... I suppose that would be a function of how you referred to it. You can make it a simile, metaphor or an analogy. I think TM was attempting to dismiss it on a more literal basis and that, I believe, was deliberately missing the point.
-
Tom Curtis at 22:27 PM on 19 February 20172nd law of thermodynamics contradicts greenhouse theory
MA Rodger @1489, the energy balance diagram only shows energy movement between realms - ie, from the surface to the atmosphere, or from the atmosphere to the surface. It does not show energy transfer within the atmosphere itself. For that reason, the figure is not a good guide for estimated what Global Mean Surface Temperature (GMST) would be like in the absence of convection.
A better guide is Fig 4 from Manabe and Strickler (1964):
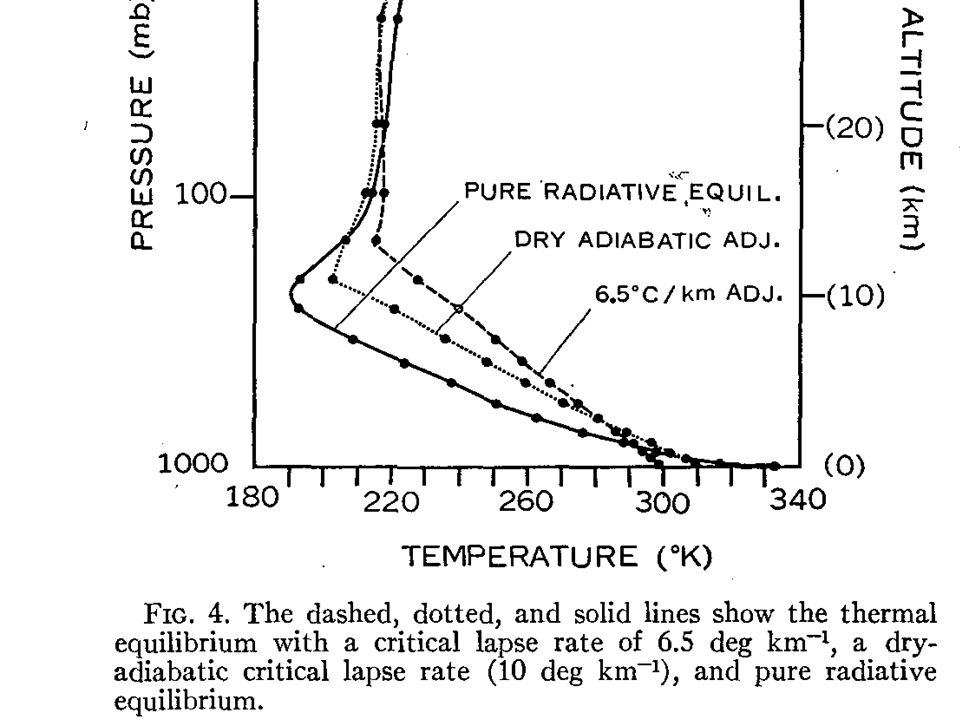
As you can see, from their model, an absence of latent heat transfer (ie, dry-adiabatic lapse rate) would lift GMST by about 10oC, while the complete absence of convection would lift it by about 45oC relative to current conditions. As the greenhouse effect on Earth raises GMST by over 33oC, the presence of convection cools the Earth by over 50% of the temperature increase that would occur from a greenhouse effect without convection.
Eliminating latent heat transfer within the atmosphere by the condensation of water would eliminate just under 25% of the greenhouse effect coupled with convection. That is an esoteric figure, however, given that 75% of the greenhouse effect is from water vapour and clouds. Consequently the combined effect (greenhouse and lapse rate) of water vapour in the atmosphere is to warm the Earth; although at a lower GMST it might be to cool it given the reduced greenhouse effect but near constant cloud albedo effect.
-
MA Rodger at 19:57 PM on 19 February 20172nd law of thermodynamics contradicts greenhouse theory
Rob Honeycutt @1485,
You say the descrption "blanket" is but a metaphor. I would disagree. The convection within the atmosphere is very very slow. How else could it be? Convection contributes directly only 4% of the surface cooling (as conveniently illustrated @1488 above). And that is because the circulation of the atmosphere is very slow. Outside cyclones it takes something like two weeks for a parcel of air to move from surface to tropopause and back. The atmosphere is not static but neither is a greenhouse hermetically sealed. And blankets are far from air-tight. Just like with the planet surface and the GH effect, a blanket's main mode of operation is not preventing cooling convection but in trapping radiant heat loss. So I would suggest that both 'greenhouse' and 'blanket' are analogies and not metaphors.
-
Rob Honeycutt at 16:18 PM on 19 February 2017Elevator Pitches - Chapter 01 - Ancient Sunlight
william... That doesn't make for a very good elevator pitch, though. ;-)
-
william5331 at 16:12 PM on 19 February 2017Elevator Pitches - Chapter 01 - Ancient Sunlight
No, the ancient carbon is not fused with carbon. Dead organic matter to a first approximation is CH2. It already contains the Hydrogen . The longer a carbon chain, the closer the material gets to this formula. Methane is CH4 so when it is driven off, it enriches the remains in Carbon. The point is that the Hydrogen is in the substance and with pyrolysis, the organic material is fractionated into various organic materials from methane to waxes and beyond. With some forms of buried organic material, coal is left which to a first approximation is C.
-
Rob Honeycutt at 15:58 PM on 19 February 2017Elevator Pitches - Chapter 01 - Ancient Sunlight
Wol... Yup. Not sure how that slipped through. That should have been the 18th century. Thank you. Correction made.
-
Wol at 14:48 PM on 19 February 2017Elevator Pitches - Chapter 01 - Ancient Sunlight
>>.....with the dawn of the Industrial Revolution in the 16th century when humans became aware,,,,,,<<
A bit premature, I think! Debatable on exact dates, but somewhere around 1750 - 1800 is more like it, not the 1500s.
-
Tom Curtis at 13:25 PM on 19 February 20172nd law of thermodynamics contradicts greenhouse theory
Further to tm @ 1482
"It should read…. "Heat CANNOT flow spontaneously from a material at lower temperature to a material at higher temperature." The Laws of Thermodynamics are LAWS not theory."
The term "heat" is used ambiguously. Some people use it to mean the thermal energy. Used with that meaning, it is unambiguously the case that thermal energy (in the form of IR radiation) can flow from a colder body to a warmer body, although more must flow in the reverse direction.
The other (possibly more scientifically accurate) meaning is "net thermal energy flow", under which meaning it is unambigously the case that "net thermal energy flow" must be from the warmer body to the colder body (something that can be deduced from the preceding paragraph).
Needless to say, the sentence you find offensive uses the first, and more common in popular usage, meaning.
Under either definition, the 2nd Law of thermodynamics is no bar to the Greenhouse Effect which predicts that net energy flow will be from the Sun to the surface, and then surface outwards. This can be clearly seen in the standard model used to teach the mathematics of the Greenhouse effect:

You will notice that the downward IR radiation at each level is less than the upward IR radiation from the level below, so that the net energy flow is upward. You will also notice that, as the model shows an equilibrium condition, the net IR energy flow between each level is an upward flow equal to the downwar flow from solar radiation. However, to maintain this condition (which conforms with all energy conservation laws), the ground level upward flux must be (in this example), four times the incoming flux from the solar radiation, implying a very strong greenhouse warming. It is only able to do this in compliance with the laws of thermodynamics because of the downward IR flux from the layer above.
Note: this is just a toy model used to illustrate imortant concepts, and introduce a very basic level of the maths involved. It is in no way meant to represent a real situation. In real situations, atmospheres do not conveniently divide themselves into layers like that, and convection is a crucial element. However, in real life the Earth's surface is warmer than can be accounted for by solar radiation and the the Earth's albedo alone, and the net energy flow upwards from all sources matches the downward energy flow from the incoming solar radiation at all levels (although not all levels are shown below):
That is, there is a greenhouse effect, but it is in complete confirmation with the laws of thermodynamics (which is no surprise given that it was predicted by some of the key figures in determining those laws.)
-
Tom Curtis at 12:58 PM on 19 February 20172nd law of thermodynamics contradicts greenhouse theory
tm @ 1482:
"The surface of the moon is +200F. Why, because there's not convection to draw the heat away."
200 Fahrenheit is approximately 366.5 Kelvin. To put your claim into context, the most thorough scientific examination of the surface temperature of the Moon says:
"The mean temperature at the equator is 215.5 K with an average maximum of 392.3 K and average minimum of 94.3 K (Fig. 19), representing an average change in temperature of ∼300 K. Average maximum and minimum temperatures in the polar regions (poleward of 85°) are 202 K and 50 K respectively; with a mean average temperature 104 K. Mean maximum temperatures in the south polar region are ∼11 K warmer than the north polar region, however the average minimum temperatures are the same at both poles."
In other words, your estimate of the Moon's temperature over estimates the mean equatorial temperature by 155 K (279oF). It overestimates the mean lunar surface temperature by much more.
You will also note that the lunar mean equatorial temperature is about 72 K less than the Earth's Global Mean Surface Temperature. As the equator of the Moon has the warmest mean temperature of any latitude, it follows that the Global Mean Surface Temperature of the Moon is much more than 72 K less than the Earth's. That is despite the fact that the Moon's albedo of 0.136 is less than half of that of the Earth's. It follows, even by your reasoning, that the Earth's atmosphere heats it relative to what it would be as an airless body.
As it happens, the major part of that warming is due to the thermal inertia of the atmosphere, and the oceans (in particular), along with the poleward heat transport by both, results in much more equal temperatures. However, the Earth's Global Mean Surface Temperature is about 33 K warmer than would be possible with its albedo, even if its surface were a uniform temperature. That means the combined effect of the atmosphere (radiative and convective energy transfer) warms the Earth's surface. As it happens, it has been shown that the radiative effect warms it, while convection cools the surface relative to what it would be with the radiative effect (ie, the greenhouse effect) alone.
-
michael sweet at 11:04 AM on 19 February 20172nd law of thermodynamics contradicts greenhouse theory
The Master:
Interesting choice of names.
Answering your points in order, your words in italics:
"All energy the Earth receives from the sun is returned to space." Some energy is absorbed by the surface and not returned to space for a period of time. That can range from a day or two up to centuries. A great deal of ice has melted from Greenland and the Antarctic the past few years. The heat to melt that ice came from the sun. It will not be returned for centuries (or more likely thousands of years) when the ice freezes again. On average over a very loong period of time all the energy is re-emitted but for shorter times (like the life of a human) some is absorbed and raises the temperature of the Earth. At other times more energy is emitted than absorbed as the Earth goes into a glacial period.
The surface of the moon is .+200C during the day but it is -200C at night The average temperature is not 200F as you claim. The temperature of the moon is as predicted by scientists. The colder average temperature of the Moon shows that the Earth is heated by greenhouse gases. This has been known by scientists since 1850.
" Kirchhoff's law of thermal radiation clearly states that a body’s ability to absorb heat energy is equal to its ability to emit that heat ." At 5 kilometers above the surface the temperature is about 30C less than at the surface. If the surface emits IR radiation proportional to its temperature some of that energy will be absorbed by CO2 at 5 km. Since the CO2 is colder than the surface it cannot radiate the energy outward as fast as it absorbs it, even though it follows Kirchhoff's law. You need to pay more attention to the temperature of the emitting and absorbing surfaces. Mistakes like this make it appear that you have not thought through the physics enough yet.
"If, instead of a blanket, we set the environment to a saturated C02 level of 100%, the heat loss would be the same as if it was at zero." Many videos on You Tube show that bottles filled with CO2 heat up faster than bottles filled with air. The heat loss is lower when the atmosphere is CO2.
You have me with an example of heat flowing from a cold area to a warmer area, but that statement is not used in the argument so it is moot.
In general it is easier to discuss your misunderstandings of the scientific arguments if you limit your arguments to one problem at a time. Once that issue is resolved we can move on to the next misunderstanding. When there is a long list like yours the replies become difficult to read.
-
Rob Honeycutt at 11:03 AM on 19 February 20172nd law of thermodynamics contradicts greenhouse theory
the master... "A blanket is NOT the same as a trace gas like C02 (sic)."
"A blanket" is a metaphor. No metaphor is intended to be exactly like anything, otherwise it wouldn't be a metaphor. As a metaphor, a blanket is a good way to explain how greenhouse gases work.
[Again with the all caps "not."]
-
Tom Dayton at 11:02 AM on 19 February 2017It's cosmic rays
December 2016 paper in Science: "Nearly all nucleation involves either ammonia or biogenic organic compounds. Furthermore, in the present-day atmosphere, cosmic ray intensity cannot meaningfully affect climate via nucleation."
-
Rob Honeycutt at 11:01 AM on 19 February 20172nd law of thermodynamics contradicts greenhouse theory
the master... "C02 (sic) does NOT 'Trap' heat." [Mods should probably warn about all caps.]
CO2 absorbs and reradiates IR, thus causing more heat to remain in the climate system. That's what people mean by this phrase.
-
Rob Honeycutt at 10:56 AM on 19 February 20172nd law of thermodynamics contradicts greenhouse theory
the master... "The surface of the moon is +200F."
Sorry, but the average temperature of the moon isn't 200°F. That's rather an absurd cherry pick.
-
JonathanA at 07:14 AM on 19 February 2017Elevator Pitches - Chapter 01 - Ancient Sunlight
Yes, as you say, its from the TTT, but version 4 of the RSS , which explains why its higher than I'd read elsewhere. This recent Tamino link clarifies the situation.
https://tamino.wordpress.com/2016/11/27/which-satellite-data/
I guess I was hoping for those kind of links in the text so there is a trail back, but it makes much more sense to do that for an e-version than hard copy.
Moderator Response:[PS] Activated link. Please learn to do this yourself with the link tool in the comment editor
-
the master at 06:59 AM on 19 February 20172nd law of thermodynamics contradicts greenhouse theory
I've italicised your words. My rebuttal follows. Please explain.
They radiate most of the heat that is received from the sun, so the average temperature of the Earth stays more or less constant.
All energy the Earth receives from the sun is returned to space. That’s what the Law of conservation of Energy and the Climate Energy Balance states. The atmosphere cools the Earth. It does not add heat. The surface of the moon is +200F. Why, because there's not convection to draw the heat away.
Greenhouse gases trap some of the escaping heat
C02 does NOT “Trap” heat. Kirchhoff's law of thermal radiation clearly states that a body’s ability to absorb heat energy is equal to its ability to emit that heat energy.
So the greenhouse gases make the Earth warmer - like a blanket conserving body heat - and voila, you have global warming. When you wrap yourself in a blanket, the loss of heat is reduced, some is retained at the surface of your body, and you warm up. You get warmer because the heat that your body is generating cannot escape as fast as before.
Heat moves via convection, conduction or radiation. Gas-convection, Solid-conduction, Vacuum-radiation.
A blanket is NOT the same as a trace gas like C02. One is a solid and one is a gas. A solid object like a blanket will impose on the rate of heat loss through the loss of convection. The blanket is NOT adding heat to one’s body. If, instead of a blanket, we set the environment to a saturated C02 level of 100%, the heat loss would be the same as if it was at zero. Your explanation using a blanket is ridiculous.
"Heat generally cannot flow spontaneously from a material at lower temperature to a material at higher temperature."
It should read…. "Heat CANNOT flow spontaneously from a material at lower temperature to a material at higher temperature." The Laws of Thermodynamics are LAWS not theory.
Moderator Response:[JH] Please keep it civil.
[PS] You cannot refute an argument when you dont understand how it works. Short of opening a textbook on radiative physics, I would strongly suggest that you look over Science of Doom here and here which takes in stages and spends whole articles on your objections. Hopefully you will admit that if an experiment produces a different result from your perception of a theory, then your perception is wrong.
-
JonathanA at 05:36 AM on 19 February 2017Elevator Pitches - Chapter 01 - Ancient Sunlight
Thanks Rob, yes I'm a bit old fashioned (well old I guess) and like the feel of print. I'll check out an electronic version, makes complete sense to major on that. Anyway great concept.
-
Rob Honeycutt at 03:24 AM on 19 February 2017Elevator Pitches - Chapter 01 - Ancient Sunlight
And Jonathan... Are you reading from a print version or an e-version? Some of the early print versions had a bunch of typos that have been corrected, and the pages work out differently based on which version you look at.
Since the printing is being done on-demand and the other versions are electronic, it's easy to make quick updates.
-
Rob Honeycutt at 02:59 AM on 19 February 2017Elevator Pitches - Chapter 01 - Ancient Sunlight
Joel... Links are fixed now.
Jonathan... The RSS tropospheric temp rise is from the TTT data.
-
Joel_Huberman at 01:18 AM on 19 February 2017Elevator Pitches - Chapter 01 - Ancient Sunlight
This elevator speech is excellent. I'd like to go further, but I can't, because the links to the print, iBooks and Kindle versions don't work.
-
Jim Hunt at 22:40 PM on 18 February 2017This is why conservative media outlets like the Daily Mail are 'unreliable'
John @9 - "Fake News" => "Post-Truth" => "Alternative Facts"!
Abel discovered that many other motives were involved, among them a sense of the decline of Germany, a desire to rediscover past greatness, a fear of social disorder and the longing for a strong leader.
We would argue that the same is true of those who supported Trump.
The climate change denial playbook has indeed recently been repurposed. (IMHO!)
-
factotum at 16:47 PM on 18 February 2017Is anything wrong with Forbes Climate Reporting?
to uncletimrob:
see https://en.wikipedia.org/wiki/Dunning%E2%80%93Kruger_effect
The Dunning–Kruger effect is a cognitive bias in which low-ability individuals suffer from illusory superiority, mistakenly assessing their ability as much higher than it really is. Dunning and Kruger attributed this bias to a metacognitive incapacity, on the part of those with low ability, to recognize their ineptitude and evaluate their competence accurately. Their research also suggests corollaries: high-ability individuals may underestimate their relative competence and may erroneously assume that tasks which are easy for them are also easy for others.[1]
Perhaps FLICC should be changed to FLICCDK :-) otherwise known as flick-dick :-)
Moderator Response:[JH] No profanity or inflammatory tone. Again, constructive discussion is difficult when overheated rhetoric or profanity is flying around.
-
Tanj at 14:52 PM on 18 February 2017Whistleblower: ‘I knew people would misuse this.’ They did - to attack climate science
The E&E article is terrible. Meandering, random quotes from the supposed interview. Just like climate data, the actual interview should be published not just this mashup. It is not helpful at all.
-
JonathanA at 11:24 AM on 18 February 2017Elevator Pitches - Chapter 01 - Ancient Sunlight
Thanks Rob, I've just read your book which is an excellent and very readable primer. I'm a follower of scepticalscience, realclimate, thinkprogress and other sources but you still managed to tell me some stuff I didn't know. You give a helpful bibliography, but I would ideally like to see source references for each chapter, and more specific refs for your Quick Facts. One of these, the rise in tropospheric temperature, didn't look quite right to me. RSS is the source, but their website has 0.13deg C/decade for the Lower Troposphere, not 0.18, unless I've missed something. I expect someone has already noticed typos on p10 (medal/metal), p19 top (It's), p78 (1 through/thought 5). 'Since' in 'Since methane' on p98 is redundant. I look forward to further chapters!
-
Eclectic at 10:07 AM on 18 February 2017CO2 lags temperature
Adri Norse Fire @540
You mention a New little ice age, coming in the next few years and decades. That is the assertion by Mr Peter Ferrara in Forbes Magazine in 2013 (the link supplied by you).
Since 2013, the world has had its three hottest years in recorded history ( 2014 / 2015 / 2016 ). And there is absolutely no sign that Mr Ferrara's assertion could become true. His assertion is total Unsinn (as the Germans say). Total nonsense.
Adri, you should not be surprised to find Unsinn coming from Mr Ferrara. He is a lawyer and a professional propagandist and an Amerikaner . . . a truly toxic combination!! Mr Ferrara is paid to give you Dreck instead of Wahrheit / Sanningen / Truth. And it is the same with JoanneNova.
Adri, please attempt to be scientific with your thinking. When you wish to assess the health of a forest, then you should look at the health of all the trees - not simply look at the healthiest 4 trees which you can find to please you.
-
scaddenp at 10:00 AM on 18 February 2017CO2 lags temperature
I find it worrying that you would uncritically accept a comment from a TV documentary and assume that it invalidates the science. Misinformation organisations make documentaries to confuse eg "Great global warming swindle", and "climate hustle" which misrepresent science for the gulliable. As has been shown above by Tom and MA Rogers, the sources you have been trusting are not reliable and in fact are doctoring the truth. And you and many others have fallen for it. It is extremely hard to have a discussion when misinformation is uncritically accepted and hard-core, peer-reviewed, widely accepted science papers are treated as unreliable. As Rob says, it implies a strong bias against science. You must have searched some very dubious sources to find these and yet trust them rather than the IPCC expert review of published science.
When shown that your evidence is invalid, do you change your mind or go frantically searching for confirmation of your bias from yet more dubious sources?
Is there actually any point in us discussing data with you? In your own mind, what data would cause you to change your position?
Also, just make sure that you do understand the extent of agriculture in Greenland.
-
Tom Curtis at 09:07 AM on 18 February 2017CO2 lags temperature
Adri Norse Fire @541, the graph (not map) that I showed as the third image @536 is the simple mean of:
The following data sources were used in constructing the main plot:
- (dark blue) Sediment core ODP 658, interpreted sea surface temperature, Eastern Tropical Atlantic: M. Zhao, N. A. S. Beveridge, N. J. Shackleton, M. Sarnthein, and G. Eglinton. "Molecular stratigraphy of cores off northwest Africa: Sea surface temperature history over the last 80 ka". Paleoceanography 10 (3): 661-675. doi:10.1029/94PA03354
- (blue) Vostok ice core, interpreted paleotemperature, Central Antarctica: Petit J. R., Jouzel J., Raynaud D., Barkov N. I., Barnola J. M., Basile I., Bender M., Chappellaz J., Davis J., Delaygue G., Delmotte M., Kotlyakov V. M., Legrand M., Lipenkov V., Lorius C., Pépin L., Ritz C., Saltzman E., Stievenard M.. "Climate and Atmospheric History of the Past 420,000 years from the Vostok Ice Core, Antarctica". Nature 399: 429-436. doi:10.1038/20859
- (light blue) GISP2 ice core, interpreted paleotemperature, Greenland: Alley, R. B.. Quaternary Science Reviews. doi:10.1016/S0277-3791(99)00062-1
- (green) Kilimanjaro ice core, δ18O, Eastern Central Africa: Thompson, L. G., E. Mosley-Thompson, M. E. Davis, K. A. Henderson, H. H. Brecher, V. S. Zagorodnov, T. A. Mashiotta, P.-N. Lin, V. N. Mikhalenko, D. R. Hardy, and J. Beer. "Kilimanjaro Ice Core Records: Evidence of Holocene Climate Change in Tropical Africa". Science 298 (5593): 589-593. doi:10.1126/science.1073198
- (yellow) Sediment core PL07-39PC, interpreted sea surface temperature, North Atlantic: Lea, D. W., D. K. Pak, L. C. Peterson, and K. A. Hughen (2003). "Synchroneity of tropical and high-latitude Atlantic temperatures over the last glacial termination". Science 301 (5638): 1361-1364. doi:10.1126/science.1088470
- (orange) Pollen distributions, interpreted temperature, Europe: B. A. S. Davis, S. Brewer, A. C. Stevenson, J. Guiot (2003). Quaternary Science Reviews 22: 1701-1716. doi:10.1016/S0277-3791(03)00173-2
- (red) EPICA ice core, δDeuterium, Central Antarctica: EPICA community members (2004). "Eight glacial cycles from an Antarctic ice core". Nature 429 (6992): 623-628. doi:10.1038/nature02599
- (dark red) Composite sediment cores, interpreted sea surface temperature, Western Tropical Pacific: L. D. Stott, K. G. Cannariato, R. Thunell, G. H. Haug, A. Koutavas, and S. Lund (2004). "Decline of surface temperature and salinity in the western tropical Pacific Ocean in the Holocene epoch". Nature 431: 56-59. doi:10.1038/nature02903
It shows the individual proxies in the background.
The inset shows the following temperature reconstructions over the last 2000 years:
- (orange 200-1995): P. D. Jones and M. E. Mann (2004). "Climate Over Past Millennia". Reviews of Geophysics 42. doi:10.1029/2003RG000143
- (red-orange 1500-1980): S. Huang (2004). "Merging Information from Different Resources for New Insights into Climate Change in the Past and Future". Geophys. Res Lett. 31: L13205. doi:10.1029/2004GL019781
- (red 1-1979): A. Moberg, D. M. Sonechkin, K. Holmgren, N. M. Datsenko and W. Karlén (2005). "Highly variable Northern Hemisphere temperatures reconstructed from low- and high-resolution proxy data". Nature 443: 613-617. doi:10.1038/nature03265
- (thin black line 1856-2004): Instrumental global annual data set TaveGL2v [2]: P. D. Jones and A. Moberg (2003). "Hemispheric and large-scale surface air temperature variations: An extensive revision and an update to 2001". Journal of Climate 16: 206-223.
Over the last 2000 years, the reconstructions are to be preferred, as each uses more than 8 proxies, but there is little difference between the mean of those reconstructions and the mean of the 8 proxies over that period.
Further details about the graph are here.
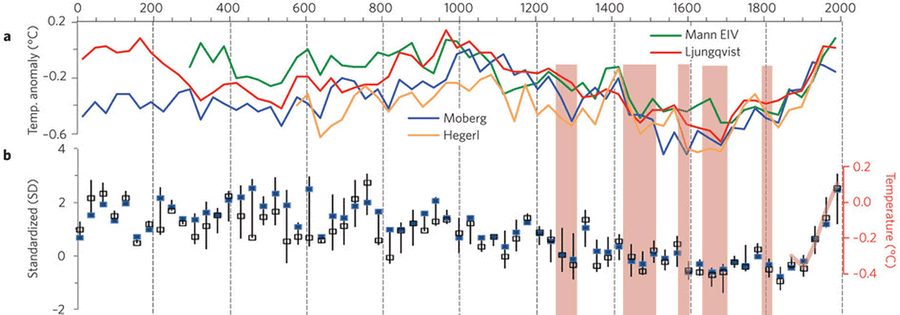
Almost any modern multi-proxy temperature reconstruction is preferable to taking the value of a single site, or just a few. The one exception is Loehle and McCulloch (which you use). That is because they use a heavilly biased sample of proxies but then take a simple mean of those proxies. As I explain elsewhere, this is equivalent to assuming that "...that 66.7% of the Earths Surface is in the NH extratropics, 22.2% in the tropics, and just 11.1% in the SH extratropics". Probably the best, and certainly the one using the most proxies, is that from the PAGES2000 consortium, shown here compared to four recent reconstructions (top of panel):
-
MA Rodger at 07:03 AM on 18 February 2017CO2 lags temperature
Adri Norse Fire @541,
The graphics you present do not support your assertions of a toastie warm MWP. In truth, they are a bit of a joke.
The first graphic Change of T & Change of CO2 Holocene Epoch is not supported by the document it says it sources for temperature data - Broecker (2001). While this paper itself is old and in many respects speculative, it does set its position out that "Holocene temperature fluctuations ... were probably less than 1°C." So for this graphic you present to show fluctuations of 8°C puts it quickly in the bin.
The second graphic plots a tiny part of one of two a Greenland borehole temperature reconstruction from Dahl-Jensen (1998) but the graphic for some reason cites a secondary source (Bond et al 2001). The other trace on this graphic is called Yang-Delta T but what this is plotting is not entirely clear. I would assume it is the 'weighted' China trace from figure 3 in Yang et al (2002) but there appears to have been some fiddling with this data in the most recent period plotted.
The third graphic is simply figure 2 from Loehle & McCulloch (2008) which presents a global temperature reconstruction to 1935. Note the peak of the MWP sits just 0.5°C above the 1935 level. Thinks - I wonder what has happened to global temperatures since 1935?
The final graphic is another stab at Holocene temperature & CO2 levels with various temperature reconstructions presented (including the borehole data used in the first graphic above) citing Bond et al (2001) again. It certainly is plotting out the bottom two traces from fig 5A in the paper but using the wrong x-axis. Of the other two traces presented, one does seem to be using the x-axis properly but where it is sourced is not at all evident. And as a parting shot at this rubbish, note that the CO2 trace in this graphic is saying CO2 topped 300ppm in about 1780AD, assuming the grapher managed to plot it against the x-axis correctly. If the x-axis is wrong, the y-axis is also up the spout as well.
-
william5331 at 07:02 AM on 18 February 2017Scientists study ocean absorption of human carbon pollution
This might be the explanation of why, despite an apparent decrease in carbon output into the atmospere, Carbon dioxide took an unusual jump in 2016. The first Man Loa results are finally out for January and the jump from the previous January was 3.61. It will be interesting to follow the rest of this year. For 2015 - 2016, in order of months the results were:
2.54, 3.76, 4.14, 3.74, 4.01,3.08,3.32,3.40, 3.28, 3.37 and 2.63 for an average of 3.38
If a high result such as the 4's was an artifact of some sort (lab error, for instance) one would expect a particularly low result for the same month this year. Another high result would indicate something fundamental happening such as a sink shutting down.
-
Rob Honeycutt at 02:52 AM on 18 February 2017CO2 lags temperature
Adri... From the warning snip portion of your comment at 540 I think we can gather that "dismissiveness" (as I framed it) is based in distrust of government. You can correct me if I'm wrong.
I can promise you, you're interpretting the science very wrong. Everyone here at Skeptical Science has been through this a 100 times before. What we find is, as we explain the science, people like you are generally driven further into denial. And as you get more and more frustrated with not getting the answers you prefer, you end up getting angry and frustrated, and we ultimately have to delete your access to comment.
We can start going through the science if you like, but if you want to avoid this predictable outcome, you would have to bring an open mind to the conversation.
I know it's probably very hard for you to see the difference, but many of the sources you're using are not about the science. Biocab.com, Jonova.com... These are websites that do not present the actual scientific research. They're designed to confuse. And they do a very good job of that.
-
Adri Norse Fire at 23:58 PM on 17 February 2017CO2 lags temperature
Tom Curtis
I'm a bit confused with the image you've shown me, the image is composed of a large map and a small one so what are the real data?
As far as I have been able to investigate the large image plots ice core data, covering the past 11,700 years, where does the small figure come from?
Because the main one points to periods of the Holocene with higher temperature than now. So?
-
Adri Norse Fire at 23:41 PM on 17 February 2017CO2 lags temperature
MA Rodger
What I meant was that I am using scientific data in the sense that my arguments are exclusively in scientific terms, regardless of whether my claims are true or not.Rob Honeycutt/scaddenp
Why do you say that I am not using scientific data? Do not scientific documentaries and scientific journals make scientific knowledge public? Is that knowledge invalid? So everything the public knows is a lie ... including global warming, right?
When I said that the current temperature was below about 1.5 ° I relied on a documentary where a gentleman, I think he was Norwegian who was in the Antarctic and claimed that the ice cores of his own research proved that the temperature was 1.5 ° higher to the present during the Medieval Warm Period. But also, it is known that historically the peoples of contemporaries of that time recorded that in Greenland agriculture was possible, among other things, etc. I think it is out of place to think that everything is part of a subtle conspiracy, of wich I am part, of course.
Tom Curtis
Thank you.
Okay, this is the kind of thing I said that misinterpretations were likely to occur. I have not said that the current increase in CO2 comes from volcanoes. And you're right, I thought it was a question I asked John Hartz, it's my fault. Sorry. Again you are right, I have no problem accepting that the recent increase in CO2 is due to human industrial activity, although there are other scientists who deny that conclusion with their own data, since from the beginning I said CO2 does not cause the current global warming by greenhouse effect or by feedback. I just do not see it likely. Sources I read some time ago claimed that water vapor is the main greenhouse gas and that it is responsible for two-thirds of the natural greenhouse effect. As you say very well it is a stable process, but the Earth makes all kinds of movements and we do not really know how much impact the orbital changes have on the greenhouse effect and Milankovich attributed the intervals of glacial periods and warm periods to the orbital changes. Which is no small thing in terms of climate.
Sorry for putting that graphic, I knew it was just a very nice graphic. I have taken note.
Well, as I said above the Antarctic data show also, that the temperature was higher than the current approximately 1.5 degrees during the Medieval Warm Period.
"All of this may be a side issue, but I am unsure as to what point you are trying to make with two charts of CO2 concentration over the last 800,000 years, or the chart of CO2 concentration over the Holocene." Why the current Temperature is 1.5 ° lower than the medieval warm period? " It is not. See chart above.'' Yes it was, why do you think it was called the Medieval Warm Period? Let's look at some recent research:
Working with a 2.5-foot-long core of peat in Penido Vello (Galicia, Spain) Martinez-Cortizas et al. (1999), a Mercury deposit record was extracted that extended until 4000 years ago. The work revealed that warm periods were characterized by a low accumulation of mercury. They also standardized the variables extracted and related them to the temperatures of the last 30 years. The work revealed that the medieval warm period in the northwest of Spain was 1.5 ° C warmer than the current one and that the average temperature of the warm Roman period was in no less than 2 ° C. Even a period of 80 years in the Middle Ages with average temperatures 3 ° higher than the current ones.
Desprat et al. (2003) studied the climatic variability of the last three millennia through the sediments of the Vigo estuary, clearly recognizing three warm periods and three cold periods, without seeming to be a relation between the variability and the increase of carbon dioxide. The authors concluded that the solar radiative balance and the ocean circulation seem to be the main mechanisms that force these cyclical variations in the Peninsula.
Pla and Catalan (2005) analyzing sediments of chrysophytes in more than 100 lakes of the Pyrenees reproduced a record of winter and spring temperatures during the Holocene. Warm and cold oscillations were recognized for these oscillations over the past few millennia. From the Medieval period it is deduced that the temperatures were then 0.25 ° higher than the current ones.
Here a chart: http://www.biocab.org/Holocene-Delta_T_and_Delta_CO2.jpg And as I liked the dissection you did to the other here is more: http://www.biocab.org/Boreholes_Reconstruction.jpg http://3.bp.blogspot.com/_H07QGNhZQzA/S_gGpyDlDQI/AAAAAAAAAHw/ADQvLwN-9U0/s1600/temperaturas+%C3%BAltimos+2000+a%C3%B1os.jpg http://www.biocab.org/Holocene_Delta_T_and_Delta_CO2_Full.jpg
''Of course, in your version it is labelled Northern Hemisphere temperatures, not global temperatures. The point still stands, however. A Greenland ice core no more shows Northern Hemisphere temperatures by itself than does a thermometer in Moscow show temperatures in Tucson, Arizona.'' The question then remains valid, but to avoid falling into the little trick of geography I will rephrase: Why the current temperature of Spain is lower (0,25º - 1,5º) than the Spain's Medieval Warm Period, if the current concentrations of atmospheric CO2 in Spain is higher without any doubt?
(Can we extend the geographical scope to the Mediterranean and even Europe? I do not know; http://science.sciencemag.org/content/291/5508/1497 , http://science.sciencemag.org/content/342/6158/617)
--And someone asked me why I'm so skeptical or something--
Well, it is not very difficult to be a skeptic of anything since we have been able to see everything from the millionaire Red Cross scam in Haiti after the earthquake to hear the Greenpeace co-founder say that this organization has become a corrupt gang and then you see scandals with emails and what some IPCC scientists say, and so on. When I saw the Al Gore's documentary I believed it and when I saw the documentary of The Great Scam of Climate Change, I also believed it. So we must be very careful not to be deceived by the official tone, as some have pointed out: http://joannenova.com.au/2010/10/is-the-western-climate-establishment-corrupt-part-4-past-temperatures/
MA Rodger
It's funny that you mention sidelong to the ''Little Ice Age revivalists'' because according to NASA members, this very century we can face a solar minimum such as the Maunder Minimum or the Dalton Minimum and presumably a new Little Ice Age. Here's a link: http://www.forbes.com/sites/peterferrara/2013/05/26/to-the-horror-of-global-warming-alarmists-global-cooling-is-here/#5c8c582669bb
Moderator Response:[JH] Sloganeering snipped.
-
MA Rodger at 10:17 AM on 17 February 2017CO2 lags temperature
Tom Curtis @538,
The other point of note is how the graphic has slowly lost almost all the warming of recent decades as each denialist has manipulated the image.
In the 2006 Wehry version (this a different PDF version of the same thing) you display @538 (& we can but presume this is a faithful reproduction of the Schoenwiese (1995) graphic), the trace is four or five pixels broad which is about 100 years of horizontal axis and 0.025ºC vertically. But it does show an edge disappearing into the vertical post-2000 temperature rise which scales to 15.9ºC. By the time it appears in the 2007 Archibald paper, the edge has dropped to 15.75ºC. Then it features in the 2009 Denis Avery version by which tme it has dropped more to 15.6ºC and in the most recent version introduced @532, the 2014 NA Florenza version it has dropped again to 15.55ºC.
Strangely, that feature so loved by the Little Ice Age Revivaists maintains its top edge at 15.5ºC throughout this process of hidden decline.
-
ubrew12 at 06:42 AM on 17 February 2017Is anything wrong with Forbes Climate Reporting?
Loyola: "Some...[climate alarmists] think that rising temperatures and sea levels are alarming regardless of what's causing them to rise. Such voices are in a tiny minority, however." Swap out 'climate alarmists' for 'human beings', and Loyola is still speaking nonsense. You don't think everybody in Florida is going to be alarmed if sea level rises ten feet? Climate alarmists are not alarmed at Climate Change, they are alarmed at the lack of Climate Action. So, along with Loyola's cherry-picking trophy mentioned above, he should be awarded one for misdirection. Imagine Loyola opinionating at the site of a protest at the Oroville Dam in California (which could possibly collapse due to climate change and neglect), and telling the media "Ya know, these protesters wouldn't be out here if this was a natural dam!" Yes, and also if they were abducted by Space aliens...
-
scaddenp at 06:18 AM on 17 February 2017Global warming hiatus claims prebunked in 1980s and 1990s
Further to that, unless you are ready to throw conservation of energy of the window (in which case this isnt the site for you), you cannot increase the ocean heat content (or surface temperature) without changing the energy flow. We have a pretty good handle on these energy flows (and the obvious one is the increasing re-radiation from GHG). Where precisely do you think the energy flow is changing if this is a normal ice age cycle? Where does the directly measured increase in surface radiation disappears to if you think something else is the warming? I would note, that without the GHG, the orbital forcings should have us slowly cooling not warming.
Not sure why you think GHG theory isnt performing..

-
nigelj at 06:11 AM on 17 February 2017Is anything wrong with Forbes Climate Reporting?
Alpinist @5, yes you can't really count on Forbes for balance or accuracy on anything.
I find the Economist pretty accurate, reliable, and balanced on both economics and climate issues. Thats not to say I subscribe to all their views of course. They were a bit sloppy on the climate sensitivity issue.
Prev 410 411 412 413 414 415 416 417 418 419 420 421 422 423 424 425 Next


