


 Arguments


Recent Comments
Prev 414 415 416 417 418 419 420 421 422 423 424 425 426 427 428 429 Next
Comments 21051 to 21100:
-
chriskoz at 12:20 PM on 4 February 2017A Message to Trump from Climate Scientists
I think that the caption and the commentary to this video is misleading. None of the scientist in it have "A Messsage to Trump". No one uses T-word, and only Kim Cobb refers to the "incoming administration".
T-man receives disproportionate amount of attention in media (e.g. 80% of world news in my local newspaper), also ~50% weekly news in SkS contains T-word. This is the attention the man, the most narcissistic and the most moronic politician in livin memory if not in history, does not desrve. As psychologists suggests, the best dealings with such a childish narcissist is to simply ignore his ravings, do not provoke more. Note that his current ravings did not include climate science yet (other than his destruction of Obama's climate change webpage & rumours of his desire to destroy climate data from gov computers), we can expect more to come. Best strategy is to ignore and do not provoke, because any attempt to strike a civil conversation with a 12y old-like narcissist on a dificult and thoughtful topic will be futile. Common understanding between such a narcissist and a person at PhD level is just impossible. That's why a message such in this video shoul be directed to "current administration" (or othe politicians in denial of CS) insted. Also not easy talk, but at least the basic dialog is more realistic as those politicians do not live in "alternative reality". Their denial is limitted to climate science (and othe inconvenient science) only.
-
nigelj at 09:07 AM on 4 February 2017A Message to Trump from Climate Scientists
What an excellent, insightful series of comments in the video.
I would say to Trump think of future generations. Most people balance their own current needs, and think of the future, and the needs of others as well. Don't let it become too one sided. Thinking widely brings benefits back to individuals anyway.
I would also say please appreciate that geoengineering solutions to climate change carry massive risk. I suspect Trump is taking his hardline position on climate change publicly, while secretly believing (or half believing) we are altering the climate, but assuming that geotechnical solutions will rescue humanity. As a business person he understandibly hedges risks and would think like this. But as we know geoengineering solutions are very high risk to the planet and are utterly impractical.
I read a persuasive article in the media that suggested America is currently in the grip of a type of "coup" or hostile takeover as below.
www.nzherald.co.nz/world/news/article.cfm?c_id=2&objectid=11794343
-
nigelj at 06:32 AM on 4 February 2017Global warming hiatus claims prebunked in 1980s and 1990s
Clearly any slowdown in global temperatures of any length, or pause raises the question of solar influences. My understanding is that there are three solar cycles influencing the climate, and that they cannot significantly slow down the projected warming from greenhouse gases. I would be interested if the experts could tell me if I have got this about right as below.
Firstly the suns energy output varies in an 11 year cycle, but not very much and only causes a fraction of a degree of change. Given the short period of the cycle it cannot really slow down longer term warming from greenhouse gases.
Secondly we have a longer solar cycle of about 50 years (from the article on this website called "It's The Sun") but this only changes temperatures by about 1 degree maximum. It was responsible for the Maunder minimum in the 1800's where global temperatures dropped about half a degree. We base knowledge of this cycle partly on historical evidence as well as scientific calculation.
It does appear we are now in a cooling phase of this cycle, but it is calculated to have negligible affect. Given this cycle only has a small affect on temperatures and in the suns energy output, it can't really significantly slow down warming from greenhouse gases and won't save us, and could equally speed it up slightly anyway later this century.
Thirdly we have changes in solar insolation due to regular changes in the earths orbit that can alter temperatures by a degree or two, but this cycle is 100,000 years preiodicity and we are in a stable part of the cycle, and will remain there for about 10 - 20,000 years. (This stuff is mainstream science and not controversial so I won't to provide a link). This cycle is therefore not capable of impacting on warming from greenhouse gases over the next few thousands of years, so won't save us and is irrelevent to the debate.
Fred Singer talked about a long term solar cycle. I can't remember the name, but this cycle has been discredited as it doesn't cause a net change in global temperature.
So in conclusion my understanding is changes in solar energy output from the sun have been extensively researched, and are extremely unlikely to significantly slow down future warming from CO2.
-
John Hartz at 12:14 PM on 3 February 2017Fact Check: Trump's Cabinet Picks on Human-Caused Global Warming
Recommended supplemental reading:
Future of Paris Accord Uncertain as Tillerson Becomes Secretary of State by Benjamin Hulac & Jean Chemnick, E&E News/Scientific American, Feb 2, 2017
-
Fairoakien at 10:18 AM on 3 February 2017Global warming hiatus claims prebunked in 1980s and 1990s
Yes threr is global warming. There are natural causes of GW other than human produced GHGs
Again proponeents of GW are reaching for any any unproven or untestable hypothesizes to support global warming continues unabeatted Obviously theer was pause in GW between 1945 and 196 as there was between 1998 and 2013. But these paises are denied. Now we GW sup[porter are latching onto theories re the ocean currents and cycles w/o any data to support these supposed studies.
They ignore that between 1934 and 1944 the global temp increse 0.45 C.
A much bigger change than we just experienced since 2011.
Why did the global temp incr so much bewteen 1934 & 1944 would be good to know ansd compare to what is happening today.
Obviously the sun influences cvlimate on earth as it did during the LIA, ie the suns rotation slowed . but items ike this are debunked as bad science, while theories of deep welling in the ocean are accepted.
Moderator Response:[PS] Deleted rampant offtopic sloganeering. This appears to be a pattern. Multiple comments policy infringements. In particular, note the requirement for backing your claims with evidence. Things like "science ignores" are patently false as even a cursory reading of IPCC reports would tell you. Furthermore please use the search function to find appropriate topics and dont bother with gish-gallops of long-debunked talking points.
Final Warning
Please note that posting comments here at SkS is a privilege, not a right. This privilege can and will be rescinded if the posting individual continues to treat adherence to the Comments Policy as optional, rather than the mandatory condition of participating in this online forum.
Moderating this site is a tiresome chore, particularly when commentators repeatedly submit offensive, off-topic posts or intentionally misleading comments and graphics or simply make things up. We really appreciate people's cooperation in abiding by the Comments Policy, which is largely responsible for the quality of this site.
Finally, please understand that moderation policies are not open for discussion. If you find yourself incapable of abiding by these common set of rules that everyone else observes, then a change of venues is in the offing.Please take the time to review the policy and ensure future comments are in full compliance with it. Thanks for your understanding and compliance in this matter, as no further warnings shall be given.
-
scaddenp at 09:18 AM on 3 February 2017A punchy climate book from a citizen scientist
"in my experience, Kindle does not handle graphics well".
Well I love my Kindle but the above is something of an understatement. I agree that Kindle app is good though.
-
Tom Curtis at 07:18 AM on 3 February 2017A punchy climate book from a citizen scientist
Rob @2, in my experience, Kindle does not handle graphics well. My kindle was, however, a basic model. There is a colour version that may do better. That said, Amazon has an app for tablets so that you can read kindle books from an tablet. (Mine is Android device, so I am not certain it works on ipad, although I can so no reason why not.) As a side note, you can also read kindle books on a PC, if that is your inclination.
-
nigelj at 07:03 AM on 3 February 2017Global warming hiatus claims prebunked in 1980s and 1990s
Art Vandelay @8, yes the leaked emails were most unfortunate. Rotten luck really. They were so open to manipulation.
I work in technology not science, but I know that the term "tric and hide the decline" were not sinister, and were shorthand for completely legitimate processes as various investigations have found, but they are created a bad impression.
Regarding temperatures my understanding is similar to OPOF that you need 30 years of data to get beyond natural variation. Basically the IPCC only confirmed we were altering the climate when they had a 30 year warming trend.
I also understand that the IPCC says any pause or slowdown less then 15 years is just natural varaition and temporary, over 15 years and we would need to be asking questions. The slowdown a few years back was nearer 6- 10 years so doesn't bother me, and I just fail to see why some people say it wasn't a pause.
My understanding is that all powerful natural variation operates on quite short cycles, up to about 15 years, but there are longer term cycles like the PDO that work on longer cycles, but are unlikely to slow warming significantly as far as I understand.
I would also be worried if there were no pauses or "blips". You would not expect the climate to warm in a precisely straight line from CO2, as there are just obviously natural influences modulating this.
However the pause around the 1950s was quite long, and has not been well explained as yet. It seems to correspond to a slow period in solar activity and aerosols from industry, but as far as I'm aware neither really explain this period according to the article above. Were there ocean processes at work?
-
Rob Honeycutt at 06:09 AM on 3 February 2017A punchy climate book from a citizen scientist
I've never owned a Kindle, and am not a big fan of Amazon, but I'm curious, Ronsch. This is a very graphic intensive book, leaning toward an artistic approach, over just simple line graphics. That works very well on the iPad, would that translate to the Kindle?
-
Ronsch at 06:04 AM on 3 February 2017A punchy climate book from a citizen scientist
He would have a wider audience (me, for example) if it was also distributed as an ebook at Amazon.
-
One Planet Only Forever at 02:47 AM on 3 February 2017Global warming hiatus claims prebunked in 1980s and 1990s
uncletimrob@7,
There is another way of talking about the 30-year trend in surface temperature data.
The monthly surface temeprature values vary significantly even from month to month. This can be seen in the scatter of the monthly value dots on any data presentation. So if there was indeed no significant continuing warming trend any new monthly average temperature should have a significant chance of being cooler than the value 360 months earlier.
Prior to the 1980s that was indeed the case. The rate of CO2 increase and the resulting warming was less than the more recent rate (and things like particulate from lousy burning of fossil fuels dampened the warming). Since the 1980s there are significantly fewer cases where a monthly value is lower than the value 360 months before.
The satellite data also has very few cases where a monthly value is cooler than the value 360 months prior. Of course it is such a short data set that it is difficult to justify any interpretation of the satellite data set as Trumping what is seen in data sets with longer durations of data. But that does not justify delaying actions to reduce the rate of CO2 increase until there is more satellite data.
An additional point about climate variability and the importance of considering 30 year periods of data: When climate design data is developed for the Canadian Buidling Code any data gathering location with less than 30 years of data is considered to be a marginally accurate basis for design requirements. And even at a location with 30 years of data the nearest location with more than 30 years of data is referred to when trying to decide what would be reasonable.
-
RedBaron at 02:33 AM on 3 February 2017Fact Check: Trump's Cabinet Picks on Human-Caused Global Warming
@shoyemore,
I often hoped the same as this and even went on record that this might playout untill I saw Sonny Perdue ended up being the sec ag nominee. If we had a more forward thinking sec of ag then the two working together might have given us a huge advantage. We have enough agricultural land that this pricing of externalities could have brought us either to a net negative carbon or very low indeed. We even have a similar blueprint (though voluntary) here in OK already set up. Alas it may be just a pipe dream.
-
shoyemore at 00:27 AM on 3 February 2017Fact Check: Trump's Cabinet Picks on Human-Caused Global Warming
Secretary of State Rex Tillerson is in an invidious position - he is from an engineering background, and he has sat on top of Exxon Mobil's extensive scientific work on climate change.
Tillerson would have been nobody's ideal choice as Secretary of State, but it will be interesting to see how he handles climate diplomacy. The US has already handed Asian market penetration over to China in a whole range of goods (by ditching TPP), now it may concede global climate leadership to China also. In this video by Peter Sinclair, Dan Kammen reflects on Tillerson's options.
-
Art Vandelay at 23:55 PM on 2 February 2017Global warming hiatus claims prebunked in 1980s and 1990s
Pause for thought.
There was this now infamous comment in a leaked e-mail from the University of East Anglia, “no upward trend” has to continue for a total of 15 years before we get worried."
Personally, I'm more worried by the fact that there wasn't nor isn't a pause in the surface trend, or indeed the lower troposphere, but that aside, such an off the cuff remark never intended for public consumption did for many provide a source of authority to (falsely) validate the significance of a short term weakening of the surface trend.
-
Tom Curtis at 21:50 PM on 2 February 2017CO2 lags temperature
poncholarp @519:
1) "The graph I was quoting .... ... not at a log offset..."
The graph plots CO2 and temperature against time. It does not plot correlation, and if you were to attempt to plot correlation, you would use a scatter plot. As it happens, the correlation between CO2 concentration and temperature is 0.888 +/- 0.037 using means of 1000 year bins of the data, with bins where one or both data sets had no representatives being excluded. (The results might differ with other means of dealing with the fact that the actual data do not have CO2 values and deuterium values on the same dates.) In contrast the correlation of CO2 forcing and temperature is 0.879 +/-0.038. Both are high, and while (as expected) the CO2 concentration has the higher correlation, both are within error of each other.
Note that we expect the correlation to be higher for concentration because temperature drives the changes in CO2 concentration, while CO2 forcing only partially drives the temperature over that period. In contrast, in the modern period, when it is known that temperature is not driving CO2 concentration, we expect CO2 forcing to correlate better with temperature than does CO2 concentration. And indeed, that is the case.
In any event the difference between CO2 concentration and CO2 forcing plotted against (in this case the Epica Dome C 800,000 year record) is scarcely noticable to the naked eye:

(Note, the data terminated 24,000 years BP for deuterium, but there was no data for CO2 in the 24,000 - 25,000 years BP bin, hence the first data point is for 25,000 years BP.)
2) "If you could accurately subtract..." What utter tripe, and you know it to be utter tripe because your conditional "If you could" shows that your conclusion that "...you would clearly see that warming trends have no correlation to co2" is simply made up. As it happens, they also have ice core records of methane and nitrous oxide, and you are simply wrong. Your made up "fact" is a fiction.
3) "Very impessive graph though that ... now further proves my point" I am very certain it does not, but cannot mount any argument because you have completely failed to provid evidence for this claim. Given that, it amounts to sloganeering.
4) "The bar graph you used implies that co2 is a warming driver... when, this is what is being debated in this thread ..."
Now, either you are attempting to criticize the standard theory of greenhouse gases and the LGM - which is that temperature responds to the log of CO2, and that CO2 was one of several relevant greenhouse gases, and that changes in albedo had slightly more effect than the combined effect of greenhouse gases. In that case I do not need to support the graph because it simply presents that theory you are trying to criticize - and shows that you have not accurately presented it.
Alternatively you are trying to refute a theory of your own concoction that no informed person believes, in which case who cares. I think, however, that you are trying to pass of the theory of your own concoction as that which climate scientists use, and pretend the refutation of your nonsense thereby refutes thousands of person/years of research.
Moderator Response:[PS] Both of you need to keep it civil. Take a deep breath, ignore provocation and stick to discussing the science.
-
uncletimrob at 17:57 PM on 2 February 2017Global warming hiatus claims prebunked in 1980s and 1990s
@5 OPOF, I have great difficulty explaining this to people, I'm guessing because 30 years in some cases a significant fraction of their lives. Even people with some matematical training are happy to pick a couple of yeaars to prove their point but to ignore long term trends. Personally I hope that the models and trends are shown to be erroneous, but the evidence is stacked against that I believe.
-
Doug Bostrom at 16:30 PM on 2 February 2017Global warming hiatus claims prebunked in 1980s and 1990s
A deep dive comes up with a fascinating report. Thanks for this; great stuff.
-
One Planet Only Forever at 09:53 AM on 2 February 2017Global warming hiatus claims prebunked in 1980s and 1990s
The common practice for evaluating climate data has always been to look at a 30-year set of data (along with all the previous history that is available). That was always the way that the Canadian Building Code climate data for design was updated every 10 years, a new most recent 30 year set of data being the basis for location specific design values (along with the full history of data for each location).
An appropriate way to look at the trend of the data is the 30-year rolling average.
There has been no pause/hiatus in the 30-year riolling average. Evene the 40 year satellite data would show a fairly steady rise of the 10 years of 30-year rolling average.
Looking at shorter sets of data (or cherry-picking bits of detail from the historical record) is the only way to create the impression of justification for claims that warming due to increased CO2 is not continuing to occur, or the rate of warming has dramatically changed from a previous rate in a way that is inconsistent with the current best understanding of climate science.
-
Tom Curtis at 09:52 AM on 2 February 20172017 SkS Weekly Climate Change & Global Warming Digest #4
In the humour department comes this paper refuting the science of global warming:

-
chriskoz at 07:16 AM on 2 February 20172017 SkS Weekly Climate Change & Global Warming News Roundup #4
In case AUS federal politics are not on this site's radar, here's the rebirth of "clean coal" meme debunked here in the past:
Coal could get clean-energy subsidy under new Turnbull focus
The option of redirecting federal subsidies from exclusively renewable energy projects to encourage investment in new, coal-fired power generators, is among "several ideas" being considered as part of a wide review of policy.
my emphasis
So Turnbull will have directed the subsidies to coal power stations in a move embracing his predecessor (Abbott) slogan that "coal isgood for humanity". Sad but it was somewhat predictable: Turnbull revealed time and time since becoming PM, that science is not any guidance in his policy decisions.
-
robert test at 07:11 AM on 2 February 2017Global warming hiatus claims prebunked in 1980s and 1990s
Wonderful article. A few weeks ago I was having a conversation with someone I know who is a long-time AGW denier who frequently waffles on exactly the position he takes.
In that conversation he denied that anyone has claimed there was/is a pause in warming.
Ari Jokimäki observes that "apparently, the first claims of global warming hiatus after 1998 were made in 2006 by well-known climate change mitigation opponents."
Of course there is the distinction between the science literature and the popular literature.
I would like to see an attempt made to create a complete bibliography of the leading denier articles that claimed there was/is a pause in warming.
The historical record of this travesty should be preserved.
-
nigelj at 07:06 AM on 2 February 2017Global warming hiatus claims prebunked in 1980s and 1990s
Excellent history. I find this pause issue pretty interesting, just as a lay person observer. I think a lot of this depends on how you define a hiatus or pause.
For example, I'm looking at the NASA Giss surface temperature record, and clearly there was a slowdown in surface temperatures from roughly 2002 - 2010, (just eye balling the graph)and there were also previous slowdowns like this. I see this as a slowdown or pause of at least some kind. I would suggest the general public see this as a pause, and it would be most unwise to say to them its not a pause, or you come across as claiming white is black. It's important not to let the denialist people spook you into making wild claims. Of course you can say with validity that this "pause" was not statistically significant.
I think it would be valid to say theres been no 'pause' in terms of the underlying greenhouse effect, or total energy accumulation, because that is what the evidence shows. But you should be specific that theres no pause in terms of energy accumulation, and not simply say there was no pause of any kind.
The real issue to me is what caused the pause in surface temperatures? The most likely explanation is natural variation or noise.
Given the greenhouse effect should in theory and assuming it is the only climate forcing agent, cause a straight line, it can only be natural variation. Foster and Rhamstorf subtracted all known natural cycles from the temperature record and were left with something getting near a straight line, reinforcing the natural variation theory. There was nothing to suggest something totally unknown was at play.
The sunspot cycle is known to be a factor that can supress or exaggerate temperatures for a period.
Ocean cycles clearly affect surface temperatures, because el nino and la nina years stand out. It appears there were a lot of la ninas and weak el ninos during the slow period, which suggests some sort of ocean process. My understanding is energy went into the deep oceans, and it's hard to measure this affect on temperatures at that depth, so hence the generally flat global temperatures.
Clearly the pause is now over, which suggests this ocean phenomenon has reversed and may be cyclical. But do we know for sure, could you get quite a long pause? It seems to me these ocean cycles are not well understood. However the ocean can't by definition act as some sort of heat sink forever, and that heat is going to come out, or alternatively the ocean would stop absorbing so much heat. Given the big jump in temperatures over the last three years it must be one or the other?
The IPCC back about 1990 also predicted slow periods of about 10 years, due to natural variation, and we have seen a slow period of about 6 - 10 years depending on what graph you look at. This prediction surely reinforces that the IPCC is a reliable authority. Rather than playing down the pause, I would highlight this. Don't let the denialists frame the debate and make the definitions.
-
Tom Dayton at 05:49 AM on 2 February 2017Global warming hiatus claims prebunked in 1980s and 1990s
Alexandre, unfortunately there is a lot of confusion about this topic due to use of jargon and loose terminology rather than actual disagreements among scientists. I agree with Tamino (enter "pause" in the search field of his site) and others that there has been no hiatus/pause/slowdown in "the trend" of surface temperature, given that I and those other people define "the trend" to mean the "long term" trend in surface temperature. There is no doubt among those people that the surface temperature has, does, and always will vary around that long term trend, as "short term" trends that are too short to reasonably imply any change in the underlying long term trend.
Some scientists have investigated the causes of "the pause/hiatus/slowdown," unfortunately using those terms instead of being clear that they were discussing one of (or some of) those short term trends, not the underlying long term trend.
-
Alexandre at 03:37 AM on 2 February 2017Global warming hiatus claims prebunked in 1980s and 1990s
Tamino claimed several times that the hiatus is statistically not even there (e.g. here). How does the SkS team weigh in in this issue?
-
John Hartz at 01:26 AM on 2 February 2017Trump is copying the Bush censorship playbook. Scientists aren't standing for it
Recommended supplemental reading:
A new battle over politics and science could be brewing. And scientists are ready for it by Chris Mooney, Energy & Environment, Washington Post, Jan 31, 2017
-
Ger at 22:49 PM on 1 February 2017We may be closer than we thought to dangerous climate thresholds
Rate of change: during 1950-1980 the average rate of change was around 0. Like if the than emitted fossil CO2 was in equilibrium with the nature. Nature, the sea, was in that period capable to absorp that amount of CO2. Currently It looks like the top layers of the oceans are satured so more CO2 stays in atmosphere, capturing more heat.
I saw (sorry forgot reference) at another site that it takes a 30 years before the mixing of the deeper layers is back in (some sort of) equilibrium.
And lo and behold, around 2010 we see an even faster rate of heating up occur. Even if the heating is a 0.1 C (its more a 0.15~02) a year, after 13 more years we would be at 2.3 C already before (if nothing changes) we pick up another sprint in temperature rise)
-
MA Rodger at 22:06 PM on 1 February 20172017 SkS Weekly Climate Change & Global Warming Digest #4
scaddenp @10.
Your graph is not unusual for SO2 graphs in that it stops at 2000. Coal-use has thankfully ceased its massive post-2000 rise and perhaps even peaked, as data from the BP 2016 review suggests.
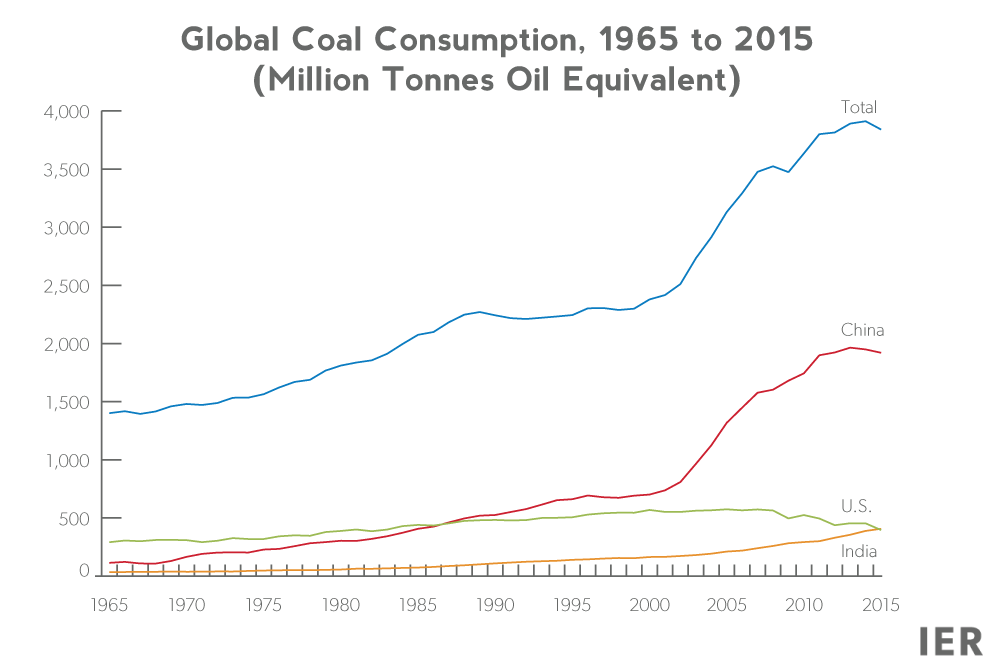 The stat is mirrored in CDIAC CO2 emission data (2000 - 2,413Gt(C), 2015 - 4105Gt(C), down 2% on 2014).
Thankfully, the post-2000 global SO2 emissions are not as dramatic as CO2 emissions, this graphic of SO2 from Klimont et al (2013) demonstrates.

And even more up-to-date is the NASA Global Sulfur Dioxide Monitoring Page which shows emissions 2005-14 from 500 locations around the globe and so allows analysis by latitude. It also splits emissions into electricity generation (totalling ~50%), smelters (~12%), FF (~12%), volcano (~25%). And it shows the monitored anthropogenic sources falling from 2007 (58 TgSO2) to 2014 (41 TgSO2). We can presumably expect this trend to continue for some years as SO2 emissions are further decoupled from coal use and coal-use hopefully also dropping substantially.
-
poncholarpez at 20:24 PM on 1 February 2017CO2 lags temperature
Tom Curtis. The graph I was quoting in the OP isays it is a direct correlation to historical observed co2 v temp. They rise at the same rate, not at a log offset with an assumed modified result for proportion of co2 making up greenhouse gasses in the atmosphere. If you could accurately subtract other greenhouse gass portion of the temprature into that graph, then you would clearly see that warming trends have no correlation to co2. Very impessive graph though that combined with the feedback given, now further proves my point but in the upside spikes of the graph too. Thanks for that ;)
The bar graph you used implies that co2 is a warming driver under the greenhouse gasses group, when, this is what is being debated in this thtead, yet it is being taken as gospel that it is?? Furthermore, the bar graph you provided takes no account of water vapour as a greenhouse gass and takes no account of potential cloud cover conditions. Ill informed, nice try.
Moderator Response:[JH] Please keep it civil.
-
scaddenp at 14:07 PM on 1 February 20172017 SkS Weekly Climate Change & Global Warming Digest #4
Tom, I was basing of this
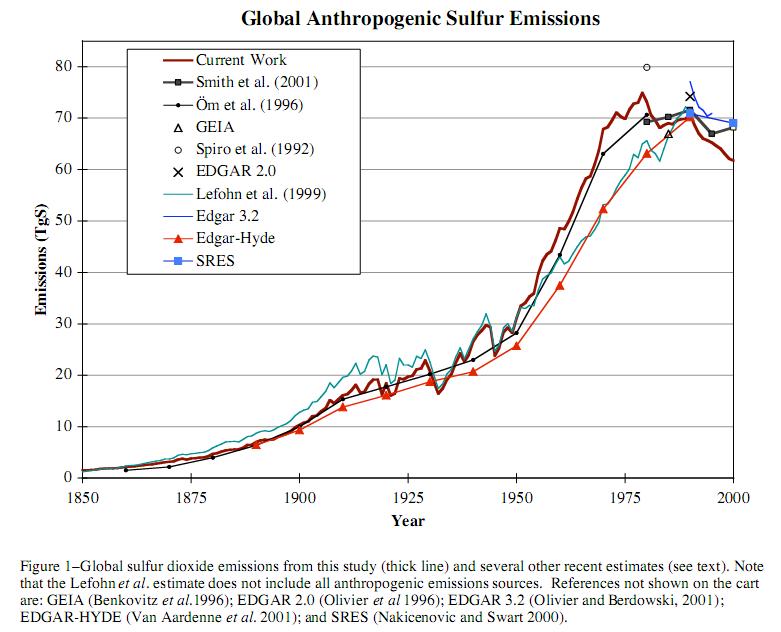
which certainly to come from a published source.
-
nigelj at 13:33 PM on 1 February 20172017 SkS Weekly Climate Change & Global Warming Digest #4
So coal causes some quantity of cooling through the global dimming effect. But as noted, it also causes warming, and on the best evidence we have this is the more powerful effect, although with some level of uncertainty.
However we cannot stop there. I read this recently so thought I would add it in. A recent study by the WHO has found air pollution, including particularly from coal, causes far more deaths than previously thought, as below.
www.who.int/mediacentre/news/releases/2014/air-pollution/en/
And coal mining remains a very hazardous occupation. We had a coal mine explode a few years back, killing dozens of people, despite all the modern technology, and health and safety rules.
And we are no longer in the Industrial Revolution with coal generating steam power or home heating. We now have other energy alternatives.
Things constantly evolve and change.
You have to consider the big picture, and the full range of evidence. Trump seems to struggle with that, as do his inner circle.
-
Tom Curtis at 12:32 PM on 1 February 20172017 SkS Weekly Climate Change & Global Warming Digest #4
scaddenp @7, do you know that global dimming is reducing from a scientific study. My understanding was that as aerosols decreases in the developed world due to the introduction of scrubbers, it increased in the third world, and particularly in China due to their rapid industrialization. Because aerosols tend to be regional effects, it may be that global dimming as measured in the US, EU or Australia has fallen, but that globally it has remained the same or increased. I have made a quick skim of Wild 2012, and Wild 2016, and can see no definite conclusion on that point. Wild 2012 does illustrate the different trends in different regions (Figure 2).
-
jbpawley at 11:48 AM on 1 February 2017Trump is copying the Bush censorship playbook. Scientists aren't standing for it
So, where is the URL of the WWW site for this March March? We need to support the organizers before they can be fired. And the need those cowering Deomocrats to get up and start leading!
Moderator Response:[JH] The url is embedded in the term, "March for Science." Click on it and you will be taken to the march's website.
-
scaddenp at 11:38 AM on 1 February 20172017 SkS Weekly Climate Change & Global Warming Digest #4
But independent of Tom's comment - scrubbing technologies are reducing global dimming independently of the about of FF we burn. As far as I can tell, the models for zero emissions also nil the human aerosols.
-
Tom Curtis at 11:22 AM on 1 February 20172017 SkS Weekly Climate Change & Global Warming Digest #4
Ravenken @5, the particulate matter is soot, which contributes to global warming, and is accounted for in models as Black Carbon (BC). Coal or oil with high sulfur contents also release sulfur dioxide (an invisible gas). That reacts with components in the atmosphere to form sulfates, very small particles that reflect sunlight and also form cloud condensation nuclei. As a result of the latter, the presence of sulfates will result in more, but smaller water droplets in a cloud, which results in a greater cloud albedo, and reduced rainfall. The effects of sulfates are taken into account as the aersol direct effect (the albedo of sulfates), and the aerosol indirect effect (the impact on clouds by providing cloud condensation nuclei). Combined the consequences of these two effects is what is generally called global dimming. As both effects are taken into account in climate models, so also are the effects of global dimming. However, the uncertainty of the strength of the two effects is one of the largest uncertainties in climate science.
From the above, you should see that the impact of reduced aerosols from shutting down fossil fuel energy sources is taken into account in scenarios with rapid decarbonization of the economy.
-
Ravenken at 11:06 AM on 1 February 20172017 SkS Weekly Climate Change & Global Warming Digest #4
scaddenp- thank you for getting back to me...
I'm still a little in the dark... what I am trying to get at is, as global society starts using less coal I thought that might decrease the amount of global dimming occuring from coal power plants... There might not be any dimming from coal plants (as my ignorance would attest) but I'm assuming there is... I get and understand the CO2 is going nowhere but I thought the particulate matter from coal plants contributed to global dimming...
I guess my first question is do coal plants contribute to global dimming. If so, how much... I appreciate your patience.
-
Tom Curtis at 09:10 AM on 1 February 2017CO2 increase is natural, not human-caused
KalleH @21, you are quite correct that I intended to write "...determine the source of the [decrease] in atmospheric C14". Thankyou for picking up on my error.
-
KalleH at 08:27 AM on 1 February 2017CO2 increase is natural, not human-caused
Tom -
In your post (29th November 2016, #19 above) you wrote:
That being said, it is a bad practise to relly on a single indicator in making these sorts of determinations. In fact there are at least 10 different lines of evidence that help us determine the source of the increase in atmospheric C14.
My understanding was that the levels (or actually ratio) of C14 were decreasing as they come from a fossil source. Am I wrong, or could you possibly have meant CO2?
-
Haze at 21:08 PM on 31 January 2017Fact Check: Trump's Cabinet Picks on Human-Caused Global Warming
Apologies. Having written comment 1, I then scrolled down the page to see, much to my chagrin, the next item was "March for Science'. Good-o but as the 45th POTUS has dismissed other such marches do you thinkthere will be on going and varied protests? This is political I guess rather than science so if it is scrubbed then fair enough
-
Haze at 20:53 PM on 31 January 2017Fact Check: Trump's Cabinet Picks on Human-Caused Global Warming
The outlook for the Paris Agreement and the funding of climate scientists doesn't look too good at the moment, if media reports are to be believed. It seems that the new administration may not be entirely convinced by the 97% consensus that humans are responsible for all of the global warming since 1950. If so what steps will/can climate scientists, particularly in the US but also in other locations, take to convince the new administration that climate change is dangerous? Presumably plans were put in place before Mr Trump was elected as it has been known for many months that his election was a possibility. Have any plans been made? If so will they be made public? If not will plans be made or will climate scentists vacate the field as it were?
-
scaddenp at 09:27 AM on 31 January 20172017 SkS Weekly Climate Change & Global Warming Digest #4
Not common to see sealevel rise talked about in inches but I just found this image

based on this paper.
-
scaddenp at 06:51 AM on 31 January 20172017 SkS Weekly Climate Change & Global Warming Digest #4
Ravenken, I cant comment on the forcing used to climate commitment papers but I would note a couple of things:
1/ Aerosols are increasing decoupled from CO2 emissions anyway thanks to scrubbing technologies and have been dropping since 1990s.
2/ If you look at the forcing strength, the heating from increased CO2 is rather stronger than aerosol cooling.
From this I would conclude the GHG concentration is most anthropogenic important factor affecting temperature.
-
Ravenken at 06:23 AM on 31 January 20172017 SkS Weekly Climate Change & Global Warming Digest #4
I've got a question that I believe SS can best answer/direct me... do the modeled forecasts for temp from reduced CO2 also account for decreased solar dimming and thus more wamring?
-
roycekimmons at 06:19 AM on 31 January 2017Global warming theory isn't falsifiable
This is an interesting topic that has recently been published on in the Public Understanding of Science journal by David Mercer. His analysis documents how Popper is invoked by those on both sides of the issue, and his analysis seems to be very illustrative of many of the arguments appearing in this thread. If you had not seen it, here's the link: http://journals.sagepub.com/doi/abs/10.1177/0963662516645040
Moderator Response:[PS] Link fixed. Please learn how to do this yourself with the link tool in the comments editor.
-
indianaclark at 03:43 AM on 31 January 2017CO2 is not a pollutant
If we can define pollution as the contamination of air, water, or soil by substances that are harmful to living organisms, most substances can fill-the-bill, especially when we consider high/low concentrations and temperatures. Plants that grow in areas that we don't want them will be considered as weeds. Carbon Dioxide that becomes too concentrated for our environment certainly should be considered a pollutant, but the question, and I think it is still unanswered scientifically, is what is that level? The dynamic complexity of the Earth's ecosystem suggests that when we begin tinkering with nature we may find ourselves creating additional problems for mankind that are currently unforseen.
-
Montross515 at 23:55 PM on 30 January 20172017 SkS Weekly Climate Change & Global Warming Digest #4
If warming melts the polar caps the ocean goes up 100 or more feet. It hasn't gone up an inch yet, so why worry. 99% of everything in our solar system is in the Sun, so it controls and we don't understand it.
Moderator Response:[JH] Sloganeering snipped.
[PS]
Thank you for taking the time to share with us. Skeptical Science is a user forum wherein the science of climate change can be discussed from the standpoint of the science itself. Ideology and politics get checked at the keyboard.
Please take the time to review the Comments Policy and ensure future comments are in full compliance with it. Thanks for your understanding and compliance in this matter. To avoid sloganeering back your assertions with data/references to support your view.
-
Digby Scorgie at 17:35 PM on 30 January 2017Joint Statements on Climate Change from National Academies of Science Around the World
An additional thought on Kevin Anderson's lectures is that the shrinkage of 10% per year is in emissions. I have assumed that this equates to a similar shrinkage in economic activity — of the traditional type. My assumption might not be correct.
On the other hand, there really is a conflict between the 10% and 4% reductions. We need 10% to avoid 2o of warming, but the economists say we can't do more than 4%. Unfortunately 4% is not good enough — my understanding is that it is likely to lead to the dreaded 4o of warming.
-
Digby Scorgie at 14:14 PM on 30 January 20172017 SkS Weekly Climate Change & Global Warming Digest #3
Tom Curtis @10
My cheeky response is: "I have no children (phew!)." My serious response is that there is a problem only if those who suffer by ignoring climate change also cause others to suffer as a result. Does this really apply in the case of one group of one country's farmers?
michael sweet @11
See serious response above.
RedBaron @12
You put the problem in an entirely different light. As usual it's a lot more complicated than one might first think.
-
RedBaron at 13:52 PM on 30 January 20172017 SkS Weekly Climate Change & Global Warming News Roundup #4
The Fox Who Will Guard the Nation’s Henhouses (And Five Questions the Senate Should Ask Him) by Karen Perry Stillerman, Union of Concerned Scientists, Jan 24, 2017
I got a kick out of this one particularly because I used the exact same analogy 2 days ago! Excellent article!
-
Digby Scorgie at 13:51 PM on 30 January 2017Joint Statements on Climate Change from National Academies of Science Around the World
Further to my comment @9, I note that Kevin Anderson has been giving variations and updates of the same lecture for some years now. The relevant quotation for my comment is as follows:
"There is a widespread view that 4oC is incompatible with an organized global community, is beyond adaptation, is devastating to eco-systems, and is unlikely to be stable." Such warming is therefore to be avoided "at all costs".
-
chriskoz at 13:21 PM on 30 January 20172017 SkS Weekly Climate Change & Global Warming News Roundup #4
Re: "21 kids are fighting Trump's attempts to delete federal climate websites".
The article is misleading. The "The "Juliana v United States" case was filed in and heard for the first time in Oregon in March 2016 well before the 2016 election campaign and even before T-man emerged as its frontrunner. The Obama administration (against whom the suit was filed) tried to dismiss it and failed according to this ruling. The latest ruling on the case by district judge Ann Aiken from Nov 10, 2016, allowing it to proceed, coincides with T-man election victory date but has nothing to do with T-man himself. The case would have proceeded unchanged had Clinton won the alection (I doubt judge Aiken's mind was influenced by that even in the yesterday of the ruling). Needless to mention that, T-man's "attempts to delete federal climate websites" is completely irrelevant to this case.
So, the article is very misleading, confusing the irrelevant events (the rise of an irresponsible conman to the POTUS office and his subsequent actions) with the Juliana v United States case which precedes these events.
Prev 414 415 416 417 418 419 420 421 422 423 424 425 426 427 428 429 Next


