


 Arguments


Recent Comments
Prev 417 418 419 420 421 422 423 424 425 426 427 428 429 430 431 432 Next
Comments 21201 to 21250:
-
scaddenp at 13:40 PM on 18 May 2017Inoculation theory: Using misinformation to fight misinformation
OPF - you might like to at Moral Foundation theory which gives the rather extends the understanding of liberal/conservative belong helpful/harmful. Potentially a lot of messaging on climate change has failed to touch the moral dimensions important to conservatives.
-
One Planet Only Forever at 13:14 PM on 18 May 2017NY Times’ Stephens can’t see the elephant in the room on climate change
Digby Scorgie,
I just posted a comment to John Cook's most recent OP "Inoculation theory: Using misinformation to fight misinformation" that may give you reason to continue trying to be Helpful. There is a broad range of ways to be helpful locally-globally in the short-term to Infinitely long-term.
Climate Change is probably the biggest battle front of Helpful actions. It is global, deals with very long term considerations, and requires changes that are contrary to a massive amount of incorrectly over-developed perceptions of prosperity and opportunity. And it requires changes that are undeniably contrary to the interests of many very wealthy powerful people.
Helping on some of the other Sustainable Development Goals would undeniably be easier. But support for all of those goals is required from everyone who genuinely wants to be helpful.
-
One Planet Only Forever at 12:42 PM on 18 May 2017Inoculation theory: Using misinformation to fight misinformation
It may be helpful to identify a more important differentiating characteristic of individuals than "Liberal vs. Conservative".
I think it is more important to understand whether a person has a stronger:
- Desire to be Helpful in the development of a lasting better near and long term future for others (and themselves)
- Desire for a better present for themselves even if getting it could be understood to be Harmful to others (and themselves).
The limitation of Liberty as described by John Stuart Mill in "On Liberty" is essentially that freedom of action resulting from freedom of thought must not have a negative impact on others. Mill does not mention Future generations but it is likely he would have agreed that future generations qualify as Others. And Mill does state that the presentation of opinions that are likely to result in actions by others that are harmful would be an unacceptable action; something that people should not have the Liberty to do; something that the State would be expected to and allowed to effectively mitigate/address (I am currently re-reading the Essay so I am pretty sure of the statements made by Mill and his co-thinker Harriet Taylor, but I would have to spend some time tracking down exact quotes).
I Capitalized and Italicized Helpful and Harmful and will simply use those terms to refer to the types of character.
Though the amount of Helpful people (or degree of helpfulness of people) in the Liberal and Conservative categories could be evaluated to then try to declare which identifiable category was more Helpful, that would not be a helpful evaluation.
What would be more helpful is to focus on the importance of people desiring to be Helpful and recognize that Helpful people could probably exhibit the full range of any other type of categorization. That clarification of what it means to be Helpful could also be used for inoculation and be more helpful by protecting against a broad spectrum.
There should be very little doubt today about what constitutes being Helpful. There have been international efforts to increase awareness and understanding of human survival and improvement of life on this amazing planet. The 1972 Stockholm Conference established a rather comprehensive understanding of human interaction with the environment and other life on this planet. And the international efforts to increase awareness and understanding have continued though the past 45 years with the Sustainable Development Goals being the most recent compendium of awareness and understanding of the changes required for humanity's Better Future (with extensive back-up for each stated Goal). Helping achieve the Sustainable Development Goals with actions ranging from Locally to Globally and from Short-term to Infinitely Long-term is clearly what be Helpful means. And any actions that delay achieving the Sustainable Development Goals are clearly Harmful.
Actions regarding Climate Change are a specific distinct Goal. But the other goals also need to be achieved. Just achieving the Climate Change Goals would be rather irrelevant form the perspective of the Future of Humanity. The same goes for any of the other goals. People desiring the pursuit of any of the other goals would also need to understand the importance of supporting the climate change goals. I see this because of my developed understanding and promotion of Fair Trade. The diversity of Fair Trade issues can each be seen to relate in some way to the importance of achieving all 17 stated goals (not just the challenge of climate change - even though it is a significant consideration for Fair Trade food growers). Achieving the 17 goals will dramatically reduce the need for Fair Trade Promotion (ideally I would like to be worked-out-of-the-volunteer-job of promoting Fair Trade). Of course climate science will always be in need of efforts to increase awareness and better understanding even after human activity that is Harmful has ended. And maybe that leads to some jealousy by science-minded people who are not as interested in being Helpful.
The more Helpful people are more likely to have a better future (something I consider to be an axiom and have shared many times with my family, friends, co-workers, and any others when the opportunity to do so arises - a different way of stating that axiom is: Winning by getting away with being Harmful, or being less helpful than you could be, is possible but becomes increasingly difficult to maintain and ultimately cannot be sustained).
-
Digby Scorgie at 11:58 AM on 18 May 2017NY Times’ Stephens can’t see the elephant in the room on climate change
Susan Anderson
Relax, lass, and enjoy the show. I suppose I should be more concerned about the climate catastrophe heading our way, but in my cynical old age, I've found that it is easier to write off humanity, sit back, and watch the wheels come off — in slow motion.
Despite the foregoing, in moments of weakness I still find myself firing off "e-mails to the editor" from time to time. Recently I've had such missives on climate change published in no fewer than three different magazines. You won't find them, though, because they're all local New Zealand magazines. Nothing helps, of course.
-
sauerj at 10:57 AM on 18 May 2017Citizens’ Climate Lobby - Pushing for a price on carbon globally
Linked below is a very good, explanatory TED talk (13mins) which was filmed just last month. The speaker is Ted Halstead, leader of the Climate Leadership Council, which is advocating a GOP-based RNCFD (revenue-neutral carbon fee & dividend) solution to hasten the reduction of carbon emissions. The starting point ($40/ton) is higher than CCL's but the ramp-up rate (from year-to-year) is slower after the start. But other than that, the two schemes are nearly identical.
www.ted.com/talks/ted_halstead_a_climate_solution_where_all_sides_can_win#t-775828 -
Bob Loblaw at 10:24 AM on 18 May 2017NY Times’ Stephens can’t see the elephant in the room on climate change
Susan (or anyone else trying to add links to a comment):
The way to linkify a link when writing a comment is to first select the text you want to appear in place of the link (which can just be the text of the link). Then go to the Insert tab, and choose the little chain link symbol. A window will pop up where you then enter the hyperlink/URL.
You used to have to select some text first. It looks like the widget has been updated and now you can open the Insert Link dialog box even if you haven't. If text was preselected, the dialog box only has a field for the URL. If no text was selected, it will have both a text box and an URL box.
-
nigelj at 07:38 AM on 18 May 2017Inoculation theory: Using misinformation to fight misinformation
The misinformation has a number of driving factors in my opinion:
The internet is a great thing, but has unfortunately given a platform for mass misinformation and junk science, and shallow rhetorical sophistry.
People have also become used to science, and bit disrespectful of science.
The dubious claims about "Iraq weapons of mass distruction" probably seriously eroded trust in the elites and authorities. Misinformation has filled the gap.
Liberalism correctly promotes tolerance, but sometimes this becomes tolerance of the absurd.
Conservatism has retreated In America into a closed, ideological bubble of strident beliefs, and anti logic, anti government programmes, and anti science thought. Vested business interests dominate. Not with all conservatives, but with some.
This innoculation approach by explaining the facts, and the myth, and the techniques of rhetorical sophistry used to obscure the facts, is without doubt one very good tool to fight back. It is something that needs wider exposure especially in schools. Don't blame yourself Mr Cook, you can't single handedly solve the issue.
Misinformation is similar to propaganda. I recall reading an article where after a while this repeating onslaught on the brain causes some people to simply give up, as they cant process the information any more so they just accept it.
Some people also welcome propaganda. "For propaganda to be effective, it requires submissive subjects. ... Most people want to be given ideological marching orders and talking points from an authority." Refer link below:
www.zerohedge.com/news/2016-09-09/why-does-propaganda-work-some-people-want-it
-
Susan Anderson at 06:59 AM on 18 May 2017NY Times’ Stephens can’t see the elephant in the room on climate change
kids in schools and on buses, home attacks, spray painting, random stuff, real violence. Most definitely hate crimes, and there's a lot of it. This is very OT, so I will desist, but the frequency is mindboggling.
The other articles in that magazine (a lot) were also very fine. Thanks for activating the link.
-
nigelj at 06:28 AM on 18 May 2017NY Times’ Stephens can’t see the elephant in the room on climate change
Susan Anderson @7, yes I accept Bret Stephens is not a Trump Lackey. Your links do show he has been genuinely critical of Trump on some things. He does share other views with Trump, and maybe I jumped to conclusions out of annoyance with the man.
I agree with your comments in post 12 about Trump, liberalism, education and hate crimes ( I don't actually like the term hate crimes as its a bit vague and pc sounding, but I assume you mean demeaning comments and actions towards moslems and other minority ethnicities. I hate this sort of thing with a vengeance). Trump and his scaredy cat, obedient, sychophantic Republican supporters (and they truly are acting like lackeys) have a lot to answer for.
However I dont think we can simply stay silent about people like Stephens. I know there's a risk that every word one says draws attention to the guy, and he obviously wants this, but it's even worse to say nothing, and create the impression what he says is the truth (on climate change). What the other commentators at the NY times need to do is stand up for the science of climate change, and be less reticient about it. This will take the focus off Stephens. I think Stephens is a bit of an attention seeker.
Liberalism correctly promotes tolerance, and generally avoiding insulting comments, but sometimes this evolves into an unfortunate tendency to be overly restrained, confused and bogged down in detail and excessisve nuance. It's important to sometimes speak out simply and strongly, and call a spade a spade, and tell people they are simply wrong, but obviously back it up with solid evidence and logic.
-
Susan Anderson at 05:22 AM on 18 May 2017NY Times’ Stephens can’t see the elephant in the room on climate change
Reminder: Stephens is a follower of Lomborg. He appears not to be numerate or have a good scientific training. He's a writer (not an editor).
Liz Spayd, the "Public Editor" was a poor choice. She refuses to engage with the many fact-based responses she received. To these two, facts appear not to matter, and nothing appears to penetrate that armor. I have one friend whom she criticized publicly precisely because he provided a fact-based rebuttal. What do you do with people who don't want to hear it because they're so convinced they're right? (It's happening on the left too these days.) It's easier to hate/attack than to think/reason/act.
-
Susan Anderson at 05:15 AM on 18 May 2017NY Times’ Stephens can’t see the elephant in the room on climate change
I only halfheartedly agree with myself. But the word "lackey" has to go, and Stephens does not support Trump. He does, however, help the enablers and that hurts the 1+1 = 2 problem.
As to NYT commentariat, we have a much bigger presence of Trump supporters than we usedta (also Russian and other kinds of trolls, some paid). We also have an increase in hate crimes, even in the more liberal Boston area. The empowering of narrow minded selfishness across the board is very bad and feelings about immigrants are ugly. Lewis Black did a neat piece on how Canada was too busy helping our victims to take us on.
I had a conversation about ethics recently and was reminded of the WWII poster: "Use it up, wear it out, make it do ... or do without" and during the course of the conversation realized that what's bugging me (along with a lot of other things, like the failure of education to make kids more observant and curious and less inclined to overuse electronic devices) is that we should be on a war footing about climate.
There's no way the infotainment industry and weapons-grade marketing machine is going to let us get serious and reality until it's too late. People are right to complain that the NYT should support its "truth" campaign with actual truth. People are so horrified by Trump they can't look away. I'd have front page news every day about climate change and all its offshoots, worldwide weather, etc. Sort of like the NYT magazine that came out about the same time as the Stephens rollout, and got little attention for its stellar range and presentation.
https://www.nytimes.com/2017/04/19/magazine/our-climate-future-is-actually-our-climate-present.html
Moderator Response:[JH] Link activated.
-
rbgage at 04:18 AM on 18 May 2017NASA Retirees Appeal to their Own Lack of Climate Authority
I know nothing about the climate other than what I see out my windows. If, in fact, mankind in it's wisdom, is gumming up the environment, I'd not oppose mitigations as long as my life style doesn't plumit to that of the 17 hundreds or less.
-
Wol at 04:02 AM on 18 May 2017NY Times’ Stephens can’t see the elephant in the room on climate change
Aplogies - my post @ 10 was formatted OK when I wrote it but all the ASCII 13s disappeared in the post!
-
Wol at 04:00 AM on 18 May 2017NY Times’ Stephens can’t see the elephant in the room on climate change
I think it's important not to be drawn into arguments about the economics of CO2 reduction, which is always a frontrunner in the denialists' agenda.There are two completely different - although (obviously) intertwined issues:1) Is AGW a reality? Will it a serious threat?2) If so, how can it be ameliorated? How much would that cost?If both the answers to (1) are "yes" then economic arguments are irrelevant.To my mind it's perfectly logical to accept (1) but to hold the opinion that one doesn't care. But that's rarely advanced as an argument: deniers will not accept the science in the first place.Engaging them with the pluses and minuses of the economics of preventing AGW is therefore useless and rather plays into their hands. -
Dcrickett at 02:55 AM on 18 May 2017NY Times’ Stephens can’t see the elephant in the room on climate change
Typo. Sorry: it should be
God said, Let 1+1=2. And it still is.
"Benign essential tremor" is not so benign.
-
Dcrickett at 02:52 AM on 18 May 2017NY Times’ Stephens can’t see the elephant in the room on climate change
Ref: Susan Anderson & Nijelj discussion
Most often I agree whole-heartedly with Ms Anderson; this time I agree half-heartedly. Yes, NYT has several fine climate reporters, and they deserve far more attention and respect than they get.w to be paranoid while living and working in Mexico for several years. Paranoia is a survival techdnique, not an illness. Being pretty thoroly mexicuted, I see the hiring of Stephens as a ploy to make NYT look "fair and balanced" on the climate issue, for revenue's sake. (Regrettably, my name for people thus selected violates the valued standards for commenting.)
Reality is worse. The NYT commentariat's "liberalism" is shallow. There was an article recently about "Dreamer" students at the University of California at Merced: https://www.nytimes.com/2017/02/03/education/edlife/daca-undocumented-university-of-california-merced-fiat-lux-scholars.html which aroused very hostile reactions from a commentariat that not so long before had been sympathetic to deportees who were upstanding members of their communities. Why the difference? The dreamers were taking university slots and scholarships that the commenters crave for their own kids.
An uncomfortably large number of members in my famously "liberal" parish insist on believing my kids (who are now 50-somethings) got great scholarships only because they are racially mixed. Same thing: the not-like-us people are getting goodies rightfully ours. And this is neither "conservative" nor "liberal" — it is merely bigotry.
Gotta get off this "Climate is a right/left divide" thing. Courteously protest Stephens for his climate mendacity. A granddaughter of mine marched in her local Climate protest with a picket sign: "God said, Let 1+1=2. And it still his." Denial of this is not a matter of opinion. It is a lie, a dangerous lie.
Moderator Response:[PS] Link fixed. You might like to take a moment to reread your comment before submitting to reduce typos. It makes it easier for others to read.
-
Susan Anderson at 01:32 AM on 18 May 2017NY Times’ Stephens can’t see the elephant in the room on climate change
nigelgj, I don't dispute the awfulness of the Stephens hire or his opinions, and I consider the insidiousness of Lomborgianism more dangerous than outright denial in some ways. But it is important to be accurate and the word "lackey" is classic early Iron Curtainspeak as well as incorrect in Stephens' case. https://www.nytimes.com/2017/05/10/opinion/comey-firing-donald-trump.html and https://www.nytimes.com/2017/05/12/opinion/how-trump-may-save-the-republic.html
My other point, which is advanced with humility, I hope, is that the broad focus on him, though negative, actually promotes his "brand" where a studied lack of interest in his dishonesty would, in my humble opinion, have been more effective.
In addition, the NYT, as I said, has several fine climate reporters and they get a whole lot less attention than this mess. This eagerness to condemn and isolate with the "pure" ensures that the united Republicans will overcome fractious Democrats for the foreseeable future. Republicans aren't boycotting Fox and Breitbart. Science deniers are not so choosy about the tools they use.
Moderator Response:Links fixed. Use the Link tool in the comment editor to create these yourself.
-
DPiepgrass at 21:29 PM on 17 May 2017Hockey stick or hockey league?
Can anyone point me to a graph of temperature reconstructions longer than 1000 years?
Moderator Response:[TD] Pages 2k for the past 2,000 years. Marcott for the past 11,000 years, Shakun for the previous years back to 20,000 years ago, shown together with recent instrumental records (click links there to get to their peer-reviewed papers, or use the Search box at the top left of this page to find more about them). But take care to not be misled by people who misinterpret or misrepresent Greenland ice core data.
-
Tom Curtis at 20:22 PM on 17 May 2017Temp record is unreliable
cosmoswarrior @405:
here are the differences between raw and asjusted GHCNv3 data, as calculated by Victor Venema:
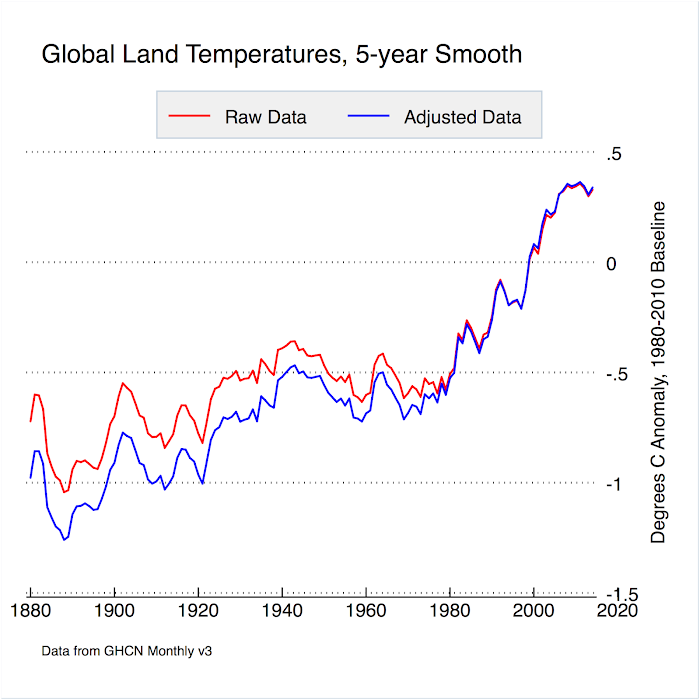
The GHCN data was until recently the entire basis of the NOAA land only surface temperature data, and almost the entire basis of the GISS meteorological stations only temperature data. The comparison applies for those sources also. As can easilly be seen, there is almost no difference between the raw and adjusted data from 1980 forward. Your claim that "the temperature history during the last two decades of the 20th century was rewritten to double the rate of temperature increase" is simply false.
-
cosmoswarrior at 19:52 PM on 17 May 2017Temp record is unreliable
How can it be said that the temperature record is reliable when in June 2015, NOAA published a paper describing certain adjustments they had made to "improve" the data, and in so doing, they eliminated the 17 year warming hiatus that was troubling many climate scientists. Not only that, but the temperature history during the last two decades of the 20th century was rewritten to double the rate of temperature increase. Assuming those adjustments were necessary to correct data errors, it opens questions as to the competency of the individuals involved in the data handling. Evidently, there were serious problems in the data gathering and processing that went on for 20-30 years, and it took an apparent slowdown in the warming to bring it to anyone's attention. Allegedly, the problem is "fixed" now, but with the lack of competency that plagued the data handling process, how do we know the fix is any better than the original?
Moderator Response:[JH] Argumentative/perjorative statement snipped. Please read the SkS Comments Policy and adhere to it.
-
Glenn Tamblyn at 17:33 PM on 17 May 2017Podcast on National Review & the science of climate science denial
Essentially all denial is implicatory denial of one form or another. Maybe the view that the detested implication will occur is true or false, but that still doesn't change the underlying fear/detestation motivation.
Is dealing with Climate Change going to lead to socialism/one world government. No, So the implication is false.
Does the reality of Climate Change imply that a Christians view that God wouldn't allow the world to be like that is wrong? Yes, the implication is true.
Either way, they both trigger denial. However, where the implication is false, there is more room to work with that. It's hard to work with the grieving Christian who has to confront their worldview being destroyed in a profound way. Because it is being destroyed and that will be painful for them -
georgitsu at 09:40 AM on 17 May 2017Podcast on National Review & the science of climate science denial
Totally agree, nigelj. Whenever I discuss climate change with my dad, his denialism always boils down to his fear of socialism and one world government.
-
nigelj at 09:08 AM on 17 May 2017NY Times’ Stephens can’t see the elephant in the room on climate change
Susan Anderson @4,
I agree alternative opinions are healthy. I dont mind quite so much if Stephens is one opinion out of a range of opinions. Ideally I look for media like a newspaper that have a range of views, or it just becomes a closed bubble, and actually a bit boring.
But the article's on this website on Bret Stephens have created the impression with me that Bret Stephens takes a lead opinion writing role, which would worry me. The articles on SS have not really spelled out whether the NY Times have a range of opinions.
But putting that aside, there's simply no excuse for blatant cherrypicking of information or getting basic facts wrong, or being generally misleading, and in my "opinion" Stephen's is guilty of all three. I'm sick of this whether he's an opinion writer or news writer.
You can be critical and/ or supportive of climate science without all that garbage. It's not opinion writing, its deceit! Yeah we have come to expect this from some conservatives, but it's not good enough.
And Stephens has expressed equally misleading views on various subjects in addition to climate change. He comes across to me as a fairly extreme libertarian.
-
Susan Anderson at 07:07 AM on 17 May 2017NY Times’ Stephens can’t see the elephant in the room on climate change
Stephens made some of his bones opposing Trump, and has had two recent articles making that clear. When he's not on the topic of climate, he's not nearly as bad. He is absolutely not a Trump "lackey" though the accusation that he is a climate obscurantist has considerable merit, and whether you're a Trumpian or Kochian is largely a distinction without a difference these days.
-
Susan Anderson at 07:05 AM on 17 May 2017NY Times’ Stephens can’t see the elephant in the room on climate change
I'm not defending Stephens but he was hired for NYT "Opinion". It's kind of like what people do about Trump, trying to insert reason, logic, and evidence where these concepts are inappropriate. If you remember that Stephens is a sort of disciple of Bjorn Lomborg, and makes his living as a soi-disant conservative commentator, you can avoid the pitfalls and trying to figure out why the stupid. It's just stupid, you can leave it at that.
So many people I respect have gone the "unsubscribe" route that I hesitate to condemn the all or nothing approach. Unfortunately, it has not had the desired effect of correcting the error, but rather amplified it. Meanwhile they've hired Brad Plumer and have a large group of good reporters. All the attention paid to Stephens seems to feed the beast, making him better clickbait that if we really ignored him.
It's an ongoing problem with the commentariat, how to find a way to effectively communicate about facts without feeding the monster of falsehood.
-
nigelj at 06:39 AM on 17 May 2017NY Times’ Stephens can’t see the elephant in the room on climate change
At least Germany are making an effort, and achieving some level of success. The trend is in the right direction and costs are no higher than America, so criticism is nit picking and misses the big picture. Instead of rubbishing Germany, Stephens could be a whole lot more supportive and maybe some constructive criticism rather than making deceptive criticisms.
It's also a classic bait and switch. Criticise Germany to take the focus of Americas problems, and Trumps pathetic attitude to climate change. Stephens is obviously another Trump lackey.
But Just looking at Germanys progress on reducing emissions in the graph in the Guardian, there's not much progress with cars, in fact none. I would have thought they would have embraced electric cars by now, and had some incentive scheme.
-
nigelj at 06:32 AM on 17 May 2017NY Times’ Stephens can’t see the elephant in the room on climate change
Is Stephens deliberately cherry picking 2009, knowing its deceptive? Or is Stephens is so badly educated he can't even interpret trends in a simple graph? It has to be one or the other, but either demonstrate he is not fit to be an editor of an environmental science column in the media.
Maybe Trump is right, the NY Times print fake news. A prime example would be Brett Stephens with his deceptions and ignorance on emissions and warming trends.
-
JWRebel at 05:15 AM on 17 May 2017NY Times’ Stephens can’t see the elephant in the room on climate change
The continual thesis that German electrical prices are punishingly high because of the role of renewables does not stand up to examination very well. You cannot just compare the retail price of a KWh because that includes taxes and VAT. The taxes vary with the volume, and there are also often fixed or variable charges for network access affecting the price. Without a detailed comparison that breaks down all charges no apples:apples comparison is possible, and that includes comparisons to neighbouring countries.
-
nigelj at 12:42 PM on 16 May 2017Podcast on National Review & the science of climate science denial
Nice podcast. I have noticed most climate sceptics embrace or indulge in logical fallacies, and often also have vested interests, or ideological beliefs that are anti tax and anti government regulation. This appears to be the root cause that drives their climate science denialism.
Both these denialist issues, embracing logical fallacies, and being driven by strident ideology, are fundamentally lazy thinking, that is a form of anti -intellectualism and self centredness. It's little more than a shallow gut reaction. And the current White House are massive examples of all of this.
-
Glenn Tamblyn at 12:41 PM on 16 May 2017Science of Climate Change online class starting next week on Coursera
Very cool curiousd, well done.
-
John Hartz at 10:18 AM on 16 May 20172017 SkS Weekly Climate Change & Global Warming Digest #19
Links to the following articles have been or will be posted on the SkS Facebook page today:
Under Trump, inconvenient data is being sidelined by Juliet Eilperin, Politics, Washington Post, May 14, 2017
Trump Consults Fake-News Memes When Contemplating Climate-Change Policy by Eric Levitz, Daily Intelligencer, New York Magazine, May 15, 2017
No room for science in Trump administration, Opinion by Chrsitine Todd Whitman, CNN, May 15, 2017Their contents reinforce Chiskoz's commentary.
-
ghagilaris at 10:00 AM on 16 May 2017Renewables can't provide baseload power
According to these researchers, renewables can provide all electricity needs (including baseload) around the world and they have built a simulation to make the point:
Moderator Response:[GT Link activated]
-
chriskoz at 09:03 AM on 16 May 20172017 SkS Weekly Climate Change & Global Warming Digest #19
'Fake but accurate' - an interesting analysis by WP of inner workings of current White House, that I'm citing after my local paper smh.
While the analysis concerns the broader subject of WH's vulnerability to fake news and their subsequent delusional lives, the triggering fake news herein is the "impending ice age" of 1970s. That's why I'm commenting on it here.
It turns out T-man surrounded himself with all-around "yes-people", e.g. security adviser McFarland (successor of disgraced Michael Flynn) and anonymoius "official" who defended the "impending ice age" bunkum as "fake but accurate", Kellyanne Conway who allegedly hates his boss secretely, all the way to Rex Tillerson, who has to "earn his [T-man;s] confidence every day". That's, taken at face value, simply a flattery for the purpose of ingratiating oneself at all cost by Tillerson, colloquially known as "brown nosing".
Interesting to learn, that those people, who's advice and actions should bear dignity and pride and responsibility and alertness to dangers lurking upon the president and the nation, have lost all of such qualities, replaced by unqualified flattery. The actions of the flattery are as ridiculous as shown, because the boss who receives the flattery (T-man) has the intelligence and moral development of a 6th grader juvelile, colloquially he can be called a spoiled brat. Quite remarkable that poeple can fall into the pitfalls of flattery so badly, that even a spoiled brat on the other end does not bother them.
At this point I want to draw a generalisation: the climate science denial by the GOP can be seen as its flattery towards their "bosses" who are fossil fuel magnates, just as the denial of reality by WH officials is a flattery towards T-man. GOP say only the things about climate science that FF industry wants to hear: it's plainly visible throughout.
-
Susan Anderson at 06:47 AM on 16 May 20172017 SkS Weekly Climate Change & Global Warming News Roundup #19
All kinds of riches in those links. Of particular interest were updates on the state of methane. I didn't know Arctic methane seeps could have anything to do with slowing emissions. Weird!
Also Antarctica, where there's always room to increase my knowledge.
-
curiousd at 06:40 AM on 16 May 2017Science of Climate Change online class starting next week on Coursera
I have had an exciting time, nearly a month, collaborating with David Archer in updating his "Modtran Infrared Light in the Atmosphere." I am grateful to David Archer for this opportunity. I thank the folks who contributed their feedback on this site.
We are finished updating the website for now. There is a difficult issue that remains to simmer, but do check out what has been done to date.
Some of the new results:
1. The underlying Planck distribution has been extended to encompass 2 wn to 2200 wn.
2. Now if one calls up the U.S. Standard Atmosphere, no GHG, T offset by minus 33.2 degrees to produce a surface at 255 K, whereas you used to obtain 225 w/msqd, you now obtain 233 watts/meter sqd. If you use the Stefan Boltzmann law and the emissivity of 0.98 you ger 234 watts/ meter sqd.
3. The clear sky OLR obtained by using the default GHG used to be 260 watts / meter squared. It is now 267 watts/ meter sqd. I assume an observor distance of 70 km. If the emissivity were changed to 1 from 0.98 one would obtain an OLR of 272 watts per meter sqd. The AIRS spectrometer obtains 274 wattsper meter sqd.
It is difficult for me to deduce what AIRS uses for emissivity; in actuality the Earth surfaceemissivity is a function of wave number.
4. A "Freon Scale button" has been added.
5. Now if you look downward from the Earth Surface you obtain an OLR for U.S. Standard of 382.14 watts/ meter sqd. If you use Stefan Boltzmann law assumimg emissivity one you get 391 watts/ per meter squared. Dividing 382.14/391= 0.97. This is a natural procedure a user would go through to determine the assumed emissivity of the program, if that user felt it unlikely that he/she would understand the contents of the "Show Raw Model Output" button. The procedure gives 0.97 instead of 0.98 probably because even the window between 2 wn and 2200 wn has a termination error.
The procedure described in the previous paragraph, using the old version of "Modtran Infrared Light in the Atmosphere," would yield an emissivity of 0.92, which is impossibly small.
6. The incident insolation for the Tropical setting lies between 300 watts per meter sqd and 320 watts / meter sqd. (Petty, p. 4.) This should equal the upward thermal IR power, which now is 297 watts/ meter sqd, and would convert to 306 watts per meter sqd if the emissivity were changed to one.
There is one unresolved issue. What is the best way to create a reasonable altitude versus temperature plot in the chart to the right of the plot of intensity versus wavelength? Previously the shape of such plots, given a large temperature offset of the surface, were quite complex, and based on a model that is lost in the mists of time. We believe we have some idea of a means toward creating realistic plots for positive temperature offsets, but not negative offsets. Therefore, for reasons of consistency and simplicity the assumption made for now is that both the surface and the temperature of the atmosphere are given the same offset. Changing the stratosphere temperature in this manner is more than questionable, but a suitable alternative is not obvious to us.
This issue is found in other packages. SpectralCalc simply goes to the opposite extreme so that the Earth surface offset is decoupled from the temperature of the atmosphere, and if this procedure results in a abrupt temperature discontinuity so be it.
-
Russell8621 at 06:24 AM on 16 May 2017A Perfect (Twitter) Storm
The Dilbert strip behind this furor:
https://vvattsupwiththat.blogspot.com/2017/05/why-science-journals-arent-published-in.html
-
dudo39 at 01:50 AM on 16 May 2017SkS Analogy 3 - The Greenhouse Effect is Like a Cloudy Night
KR, thats precisely my point: statisctics do not provide a solution.
As to P K Dick's quote, I may add that believing does not explain a thing in science
-
Susan Anderson at 01:33 AM on 16 May 2017Citizens’ Climate Lobby - Pushing for a price on carbon globally
"failure is an important part of innovation" (from Brookings)
-
Susan Anderson at 00:49 AM on 16 May 2017Citizens’ Climate Lobby - Pushing for a price on carbon globally
Thanks for the update and good sourcing. I appreciate the frustration with inaction and stubborn political and media resistance to facing facts, which I share. Thanks particularly for the Brookings summary.
In general, as soon as someone starts to say something along the lines of "nofink works, so why do anyfink" I tune out. It's a failure to acknowledge the problem, which is life threatening not just in the lifetimes of younger people, but in my view within the next 20 years give or take a few.
That means, even if its not working - and particularly if the only objective is that it has not been demonstrated to work yet - we need to keep trying.
Life is not something we have a choice to refuse by proxy. Proxy refusals are pretty much evasive bunk.
-
Tom Curtis at 00:39 AM on 16 May 2017Study: to beat science denial, inoculate against misinformers' tricks
karly @19:
"Nobody, ... , can produce one paper (peer-reviewed or not) that shows, unequivocally, that a reduction in CO2 lowers global temperature."
Actually, here is one by Arrhenius in 1898. He writes:
"We may now inquire how great must the variation of the carbonic acid in the atmosphere be to cause a given change of the temperature. The answer may be found by interpolation in Table VII. To facilitate such an inquiry, we may make a simple observation. If the quantity of carbonic acid decreases from 1 to 0.67, the fall of temperature is nearly the same as the increase of temperature if this quantity augments to 1.5. And to get a new increase of this order of magnitude (3°.4), it will be necessary to alter the quantity of carbonic acid till it reaches a value nearly midway between 2 and 2.5. Thus if the quantity of carbonic acid increases in geometric progression, the augmentation of the temperature will increase nearly in arithmetic progression. This rule--which naturally holds good only in the part investigated--will be useful for the following summary estimations."
Here is another by Richard Tol a century later. He writes:
"This paper demonstrates that there is a robust statistical relationship between the records of the global mean surface air temperature and the atmospheric concentration of carbon dioxide over the period 1870–1991. As such, the enhanced greenhouse effect is a plausible explanation for the observed global warming. Long term natural variability is another prime candidate for explaining the temperature rise of the last century. Analysis of natural variability from paleo-reconstructions, however, shows that human activity is so much more likely an explanation that the earlier conclusion is not refuted. But, even if one believes in large natural climatic variability, the odds are invariably in favour of the enhanced greenhouse effect. The above conclusions hold for a range of statistical models, including one that is capable of describing the stabilization of the global mean temperature from the 1940s to the 1970s onwards. This model is also shown to be otherwise statistically adequate. The estimated climate sensitivity is about 3.8 °C with a standard deviation of 0.9 °C, but depends slightly on which model is preferred and how much natural variability is allowed."
Wasn't so hard, was it.
Of course you will now reject both examples by equivocating on "unequivocal". Neither paper equivocates on their results, but you will reinterpret "show, unequivocally" to mean "provide definitive proof"; which in turn will turn out to mean that you require mathematical proof, at least for something you are disinclined to believe.
That game is, of course, massively uninteresting for those who really want their beliefs to be guided by evidence.
-
Eclectic at 22:38 PM on 15 May 2017Study: to beat science denial, inoculate against misinformers' tricks
Karly, nobody can produce one paper (peer-reviewed or not) that shows, unequivocally, that a reduction in solar output lowers global temperature.
Yet the planet is "highly likely" to cool if the sun's output reduces.
Some things simply do not need to be investigated via a scientific paper — unless one is aiming to win an Ig Nobel Prize.
-
karly at 22:27 PM on 15 May 2017Study: to beat science denial, inoculate against misinformers' tricks
I've been here before, so don't bother with the deluge of abuse. Simply provide one paprer (only one) that proves your point. Reducing CO2 levels in the atmosphere lowers global temperatures.
Moderator Response:[JH] Argumentative and repetititve.
Please note that posting comments here at SkS is a privilege, not a right. This privilege can be rescinded if the posting individual treats adherence to the Comments Policy as optional, rather than the mandatory condition of participating in this online forum.
Please take the time to review the policy and ensure future comments are in full compliance with it. Thanks for your understanding and compliance in this matter.
[DB] Given that this user has been given this same Warning previously, no further Warnings shall be given.
-
karly at 22:11 PM on 15 May 2017Study: to beat science denial, inoculate against misinformers' tricks
I can produce dozens of articles (peer-reviewed, if you insist), showing that vaccination is effective. Nobody, NOBODY, can produce one paper (peer-reviewed or not) that shows, unequivocally, that a reduction in CO2 lowers global temperature.
Moderator Response:[JH] The use of all-caps constitutes shouting and is prohibited by the SkS Comments Policy. Please read the policy and adhere to it.
-
ubrew12 at 18:05 PM on 15 May 20172017 SkS Weekly Climate Change & Global Warming Digest #19
Language matters, especially when you're trying to inform the public, who may not understand the physical underpinnings of Climate Change. For example, when they hear "Did Global Warming 'pause' during the 2000s?" they assume, even without reading further, that this was of some debate in the informed community. So, the denier claim, that there was a 'pause', is validated even from just the title. The uninformed public may not realize that any planet for whom 93% of the mass affected by Global Warming is ocean water, water that has shown only an acceleration of warming in the 2000s, cannot have sustained, in any way, a 'pause' in Global Warming. Yes, there was a 'pause' in Atmospheric warming, and it is worthy of study and debate. But there was never any indication of any 'pause' in Global Warming, at all. We all know that, the author of the 'Atlantic' article knows that, and in the interest of brevity we go along with a nomenclature that has got to be making the deniers very happy. The uninformed public doesn't know that the Atmosphere is just 1% of the 'globe' in 'global warming', and they are taking titles like that at face value, unfortunately. How do you spend that much time and words battling over a 'pause' in Global Warming, for a decade during which Global Warming accelerated? By misplacing the Earth, it would seem.
-
sauerj at 13:29 PM on 15 May 2017Citizens’ Climate Lobby - Pushing for a price on carbon globally
Linked below is a very good, indepth podcast on carbon pricing policy & related subjects. It's very much worth the 40mins to listen to it! It is an open interview of two very knowledgeable & articulate people on the economics & global politics concerning climate action policies. Some of this addresses the faults of the past carbon pricing "1.0" attempts, and, looking forward, some of the reasons for a brighter outlook for a carbon tax with today's growing political & commercial voices, what they call carbon pricing "2.0". This podcast was posted on the CCL FB page a few days ago.
-
chriskoz at 13:11 PM on 15 May 20172017 SkS Weekly Climate Change & Global Warming Digest #19
nigelj@1,
The technique you're probably asking for, to determine and quanify the so called recent "slowdown" in AGW temp signal is called "change-point analysis", which does piece-wise linear function fitting to the data in order to get the optimal linear model. You obviously have to demonstrate that changes in your model be statistically significant to avoid overfitting.
Stefan from RC has done it as described here and concluded there was no statistically signifficant change in temp signal derivative since ~1970, putting to bed any serious claims of "slowdown" or "hiatus". Also, Tamino nicely explained the statistics behind this method here.Note that Stefan's article comes from Dec 2014, which is before latest monster ElNino pushed surface temps higher. Tamino's blog comes from Apr 2015: so when ElNino in question just started.
Of course, science deniers' claims have nothing to do with reality or statistical methods, so they'll continue to bang their silly "it's stopped warming..." talk no matter what.
-
sauerj at 08:22 AM on 15 May 2017Citizens’ Climate Lobby - Pushing for a price on carbon globally
Sorry! The %GDP numbers in my @5 above are wrong concerning on how much $100/UStonCO2 would be in %GDP. I mistakenly used global 40bn UStonsCO2 (wrong) & divided by $18tr US GDP (right) to calculate the incorrect 22% value. If using the correct 7.4bn UStonsCO2 & dividing by $18tr US GDP, the correct percentage is 4.1% for the 100/USton CO2 RNCFD tax rate.
Presently, energy costs are 8.8% of GDP (LINK). Therefore, the 4.1% is ~50% of current GDP energy costs. If current RE uninstalled technologies are equal to uninstalled carbon technologies (based on recent internet articles I have seen), then this $100 RNCFD tax would therefore make carbon technoloiges 50% more than RE's (12.9% GDP vs 8.8% GDP).
A 50% increase in energy cost is a fairly significant driving force so to economically justify investment infusion for R/D, RE commerical ventures, and justify both transition & conservation projects (both in the private & public sectors). If $100 RNCFD tax rate does not result in fast enough transition & reduction in discretionary consumption, then the $100 RNCFD tax rate could be increased so to accentuate the economic driving force.
-
nigelj at 07:02 AM on 15 May 20172017 SkS Weekly Climate Change & Global Warming Digest #19
I could never understand what all the fuss was about from the climate denialists over the so called pause. I'm not a climate scientist, but I'm well educated, and I recall the early IPCC reports said there would be occasional periods of about 10 years where temperatures slowed, or even declined, due to short term natural variation like el nino / la nina etc. This was in the general media as well, so nobody interested in climate can plead ignorance.
We had about 10 years of flat temperatures, entirely in line with these predictions, so I could never understand what all the fuss was about from the climate denialists.
The denialists claimed there was a 15 plus year pause, but this is a distorted, fake claim simply using the peak of the 1998 el nino as a starting point. You have to use a running trend line (or whatever the correct term is) in which case the so called pause was about 10 years or less.
I do admit temperatures were getting close to the outer limit of error bars in climate models, and another few years would have raised serious questions of what was going on, but then we had high temperatures of the last few years, which ended the pause. So the pause was within expectations and climate theory.
There may be more pauses as well, then the fools can start their chanting again, "global warming stopped in 2027 / 2047 / etc, etc.
I have read various explanations that the pause never happened, it was statistically insignificant, and / or over estimated, etc. This is true scientifically, but from a public perception point of view its probably better to acknowledge that temperatures slowed for a few years from about 2002 - 2010 (depending on what data you look at) and this is obvious looking at any temperature graph. There was a slowdown, or whatever you want to call it.
The climate denialists blew the whole thing out of proportion, probably deliberately to cause confusion and doubt. Well it's clear to me global warming has definitely not stopped. The longer term temperature trend from approx. 1900 is just looking relentless now.
-
Miguelito at 03:15 AM on 15 May 2017Citizens’ Climate Lobby - Pushing for a price on carbon globally
Gingerbaker and Richard:
Evidence suggests carbon taxes work in British Columbia, Canada.
Some targeted policies are required (fugitive emissions from wellsites and gas-infrastructure, for example), but there's little that says a carbon tax won't work as a main tool at tackling CO2 emissions.
-
HK at 01:08 AM on 15 May 2017Industrial-era ocean heat uptake has doubled since 1997
Science of Doom made a simple ocean model to test what impact a certain short wave forcing (solar) and an equal long wave forcing (infrared) had on the ocean temperature. The result was an almost identical warming from both types of forcings from the surface down to a depth of 100 metres. So, infrared back radiation can indeed warm the oceans below the skin layer, if "warming" means "raising the temperature above what it would otherwise be".
Another, and for me even more convincing argument that this must be true is a simple budget of the surface energy fluxes:
If the average surface temperature of the oceans is 290 K (17°C) and the emissivity is 0.95, the heat loss by radiation is 0.95 * 5.67*10-8 * 2904 = 381 watts/m2. If evaporation and sensible heat is included, the total heat loss increases to about 500 watts/m2.
That’s a huge problem for the "back radiation deniers" as the direct solar forcing is only 168 watts/m2 according to this source, or about 1/3 of the value required to maintain the present surface temperature. Where do the missing ~330 watts/m2 come from if not from the long wave back radiation?
Prev 417 418 419 420 421 422 423 424 425 426 427 428 429 430 431 432 Next


