


 Arguments


Recent Comments
Prev 419 420 421 422 423 424 425 426 427 428 429 430 431 432 433 434 Next
Comments 21301 to 21350:
-
michael sweet at 22:21 PM on 12 May 2017SkS Analogy 3 - The Greenhouse Effect is Like a Cloudy Night
Dudo39,
Did you read the intermediate tab at the link you were given? It states that it is difficult to exactly determine the effect of clouds. It is most likely that the effect of clouds will be a positive feedback (possibly a large positive feedback) and that it is very unlikely that there is a large negative feedback from clouds. There is a small chance that clouds have a small negative feedback. A more recent lecture is attached that I did not view but probably addresses your questions.
Overall climate feedbacks are positive. It is very unlikely that clouds will bail us out and cause warming to be small.
-
dudo39 at 13:15 PM on 12 May 2017SkS Analogy 3 - The Greenhouse Effect is Like a Cloudy Night
steveingbg, a simple mention would be sufficient for me. The link does not give a definitive statement, say as to what is the net effect, of an increase in cloud coverage, on the thermal balance of the biosphere. I would say that clouds act like a greenhouse gas by blocking infrared radiation from the earth day and night, and reflect [and block?] incoming solar radiation [during the day, of course]: the key point is to determine what is the net effect of clouds on the thermal balance....
-
Art Vandelay at 12:26 PM on 12 May 2017More errors identified in contrarian climate scientists' temperature estimates
There are errors associated with land and sst measurements too of course. In fact, a thermometer enclosed within a pseudo solar shielding box near ground level is really only a means of attaining an approximation of air temperature - because the solar shield converts some short wave radiation into LWR, and additionally, the ground and surrounding area also radiate (LWR). The consequence of this is that LWR viariables can contaminate climate data if they change over time.
-
Bob Loblaw at 08:16 AM on 12 May 2017Is the climate consensus 97%, 99.9%, or is plate tectonics a hoax?
In the case of "plate tectonics denial", if the theory of plate tectonics had said that fossil fuel extraction would cause an unheralded increase in the rate of plate movements, and this would lead to huge increases in earthquake activity and great damages to many populated areas close to fault zones (hi, California!), with huge impacts on society as me know it, would this have led to corporate funding of plate-tectonic-denial think tanks? Would companies like Exxon have invested large amounts of money to deny the science in order to protect their business, as they have with anthropogenic climate change?
Fortunately, plate tectonic theory made no such predictions, so corporate interests did not react that way, but how has the fossil fuel industry reacted to claims that fracking causes earthquakes?
-
Tom Curtis at 08:07 AM on 12 May 20172017 SkS Weekly Climate Change & Global Warming News Roundup #18
Also of interest. A significant revision of the amount of the Earth's surface covered by forest. The news article says of Professor Andrew Lowe, one of the papers authors:
'He said if the newly discovered forests are protected, they could provide information about how trees "fix" carbon, and prompt a re-evaluation of the global "carbon budget".
"We know that forests sequester huge amounts of carbon, so increasing the area of forest globally helps explain additional carbon sequestration opportunities that are available," Professor Lowe said.'
It probably will result in a reevaluation of the total carbon stored in forest systems, but is unlikely to lead to a reevaluation of the change in the amount stored IMO. That is because the later is constrained by isotope data.
-
Bob Loblaw at 08:05 AM on 12 May 2017More errors identified in contrarian climate scientists' temperature estimates
Using satellite-measured microwave radiation to try to determine atmospheric temperatures is affected by what is called "the inversion problem". I can't quickly find a definitive discussion of it, but a quick search produced this paper that mentions it in the abstract:
http://www.sciencedirect.com/science/article/pii/002240737890136X
The inversion problem can be summarized as this:
- radiation transfer theory is quite capable of taken a known set of atmospheric conditions (temperature, pressure, chemistry, etc.) and giving quite accurate estimates of the resulting radiative fluxes.
- Going the other way - taking radiation measurements and trying to use a model to determine atmospheric conditions (in this case, temperature) - is much more difficult. The problem is usually "ill-conditioned" - there are a lot of unknowns, and the model can be made to fit the measurements fairly well with a wide variety of closely-related input parameters that may or may not be known accurately.
- For example, if my model says A+B=C, and I know A and B, it is easy to estimate C. On the other hand, if I measure C and don't know much about A and B, then it's really hard to say I know B with certainty. If B is what I am interested in, and I can find an independent way to know or estimate what A is, then I can learn about B by measuring C, but my estimate of B is highly dependent on how well I do with A.
All the "corrections" to Spencer and Christy's results over time can be described as modified attempts to constrain the results based on improved understanding of either the models or the approximations needed to overcome the inversion problem. Spencer and Christy's track record - of having others find problems that need fixing - does not do them a lot of credit. Follow the link to the Grauniad's story to see the graph of Spencer and Christy's sequence of corrections to their work.
-
JWRebel at 07:23 AM on 12 May 2017More errors identified in contrarian climate scientists' temperature estimates
The most important point about the satellite data is that it is an attempt to model atmospheric temperatures. Once fully mature, this would be an invaluable tool to model temperatures throughout all strata of the atmosphere. Like all complex modeling, there is always room for incremental improvements on the basis of advances in the data and theoretical insights.
The opposition often articulated between climate models and "the satellite data" completely skips the problem that all "raw" data must be integrated and interpreted within a framework (model) to tell us anything useful.
-
scaddenp at 07:20 AM on 12 May 2017Industrial-era ocean heat uptake has doubled since 1997
Eclectic - CC was just repeating a common myth. This states that only visible-wavelength radiation penetrates into sea (as you state), but infrared only penetrates a millimetre if that. Ergo, increasing infrared cannot heat the ocean. This is a fallacy, missing the full nature of energy interactions in the system. CC was pointed to resources explaining it but appears to be incapable of comprehending any experimentally proved physics which undermines his/her cherished position. Once someone prefers their misinterpretation to observational evidence, there is little point in further discussion.
-
Tom Curtis at 00:32 AM on 12 May 20172017 SkS Weekly Climate Change & Global Warming News Roundup #18
Here is a new CSIRO techonology that could be a game changer for emission free transport. Essentially the technology splits hydrogen of from ammonia. That means renewable energy can be used to extract nitrogen from the air, and hydrogen from water, combining the two to make ammonia. Ammonia can then be used as a liquid (and hence easy to transport and store) fuel. Finally, this technology would allow the hydrogen to be split of and burnt as fuel, leaving emissions of N2 and H2O rather than the NO2 and H2O which would result from burning the ammonia. Needless to say, NO2 is a powerful greenhouse gas.
-
Eclectic at 17:59 PM on 11 May 2017Industrial-era ocean heat uptake has doubled since 1997
ConcernedCitizen @11
You overlook one point.
Heat from the sun arrives mostly as visible-wavelength radiation (colloquially called "light").
As a scuba-diver, I can assure you that this radiation penetrates well down into the sea-water.
Could this account for the ocean heat uptake?
Moderator Response:[DB] The user in question has recused themselves from further participation in this venue.
-
ConcernedCitizen at 17:40 PM on 11 May 2017Industrial-era ocean heat uptake has doubled since 1997
You have all missed the point. The IPCC uses the term "Ocean heat uptake" to account for the difference between ECS and TCR. This is in respect of CO2.
This is reflected in such statements as"90% of global warming is going into the ocean"
If "global warming" is the energy from CO2, then clearly this is impossible since the energy from CO2 penetrates ~0.006 cm of the ocean skin (this is well known physics).
The only action, as measured by the SAGE COARE experiments) is a resopnse a few CM deeper which is due to retained shortwave. This was in any case tiny, something like 0.02C per 100 wm^-2 increase in LW.
So what is the response to increased LW? The oceans retain a tiny amount of heat from SW. This reduces sensible heat flux from the ocean to the air while the ocean is warming.
Once warming stabilises and sensible heat flux is restored the air assumes its correct temperature.
This is the only way in which the air temperature increase can be delayed, but it isnt by ocean heat uptake, since the flow of energy is not into the ocean, thus the IPCCs explanation for the terms ECS and TCR is fundamentally wrong.
As for HKs comments, you can't balance ocean heat flux in a 24 hour time frame. Turbulent mixing, ie the near dissapearance of the cool layer, happens only at wind speeds. However such wind speeds also increase evaporation, so even if the cool layer shrinks from 0.5 mm to 0.05 I would expect and absorbed LW to be lost immediately in latentent heat flux. If anyone has any data similar to SAGE COARE for higher wind speeds it wold confirm this.
Moderator Response:[DB] "it isnt by ocean heat uptake, since the flow of energy is not into the ocean"
Incorrect. You have been advised of this fallacy on your part multiple times, including multiple interventions by the moderation staff. Given that you are here to simply prosecute an agenda of ideology and not to further your understanding of the science in question, you will be given no further opportunities to waste the time of others in this venue.
-
Eclectic at 15:22 PM on 11 May 2017Study: to beat science denial, inoculate against misinformers' tricks
Haze, have a closer look at Curry's blog.
She posts her own reflections on climate matters, plus some selected scientific studies (with spin), plus some articles containing nonsense — these articles she says she includes because they are "interesting" but she distances herself from the idea that she might be endorsing them. Go figure !!
The comments columns have much nonsense in them : the attraction here is for deniers who are wishing to vent, but do not wish to associate with the vitriolic morons as found at WUWT etc.
There are few (if any!) other such denier-oriented websites, where the more genteel deniers can have their say in congenial company. That, I suspect, is one of the great attractions of the Curry blog.
-
Susan Anderson at 14:15 PM on 11 May 20172017 SkS Weekly Climate Change & Global Warming News Roundup #18
Tom Curtis@23, final bit about models, that is very helpful. Thanks. I get a bit cross-eyed at times with all the technical material, since a real layperson has to figure out what to believe and sciencey arguments are all over the place. It's also one of the few times I've seen falsifiability mentioned where it isn't used to obfuscate, show off, or go off on a complicated tangent with some group that really wants to focus on the philosophical side.
-
scaddenp at 13:45 PM on 11 May 20172017 SkS Weekly Climate Change & Global Warming News Roundup #18
Wonder how a civil engineer would like rejection of a project proposal with objections like:
"Your design uses concrete and I bet that was pushed on you by all those concrete firms who will make money if we accept it".
"I havent the faintest idea how you can assess the strength with all those different materials being used so your factor of safety must be wrong."
"I've heard steel goes runny 50 years and I you havent accounted for that".
-
nigelj at 13:28 PM on 11 May 20172017 SkS Weekly Climate Change & Global Warming News Roundup #18
SkepticalCivil Engineer @24
I don't see how loss of jobs to countries with low environmental standards or poor labour laws relates to climate science, or in some way reduces the need to reduce emissions. It's a political and economic issue, and remember while globalisation has some problems as you mention, it has provably bought many benefits. It's just a whole entirely different issue needing resolving separately from the climate issue.
I also dont believe anyone has ever claimed climate models are perfect or perfectly account for every possible variable. I mean its just a strawman claim. All predictions have error bars that reflect the uncertainties that are around exact climate sensitivity and various regional factors. However climate science is highly certain CO2 is the main cause, and has ruled out solar changes and the like.
The real test of any model or theory is predictive ability, and the models have done well so far as below. The fact the models are doing well is proof the uncertainties you claim exist are not significant enough to undermine the models. Im a lay person with a very decent education, and I take nothing for granted, but I just think the evidence we are altering the climate and are the most dominant cause by far is now overwhelming.
-
scaddenp at 13:06 PM on 11 May 20172017 SkS Weekly Climate Change & Global Warming News Roundup #18
Can I also recommend "The big picture" for fast look at the problem. Note also that we can measure the increase in surface irradiation from CO2. The ocean heat content is way to estimate the radiative imbalance.

The surface temperature rise and heating is what we expect from the net forcing (sum of all the things positive/negative affecting the energy balance). If you dont want to accept GHG warming, what do you propose happens to the irradiation of the surface? Hopefully you are not a conservation of energy denier.
-
scaddenp at 12:52 PM on 11 May 20172017 SkS Weekly Climate Change & Global Warming News Roundup #18
SCE - I struggle with the apparent logic "I suspect the motives of some countries therefore the scientists in all countries are wrong". This motive-based style of reasoning is an appalling way to assess the validity of science. Please to spend some time on this site so you are not working from such a terribly low base of understanding.
And frankly the diagnosis of where the "push" is coming from is based on what information? So far you seem to be relying on appallingly inaccurate source of information on which to base your opinions. Looking at Paris and earlier conferences, I would say the most desparate push is coming from countries most affected - but as I say, this is largely irrelevant to the science. USA, Europe, Japan would be the biggest contributors to our science.
Just because you dont know something does that mean noone does? The models dont attempt to predict weather, are poor at regional prediction and have no skill at even decadal level prediction. However, they are very good at studying the energy balance on earth which is what ultimately determines climate.
It seems you are also still stuck in the notion that AGW is somehow all climate models. Why not look at all the other ways of investigation (eg the first few chapters of the WG1).
Instead of look for a blog commentator response on the models, why not just read the chapter in the AG5?
If you want to propose some alternative to current theory, then you need an alternative source of energy to be heating the earth. With solar flat or down, Milankovich going negative, its a tough job. Try spending some time with the "Climate changed before" myth (top left). The Arguments button, taxonomy is also a very good way to navigate this site and get answers to questions.
On the other hand, if your skepticism is motivated by ideology or group identity, I very much doubt that anything you read here will change your mind. Can I suggest that in advance you think hard about what is the data that would convince you when examining an aspect of the science? It is the standard scientific way of overcoming our biases.
-
Haze at 12:02 PM on 11 May 2017Study: to beat science denial, inoculate against misinformers' tricks
I just watched the video clip featuring Bill Nye the science guy. No doubt amusing to some but giving entirely the wrong message. Look for yourselves. The"denier" is asked why he denies climate change and gives a concise, clear, straightforward and readily understandable answer "the science isn't in yet". John Oliver then turns to the "climate scientists" who produce a babble of sound in which nothing can be distiguished. How does this help their cause? Humorus? Debatable. Informative? Definitely not
A significant sentence in the piece under discussion is " I asked lead author John Cook how these findings can be implemented in the real world where misinformation about subjects like climate science and vaccines is pervasive."
The primary interest of the MSM is earning money by selling advertising everything else is secondary. A piece headlined "Climate Change is a Scam" attracts heaps of interest. All the WUWT and JoNova readers say "Yeah bro, right on!" while the readers of Real Climate and Skeptical Science "No way bro, the evidence shows that that ain't so". This sells papers and/or attracts viewers but above all gets publicity which attracts advertisers.
And on a slightly different tack, I agree that JoNova and WUWT are attractive to the wider community as their content makes little demand on the intellect. That however is not the case with Judith Curry's "Climate etc" so why does it garner so many comments?
-
Susan Anderson at 11:39 AM on 11 May 2017SkS Team - Marching for Science around the globe
Terrific! Good signs too. Thanks.
-
SkepticalCivilEngineer at 10:52 AM on 11 May 20172017 SkS Weekly Climate Change & Global Warming News Roundup #18
scaddenp @22 & Tom Curtis @23
One of the reasons why I posted here is because I am not a climate scientist and welcome the insight that I might find on this site. I have tried not jump to any unwaranted conclusions but see the big push for alternative energy comming from the same industrial countries that have a reputation for having weak environmental standards themselves. Those lower standards and higher profit margins is one of the many reasons why production in the United States has moved overseas.
In response to the statement: "Those, in contrast, who reject models are really insisting that their theories should be allowed to remain vague, and prediction free" : I'm not sure how to go about realistically building a model that incorperates all the changes to coastal lands over the centuries and what effect that might have had on weather patterns, cloud cover, the ocean's temperature, and the planet as a whole. I don't think that allows my theory to remain vague, and prediction free, it just makes me a skeptic of the models that are presented as though they account for everything. I am still asking the question what don't we know and how much of that unkown is causing the problem. What do the models not account for what assumptions do they make? There is Warming, the planet is changing again, it has changed before. Is CO2 the only reason?
-
Tom Curtis at 08:08 AM on 11 May 20172017 SkS Weekly Climate Change & Global Warming News Roundup #18
SkepticalCivilEngineer @21:
1) The most commonly cited source of CO2 concentration data is the Mauna Loa station, which is on top of a very tall mountain in the middle of the Pacific. However, that is not the only remote station detecting CO2 concentrations. Here are the locations of various CO2 concentration data stations:
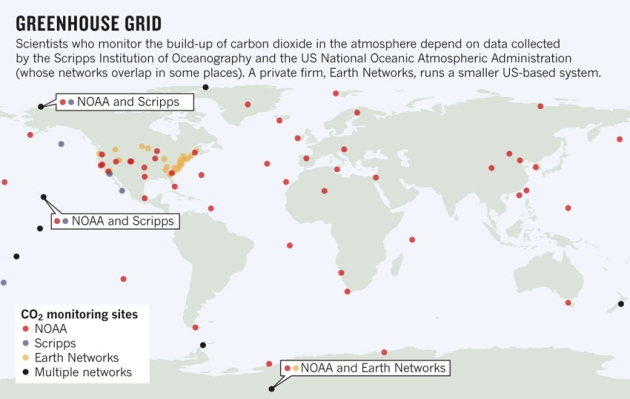
As you can see, they are overwhelmingly from remote locations, and the ones commonly cited (those in black, plus Cape Grimm, the CSIRO station in Tasmania) are all remote. There are also multiple partially overlaping CO2 records from ice cores. The records from a significant proportion (possibly all) of those CO2 recording stations, plus four ice cores are shown in the famous pump handle video. If you want data from approximately the same location, just compare the four ice core records shown, which are all from Antarctica, with the South Pole data.
2) The change in carbon stores in various reservoirs was shown by the IPCC AR5 in this diagram:
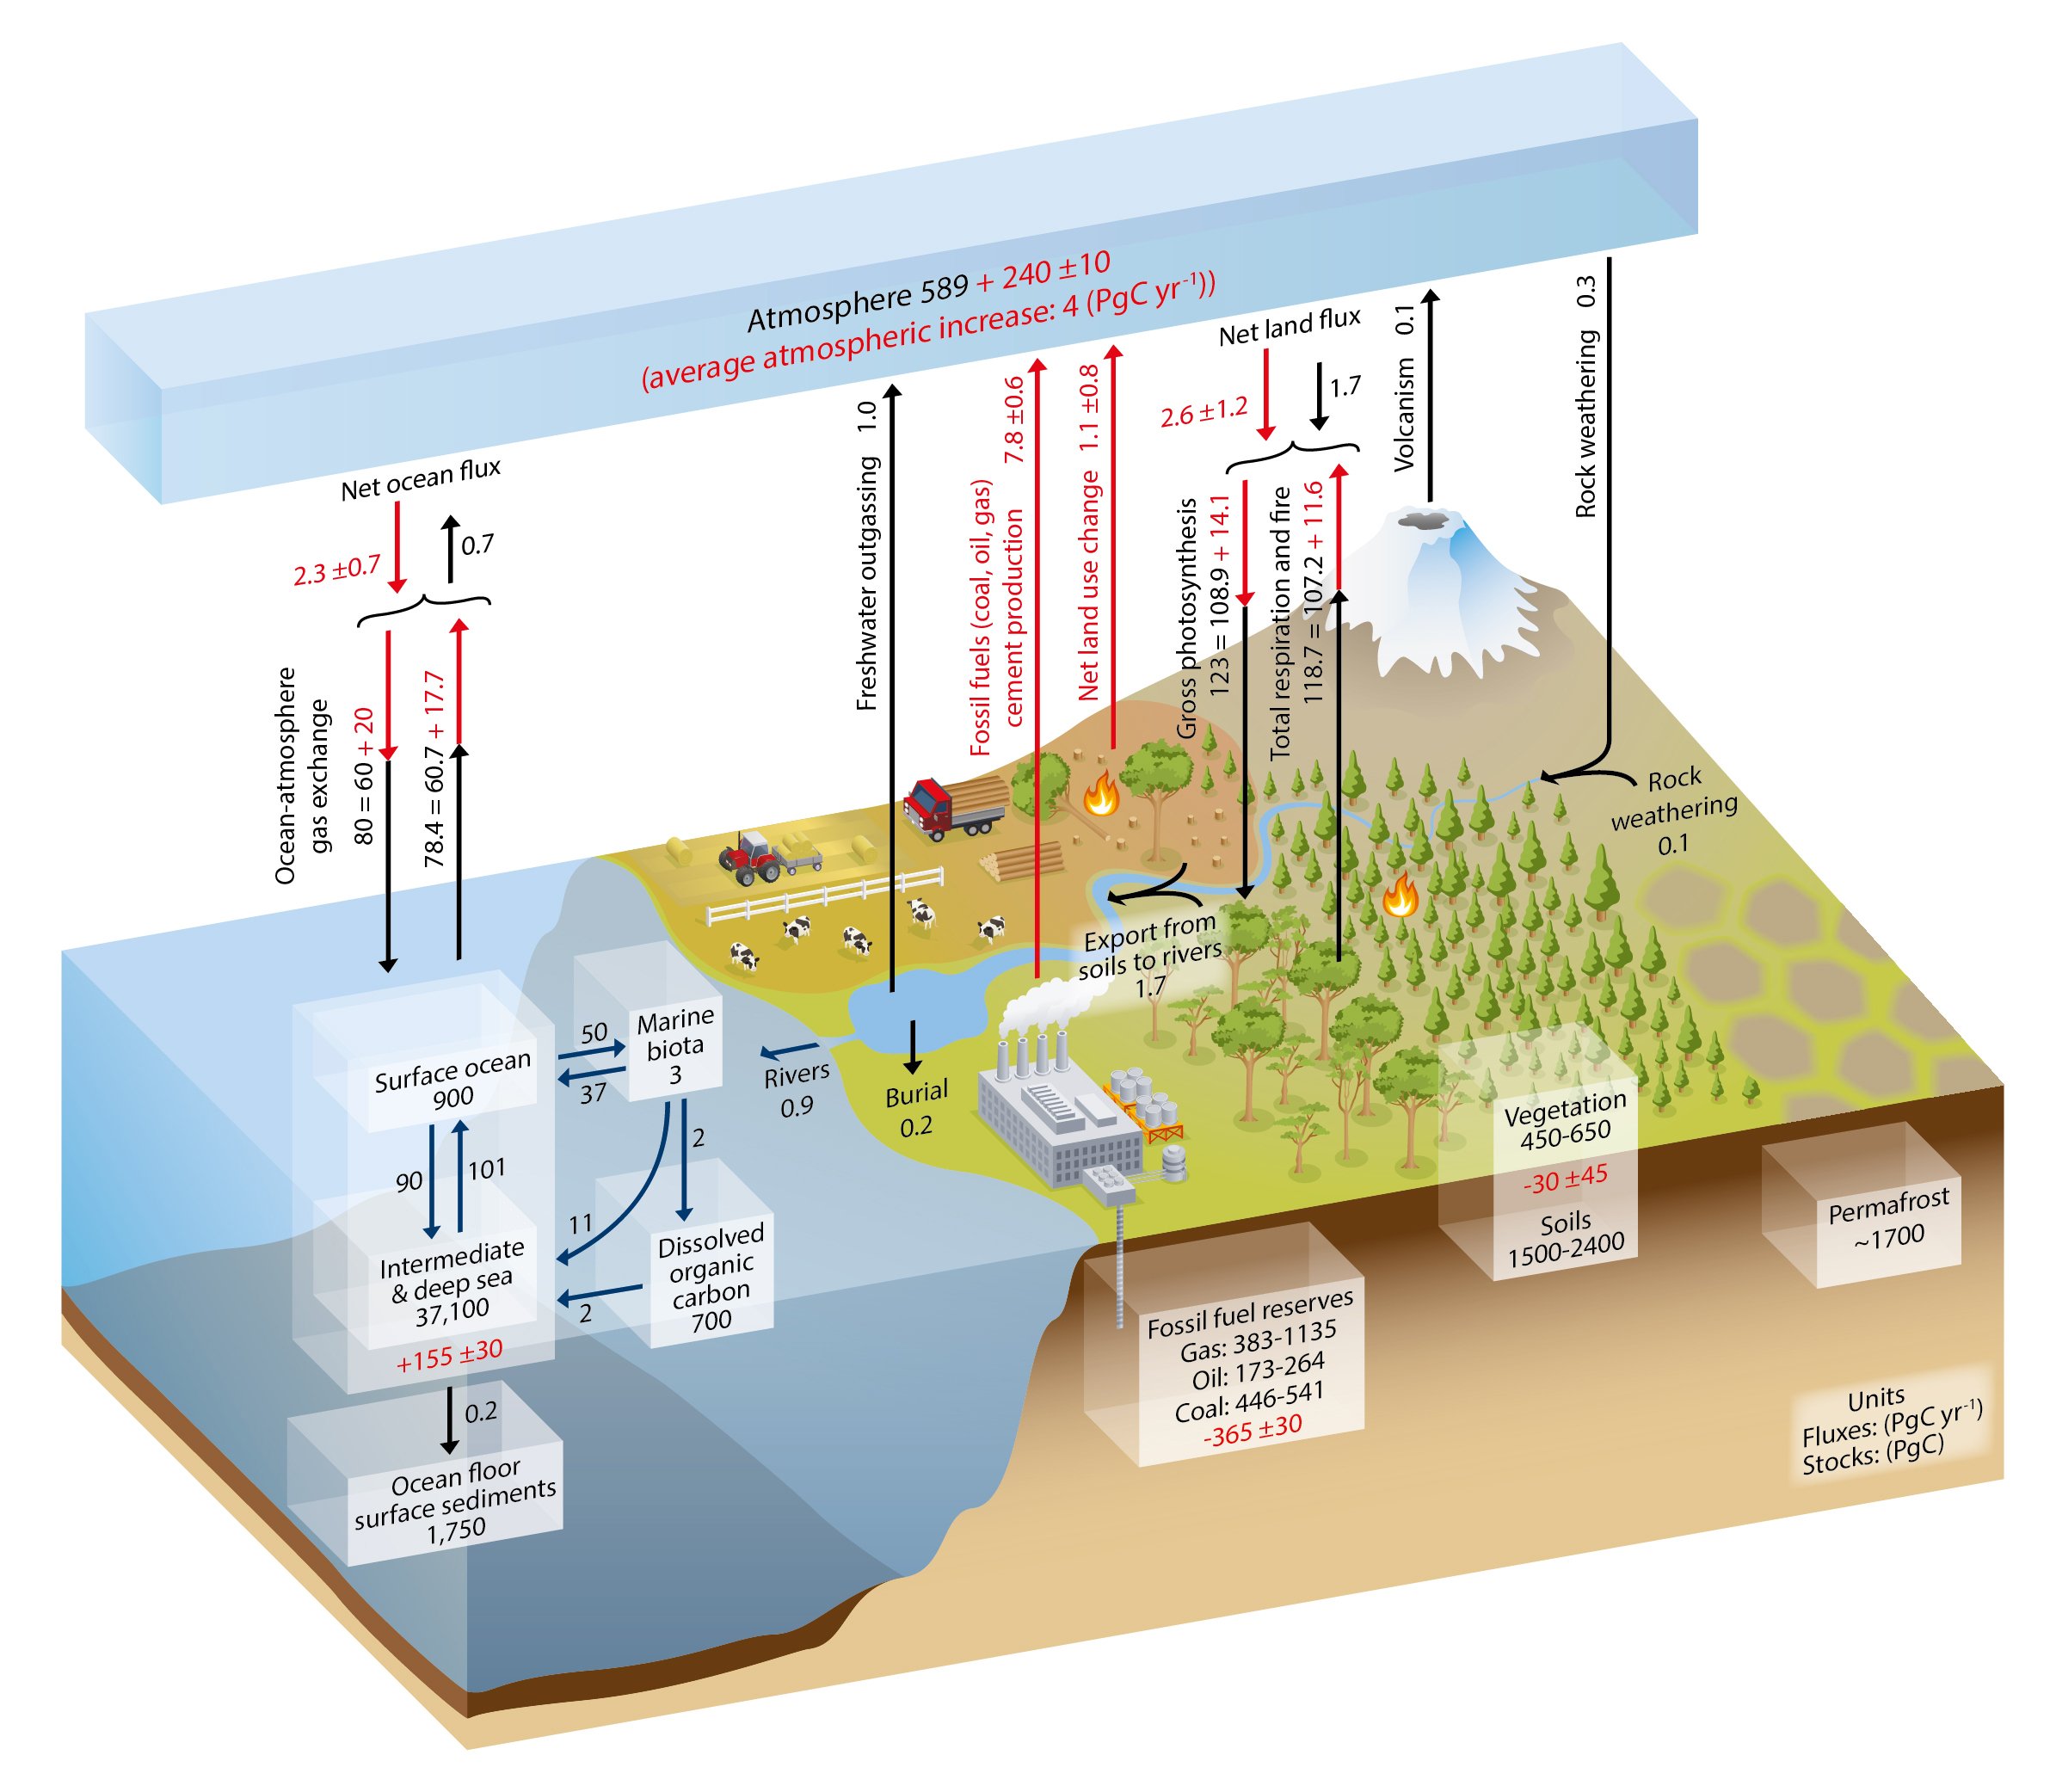
This data was determined by a combination of direct observation and counting of inventories, and cross checked by isotope data. For this discussion, the important thing is that the amount of the increase in the atmosphere (240 PgC) represents 57% of the industrial emissions, ie, emissions from fossil fuels and cement manufacture:

It follows that the 155 PgC increase in the oceans represents 37% of that increase. There is just no plausible scenario in which nearly 37% of our oil and gas production has been lost as fats, oils, and greases washed into the ocean. That is quite apart from the fact that oils, fats and greases are largely insoluble so that in water, they eventully (after their surface scum is broken up), form insoluble sludges gathered in low points in the ocean.
Most fertilizers are nitrogen based rather than carbon based, and do not enter into the equation at all.
3)
"My therory to this question is that because the cost to fix these problems will be borne by the wealthiest 2% of people who are the land owners and future land developers. It is much easier for them to sell electric cars for a profit then invest in groundwater replenishment systems which have no profit other than environmental."
I will note, firstly, that that theory is a conspiracy theory, and needs to meet a very high evidentiary bar before we would trust it; and that climate scientists are not paid sufficiently highly to be in that 2%, or anywhere close. Nor do they typically profit from sales of electric cars or solar panels (although some may have individual small investments in that area). Given that the people warning us of the danger are not in the group you say are running the scam, your theory falls at the first hurdle.
4)
You are correct that models are not evidence. This is a point I wish was made much clearer, and it is a genuine ground of criticism of climate scientists that they are not clearer on this point. What climate models are is algorithms that predict the consequences of changes in atmospheric composition given our best current theories on radiation, energy transfer, conservation of momentum etc. More correctly, they provide approximate predictions because, due to limits of computation, they must approximate based on average responses across fairly large scale cells. Further, as the best way to make those approximations is not known, the prediction is best considered to be the mean of the predictions of the various methods tried (ie, the ensemble mean).
We need models to make more than very rough predictions about what would happen given a particular increase in GHG concentrations, or solar forcing, etc. Without models, the falsifiable content of climate science would be very small, and limited to general claims about rising temperatures plus a few other things. With models, the falsifiable content is greatly enlarged.
Two things are important about this. First, when somebody says, "climate models are evidence that XYZ", they should really be saying, "our best theories predict that XYZ". That is still important knowledge, because it means the evidence behind those best theories (which is very substantial) also combines to predict XYZ.
Second, if you don't have a climate model of your theory, your not even in the science game when it comes to climate science. It means you have not expanded on your theory sufficiently to generate predictions that can be compared with reality. Unless your disagreement with climate science is very particular, on a subtle point; where the predictions can be checked without reference to a full model, your not even doing science (or at best, your alternative climate science is as undeveloped as standard climate science was at that and the end of the 19th century).
Paradoxically, this means the use of climate models represents a strong commitment to empiricism. It is an attempt to expand the types of data which can be used to falsify the theory, and to narrow the range of values within that data which will falsify the theory. Those, in contrast, who reject models are really insisting that their theories should be allowed to remain vague, and prediction free (ie, not science at all).
-
scaddenp at 07:41 AM on 11 May 20172017 SkS Weekly Climate Change & Global Warming News Roundup #18
SCE - tried looking for some answers by say reading the IPCC WG1 report? Or even the summary for policy makers?
"Much of the climate change debate" - not much "debate" in published science - only attempts to seed doubt by misinformation sources.
"usually in favor of spending money" - when facing a potential threat what do you expect peoples response to be? The belief that scientists must be motivated by some money-making scheme appears to be a case of projection to me. Where do you see the science being influenced by money?
"keep hearing about these glacial air bubbles that show CO2 levels increasing by 50% in the last 65 years." Wonder where you "keep hearing" that? CO2 levels are measured directly at multiple stations all round the globe - the continuous Mauna loa record goes back to 1958 - spot measurements much longer. Ice core is a way to extend that record back nearly 800,000 years and funnily enough most ice cores are from Greenland or Antarctic. Furthermore cores from diametrically opposite position deliver the same gas composition record.
Again if you read the IPCC report you would find the numerous papers that have quantified the effect of land-use change and it contribution to AGW. (small, negative, but not insignificant compared to GHG).
Does it seem to fair to you that the cost of fixing the problem should by borne by those who created the problem? If you dont fix it, then those who have contributed the least to problem are those who will bear brunt of its effects. (eg see here).
"A mathmatical model is not evidence of anything unless all the assumptions made are correct and the parameters can be measured and predicted with 100% accuracy." No parameter can be measured with 100% accuracy but yet we find mathematical models in physics extremely useful. The modern world relies on them every single day.
However, GCMs are not proof of climate theory, but they are the best we have for predicting what the consequences of various policy options will be - far ahead of examining entrails or assuming nothing will change. The question to ask is "are they skillful at predicting climate - ie the the 30 year average" and yes they are - remarkably so.
I can suggest you do a lot more reading of the actual science before leaping to unwarrented conclusions.
-
nigelj at 07:24 AM on 11 May 2017Study: to beat science denial, inoculate against misinformers' tricks
Why do certain climate denialist websites get a lot of posts? One reason is they often publish quite provocatively worded articles. It's human nature to be attracted to that sort of rhetoric.
But writing very provocative or even outrageous or "alternative" facts, and getting some readers, doesn't make them true.
I think genuine research scientists and websites like this have to be careful not to get fooled into descending to the same low, inflammatory level, although its still good to have some colour and be prepared to be angry occasionally, if an issue really deserves this
Like M Sweet says, denialist websites also allow people to get away with obvious non scientific, or generally irrational rubbish (or things with a grain of truth that are then twisted into more than they really are). Its a place for the children to play, without fear of being genuinely scrutinised or having to admit they made an error.
But people tire of this garbage eventually. We all like reading conspiracy theories a bit, but they get tiresome very fast, and we want the facts from real scientists doing the research.
-
Tadaaa at 06:41 AM on 11 May 2017Study: to beat science denial, inoculate against misinformers' tricks
the trick is to be wise to their tactics
all the top denier points are effective because they have a kernal of truth
by that I mean, they are in themselves true statements - hence can be defended
but in reality red herrings and irrelevant
so we have - C02 is a traces gas, the climate has always changes, no rise in temps for XX years
all "true", but irrelevant to the science of AGW
I was at a dinner party the other day when this subject was briefly discussed, one guest brought up the "pause" meme
i immediatly shot back with - "why do you expect tempuratures to go up in straight lines"
march and be colder than feb or Jan, April can be colder than Feb, but July (volcano eruptions apart) will always be warmer than Jan, Feb or March
"tempuratures do not go up in straight lines - it would actually be odd if the did"
you could see the cogs in his brain wirring - then he changed the subject
-
SkepticalCivilEngineer at 05:16 AM on 11 May 20172017 SkS Weekly Climate Change & Global Warming News Roundup #18
My first post is skeptical.
Much of the climate change debate is wheather man made CO2 is the main culprit for rising tides, melting glaceres, and higher acidity in the ocean. Coincidentally proponents of this cheering squad are usually in favor of spending money on new electrical cars, new solar pannels, and alternative energies. This changing of the energy guard ushers in new money and new profits. Unfortunately I believe their arguments are more about the money than the environment. Furthermore I don't believe they really seem cite specific sientific evidence.
For example I keep hearing about these glacial air bubbles that show CO2 levels increasing by 50% in the last 65 years. What is not clear about this information is how many data sets are there that show this phenominon and is the air trapped in the bubbles being compared to air at the same location today on a really good air quality day or a particularly bad air quality day.....or is it being compared to air above a poluted city like Beijing China? The air bubble arguments just seem very lacking to me right now..... I vow to look more at this evidence.
Whcih brings me to what concerns me. Why aren't more people talking about the changes in coastal lands and metropolitan areas have undergone in the last 2 centuries? California's Central valley used to be a swamp until it was dredged and sent out to the ocean. All the water that used to rain on the LA basin used to be absorbed into the ground. Now becasue of farming, manmade development, impervious hardscapeing, and storm facilities much more rain water water goes directy into the ocean than ever before in history. That rain water takes with it the fats, oils, greases, and fertalizers that might also be the cause the higher acidity in the oceans. This has happend in costal lands and metropolitan areas all over the world. Why isn't man made develoment, farming hydromodifcation, and storm water facilities given more of the blame for global warming?
My therory to this question is that because the cost to fix these problems will be borne by the wealthiest 2% of people who are the land owners and future land developers. It is much easier for them to sell electric cars for a profit then invest in groundwater replenishment systems which have no profit other than environmental.
I would like to finish this comment by making a statment about climate change models . A mathmatical model is not evidence of anything unless all the assumptions made are correct and the parameters can be measured and predicted with 100% accuracy. I don't see how this is possible with any climate model predicting weather, cloud patterns, development, and other naturally occuring phenominons that have changed the earth many times in the past.
When someone says the model predicts "such and such" I immedeatly want to ask does the model take into account
"this, this, this, and this?" -
Evan at 00:04 AM on 11 May 2017SkS Analogy 3 - The Greenhouse Effect is Like a Cloudy Night
ubrew12, interesting story and comment. Whereas UV blocker actually does block UV rays from reaching us, I think you will agree that what you mean by "block" was the tree returning as much infrared radiation to you as you were sending to it. I know this is a subtle point, but it will help people understand what controls climate change to understand that what is often viewed as "static" is really a game of give-and-take that is in balance. If you get as much as you give, the system appears to be static. Sit under a tree or out under the stars and you are giving up the same amount of infrared radiation, but under the stars you are getting much less in return than the trees have to offer.
-
ubrew12 at 23:36 PM on 10 May 2017SkS Analogy 3 - The Greenhouse Effect is Like a Cloudy Night
I used to backpack in the Sierra Nevada mountains. In the summer on cloudless nights, above 9,000 ft, it was definitely more comfortable to sleep next to a tree rather than out in the open, even if it somewhat robbed your view of the amazing stars. The tree served as an infrared blocker, and definitely kept me warm and cozy compared to lying out exposed under the stars.
-
Evan at 23:18 PM on 10 May 2017SkS Analogy 3 - The Greenhouse Effect is Like a Cloudy Night
The point of the analogy is to illustrate the greenhouse effect, which is a process whereby infrared radiation is trapped by greenhouse gases. The greenhouse effect can therefore be seen more clearly at night in the absence of the sun, when only infrared radiation is acting. There is no intention of minimizing the importance of clouds during the day. It was just not the point of the analogy.
-
steveingbg at 23:16 PM on 10 May 2017SkS Analogy 3 - The Greenhouse Effect is Like a Cloudy Night
dudo39, the article is an analogy about how the greenhouse effect acts similarly to clouds at night; it is not a treatise on the overall effect of clouds. SkS has addressed that topic as well: www.skepticalscience.com/clouds-negative-feedback.htm.
-
dudo39 at 22:56 PM on 10 May 2017SkS Analogy 3 - The Greenhouse Effect is Like a Cloudy Night
Re Elevator Statement: It is very convenient, but rather misleading, not to address the effect of clouds during daylight, only 50% of the time!
GET SERIOUS!
Moderator Response:[JH] Please keep it civil and do not shout at others by using all-caps.
The use of all-caps is prohibited by the SkS Comments Policy. Please read the policy and adhere to it.
-
michael sweet at 20:31 PM on 10 May 2017Study: to beat science denial, inoculate against misinformers' tricks
Haze,
I have been reading here for many years. When I first started there were long debates over the data. Skeptics would challenge the scientific viewpoint. As time passed and more convincing data became available it has become impossible for anyone who looks at the data to argue that AGW is not occuring. A few people still challenge the degree of warming, but even there the data is clear that the expected rise in tmeperature is alarming.
At the other sites you mention they develop stories that are not supported by data so that they can continue to argue. DeanMJackson is typical of recent septics who post here and would fail my High School Chemistry class because they know nothing about data or science. Should we mourn the lack of ignorant rants here?
There are a few commentators here now (especially Tom Curtis) who post very strong, data based answers. Deniers have found it impossible to respond to the data. They go elsewhere to engage in their fantasies. Even JoNova and Curry have been unable to argue with the data and scientific explainations posted here. I used to post a lot but now I rarely post because the answers already here are so strong. Should WUWT get credit for more posts when most of them are fantasy?
-
scaddenp at 19:49 PM on 10 May 2017Study: to beat science denial, inoculate against misinformers' tricks
Haze - this site is to discuss science and you do that by backing your argument with references and data. The "heavily moderated" ones either dont do that or are uninterested in holding a discussion in a civil way which is what the comments policy is trying to engender. Got an example of a commenter that you think hard done by who was conforming to policy?
This site is not in some competition for number of commentators. The traffic stats suggest most visitors dont. It is meant as a resource for those wanting to find out what the science actually says. People who want to have an illiterate rant are well catered for elsewhere. -
Eclectic at 18:04 PM on 10 May 2017Study: to beat science denial, inoculate against misinformers' tricks
Haze @9 : what methods are you suggesting, to capture (and maintain) the professional interest of journalists and editors?
JoNova and WUWT websites' comments columns are filled with toxic vitriolic and angry comments, because that is where angry deniers go to vent their anger. They are angry people — not especially about AGW — but the AGW topic is a useful and available lightning-rod for them to express their anger about how life in general is going (and all the changes they see happening in society). As well as venting public shouts of tribal loyalty.
We would hope that journalists and editors are mostly motivated by other considerations. And something else again, applies to the Murdoch media, unfortunately !
-
Haze at 16:18 PM on 10 May 2017Study: to beat science denial, inoculate against misinformers' tricks
I wonder why sites such as this and Real Climate and Open Mind attract such relatively few commenters compared with sites such as JoNova and WUWT and Climate etc.
SkepticalScience has the headline "Explaining climate change science & rebutting global warming misinformation" But to whom are these explanations and rebuttals being made?
Commenters here are all, well virtually all, entirely convinced humans are 100% responsible for climate change and don't require any explanations or rebuttals. From time to time a denier will post but usually that post is heaviy moderated and the commenters here will rail mightily against such unwarranted and unwelcome intrusion to "their site"
Perhaps the MSM find that if they print, publish, broadcast just the pro-AGW view very few people are interested just as many fewer people are interested in sites such as Real Climate and Skeptical Science than are interested in JoNova and Climate etc. Perhaps if AGW proponents could create as much public interest in their views as the deniers manage to create in theirs, the MSM might have a higher pro-AGW /denier ratio than currently is the case.
Moderator Response:[JH] The number of comments garnered by a website does not necessarily reflect the number of people visiting a website and using the materials posted on it. Re SkS specifically, we provide the ammunition (rebuttal articles) for others to use.
-
chriskoz at 14:53 PM on 10 May 2017Study: to beat science denial, inoculate against misinformers' tricks
[JH] @6 (inset)
Does it mean that Deniersville is interested in commenting on (i.e. denying) "Global Warming" but they don't care about "Climate Change"?
As you can find in Global warming vs climate change, "Climate Change" was always the prefered scientific term by a large margin, according to google scholar. Even in popular literature, according to google books, "Climate Change" is still prefered although by small margin and was less popular only briefly in mod-1990.
So, deniers don't really know the preffered name of the phenomenon they're trying to deny? Will they ever "catch up"?
Moderator Response:[JH] I suspect that the folk in Deniersville tend to use "Global Warming" more than "Climate Change" because they love to accuse climate scientists and people who accept the overwhelming body of scientific evidence about manmade climate change to be promotors of "CAGW" (Catastrophic Anthropogenic Global Warming). They have convinced themselves that "CAGW" is a derogatory label that demeans the credibility of anyone it is applied to. In contrast, the acronym "CACC" (Catastrophic Anthropogenic Climate Change) just doesn't have the same sex appeal and name recognition as "CAGW". Likewise, the acronym “AGW” versus “ACC”.
-
nigelj at 07:07 AM on 10 May 2017Study: to beat science denial, inoculate against misinformers' tricks
I agree the best way to convince sceptics is certainly to talk about the very solid evidence for the greenhouse effect, as this is the foundation of the whole climate issue.
But I suggest also show them a big, simple graph of declining solar irradiance over the last 50 years. This shows solar energy is unlikely to be a cause of climate change, and covers the main point sceptics raise, weak though it is.
Maybe the important thing is to keep things simple. People relate to simple explanations and graphs or pictures, better than lengthy detail or complex equations, and even well educated people forget details of school or university physics unless they use it in their job every day.
It's also people of average education that dominate the ranks of sceptics. While I'm no fan of Trump and his multiple crazy ideas, he is a good communicator by keeping things simple.
I'm no climate scientist and work in a design field, but I read a lot of popular science publications out of interest and have a very broad tertiary level education. Sadly the only reading a lot of people do these days is facebook, or the life and times of Kim Kardashian.
I realise you can't over simplify some things as well, and some people do respond well to more detailed discussion.
-
dr_who1379 at 23:04 PM on 9 May 2017Study: to beat science denial, inoculate against misinformers' tricks
My Google News Alert has gone from articles about climate science to about half climate science denial. Sad really.
The feedback loops that we have already triggered (many were triggered years ago), will give all of us a front row seat of interesting events that have already started---which we hardly notice, really.
Moderator Response:[JH] The Google News Alert for "Global Warming" does contain many articles from Deniersville. On the other hand, the Google News Alert for "Climate Change" contains only a few. It appears that the the term, "Global Warming" is preferred over "Climate Change" in Deniersville - which is kind of funny when you think about it.
-
BBHY at 20:49 PM on 9 May 2017Study: to beat science denial, inoculate against misinformers' tricks
My best success talking with skeptics/deniers is when I go way back to the very, very basics.
1) CO2 absorbs infrared heat. That is a rock solid proven fact that was established over 150 years ago and has been proven over and over ever since.
2) When you add black ink to white paint it makes the paint darker, when you add sugar to water it makes the water sweeter, when you add stuff that absorbs heat to the air it makes the air absorb more heat and the air gets warmer. This is not really a difficult concept, it's not so much different than things we experience everyday.
3) They quickly concede and move on the lukewarm or "it's not harmful" arguments. At this point I move on the fact that the warming we see now was correctly predicted decades ago, so the scientists have a proven track record on this subject, and they say it's going to get much worse and it will have serious consequences. I ask them what scientific predictions they made decades ago that are now proven correct? Their arguments are weak and they know it.
-
Digby Scorgie at 16:09 PM on 9 May 2017Study: to beat science denial, inoculate against misinformers' tricks
Would the media give voice to people who say the Earth is flat?
Would the media give voice to people who say the Sun orbits the Earth?
Yet the media give voice to people who deny AGW, which is as solidly grounded in overwhelming evidence as the shape and orbit of the Earth. If they don't know this, they are incompetent. If they do know this, they are evil.
-
Tom Curtis at 14:41 PM on 9 May 20172017 SkS Weekly Climate Change & Global Warming News Roundup #18
nigelj @19, the paper DeanMJackson relies on is very clear:
"We have found that on global average under clear-sky conditions the OLR is reduced due to O2 by 0.11 Wm-2and due to N2 by 0.17 Wm-2."
For comparison, under the same conditions they found an OLR reduction due to CO2 of 26.8 Wm-2 (see table 1). That is 95.7 times the strength of the combined of effect O2 and N2. Further, that is 95.7 times the strength with 2,433 times the amount of gas (by volume). Contrary to his source, DeanMJackson treats the global values as being relative, which can then be adjusted for relative abundance by mass which contradicts his source.
As a side note, his source uses single factor subtraction to determine the radiative effect of each gas. The problem of that approach is that it will ignore overlaps. As a result the sum of its stated contributions (100.57 Wm-2) is substantially less than the total reduction in OLR by all gases (123 Wm-2). Some of that will be due to gases not considered, notably the chloroflourocarbons. The bulk, however, will be due to overlaps, particulary between CO2 and H2O.
Finally, I will note the absurdity of DeanMJackson calling scientists liars because in simplified explanations they call N2 (which absorbs 0.045% of upward IR radiation) and O2 (which absorbs 0.029%) transparent to IR radiation. Window glass, for comparison, has a transparency of 80-90%, and optical glass typically has a transparency of 99.95%. DeanMJackson is saying scientists lie because they call something transparent which is more transparent than the glass used in camera and telescope lenses.
Moderator Response:[DB] Having been given ample opportunity to make his case, and having abdicated the usage of logic, reason and physics, the user in question has recused himself from further participation in this science- and evidence-based venue.
-
nigelj at 12:57 PM on 9 May 20172017 SkS Weekly Climate Change & Global Warming News Roundup #18
I found this silly article by DeanMJackson:
sites.google.com/site/deanjackson60/throwing-cold-water-on-global-warming
This is the source of all the craziness. He quotes some paper in geophysical letters that finds oxygen and nitrogen allegedly have some weak properties of infra red heat absorption and transmittance similar to CO2 although much weaker. (I have no idea if this paper has been refuted or supported). He argues that the large quantities of these gases multiply this property enough to make it significant.
However he fails to grasp that levels of oxygen have actually been falling slightly over the centuries, so are not a factor in climate change. As I pointed out earlier.
Now interestingly enough, atmospheric levels of nitrogen are increasing very slightly, in a short term sense, due to (wait for it) burning of fossil fuels and forests! So it's possible nitrogen does have some small effect on global warming, although less than CO2, but unfortunately this doesnt let fossil fuels off the hook.
www2.ucar.edu/news/backgrounders/nitrogen-earth-system
I think Mr dean Jackson has basically shot himself in his own feet.
He also expands on his silly volume theory of gases.
-
nigelj at 11:58 AM on 9 May 2017Study: to beat science denial, inoculate against misinformers' tricks
Tom Curtis @2, yes very true, at least In America from what I observe. There are indeed far more denialist articles than mainstream science.
I agree it's partly scientific ignorance of journalists, and I have seen specific cases of this, but I would contend some of it's deliberate ignorance to keep an exaggerated debate going, to attract readers. Nothing else quite explains things, and its absolutely deplorable.
However in my country the newspapers are largely quite 'centrist' in outlook, and not as extremely partisan as America. Climate articles within specific newspapers tend to have a 50 / 50 split, so you get an article on evidence agw is causing more storms for example, followed by an opposing point of view from one of our local sceptics / denialists (mostly delusional fellows). But it's still a fake sort of 50 / 50 balance given the overwhelming consensus that we are altering the climate.
Having said that, it's reasonable to expect the media to publish a variety of points of view, given there is at least some genuine scepticism on some specific climate matters. So its reasonable to expect some sceptical articles from time to time, maybe about 20% of the mix would be more appropriate. It would be a bit unrealistic to expect virtually none.
It would really help if the media at least reported on the various consensus studies. This at least puts things in persepective, and informs the public. Call me old fashioned, but I thought the media was there to inform.
Regarding our own media, I object perhaps even more strongly to the way media let the sceptics get away with writing blatantly misleading garbage, or total lies, without any apparent conscience on the matter. Of course this would partly reflect a lack of journalists having any scientific knowledge, to hold people to account.
-
HK at 10:14 AM on 9 May 20172017 SkS Weekly Climate Change & Global Warming News Roundup #18
DeanMJacksons #15:
"Where did I say density? I said volume!"
You are talking about cubic feet per pound of different gases. The definition of density is mass per unit of volume, whether measured in your archaic units or more modern ones like kilogram and cubic metre, so you are in fact talking about density!
And as I showed in my post 13, greenhouse gases can have both higher (CO2, N2O, O3) and lower (H2O, CH4, NH3) density than the non-greenhouse gases oxygen and nitrogen, so density is clearly not a defining characteristic of a greenhouse gas. Why is that simple fact so hard to understand?Moderator Response:[PS] DNFTT
-
Tom Curtis at 09:58 AM on 9 May 2017Study: to beat science denial, inoculate against misinformers' tricks
nigelj @1, a simple search of google shows on the internet, denialist articles far outnumber those presenting the actual science. I believe that to also be the case in the right wing and/or Murdoch press (and it is certainly the case in my experience). We struggle to obtain a 50/50 distribution in the "main stream media".
Part of the problem is that most journalists are scientifically illiterate. CP Snow wrote in The Two Cultures:
"A good many times I have been present at gatherings of people who, by the standards of the traditional culture, are thought highly educated and who have with considerable gusto been expressing their incredulity at the illiteracy of scientists. Once or twice I have been provoked and have asked the company how many of them could describe the Second Law of Thermodynamics. The response was cold: it was also negative. Yet I was asking something which is about the scientific equivalent of: Have you read a work of Shakespeare's?"
Most journalists wouldn't even be able to quote one of Newton's laws of motion, the scientific equivalent of having read any book. As a result, perhaps, the do not understand what travesties of journalistic standards are the articles purporting to be skeptical of AGW.
It is not good enough.
-
Tom Curtis at 09:47 AM on 9 May 20172017 SkS Weekly Climate Change & Global Warming News Roundup #18
To the moderator, DeanMJackson @14 states:
"That's not the only problem with the 'experiment'. Specific heat means the amount of heat needed to raise the temperature of a [volume of] gas [one degree], and because Carbon Dioxide can raise its temperature with less heat than Nitrogen and Oxygen"
Engineer's toolbox (and here for densities):
Air 1.01 kJ/(kg K) 1.205 kg/m^3 1.01 * 1.205 = 1.217 kJ/m^3
Oxygen 0.919 kJ/(kg K) 1.331kg/m^3 0.919 * 1.331 = 1.223 kJ/m^3
Nitrogen 1.04 kJ/(kg K) 1.165 kg/m^3 1.04 * 1.165 = 1.2116 kJ/m^3
CO2 0.844 kJ/(kg K) 1.842 kg/m^3 0.844 * 1.842 = 1.554 kJ/m^3
Products rounded to three significant figures. Densities, and hence heat capacities per unit volume at standard temperatures and pressures.
DeanMJackson has just finished arguing the importance of the greater mass in the flask. He now wants to totally ignore that and treat the masses as constant across the flasks while using the heat capacity per unit mass of the gases. It is clearly his intention to introduce facts, or ignore them as they suite his argument rather than to try and come to a consistent understanding of the case. Indeed, that is being to generous. He is also very willing to simply introduce falsehoods if they suite his argument as well.
He has now given more than sufficient evidence that he does not wish to abide by the comments policy on excessive repetition. He has also repeatedly demonstrated he is unwilling to give "substantial reasons" for his arguments, meaning his posts constitute sloganeering by the definitions of the comments policy. I move that the member be no longer heard, as it were. Certainly unless and until he acknowledges that a mole of any gass occupies the same volume at a given temperature and pressure as every other gas, and that hence in the atmosphere the molar heat capacity is the most usefull in determining the heat capacities of gases, and that, therefore, for atmospheric purposes, CO2 has a greater heat capacity than ordinary air, N2 or O2; and that therefore his argument against the greenhouse effect, in addition to being invalid (it would not prove his point even if his premises were true) is unsound (it would not prove his point even if valid for the premises are false).
If you think the most appropriate process is to clear his posts root and branch, I certainly would not disagree and would be quite happy for my posts to be deleted as well in such a response.
Moderator Response:[PS] the bar for "most astonishing misunderstanding of physics by a commentator" is quite high but Dean is pushing it and I strongly suspect troll instead. I'll leave it to DB to adjudicate.
-
nigelj at 08:06 AM on 9 May 2017Study: to beat science denial, inoculate against misinformers' tricks
This junk science attacking vaccines and climate science, and this misleading rhetoric, is all so frustrating. It's a bit of a side effect of everyone having a super computer in their pocket, to spread or read this stuff.
The fake balance in the media is also frustrating. On the other hand you are not going to get a 97% / 3% split of warmist and denialist articles, and it will be closer together for practical purposes. But a 50 / 50 split is certainly artificial, and is creating a false impression.
But at the very least the media could have an advisory note above climate denialist style articles, that there is a 90 - 97% consensus. This would gain them readers through grabbing attention, and promoting full disclosure.
-
nigelj at 06:29 AM on 9 May 20172017 SkS Weekly Climate Change & Global Warming News Roundup #18
DeanMJackson @15, since you think CO2 is a "cooling gas" go and live in Venus and see how long you survive.
Honestly you either havent got a clue, or are deliberately and knowingly spreading junk science.
-
DeanMJackson at 06:06 AM on 9 May 20172017 SkS Weekly Climate Change & Global Warming News Roundup #18
HK says, "DeanMJacksons claim that the GHE of a gas depends on its density..."
Reply:
Where did I say density? I said volume! Let's take a look at the volumes of carbon dioxide, oxygen and nitrogen at 1 atmosphere/70 F* ...
One pound of Carbon Dioxide has a volume of 8.7 cubic feet,
Oxygen is at 12.1 cubic feet.
Nitrogen is at 13.8 cubic feet
With a smaller volume than either Nitrogen and Oxygen, Carbon Dioxide can only possess LESS heat than Nitrogen and Oxygen, and when more COOLER carbon dioxide is pumped into the Nitrogen-Oxygen based atmosphere (>99% of the atmosphere's gasses), the result can only be a COOLING of the atmosphere. As demonstrated by the three volumes illustrated for Carbon Dioxide, Oxygen and Nitrogen, Carbon Dioxide holds approximately one-third less heat than either Nitrogen or Oxygen, proving Carbon Dioxide's cooling effect on the atmosphere. To better grasp this fact, let's use a more familiar everyday experience we witness involving water: When a small amount of cooler water is added to a larger warmer body of water, the result is a cooling of the water.
Moderator Response:[PS] If you are trolling by making ridiculous misstatements of physics then please find another website for your amusement. If not, then please, please open a textbook...
-
DeanMJackson at 06:00 AM on 9 May 20172017 SkS Weekly Climate Change & Global Warming News Roundup #18
Tom Curtis says, "Just for the record, DeanMJackson has now suggested that the experiment I linked to, although it directly contradicts his prediction, does not refute him because of the pressure induced warming due to the greater density of CO2."
Reply:
That's not the only problem with the 'experiment'. Specific heat means the amount of heat needed to raise the temperature of a [volume of] gas [one degree], and because Carbon Dioxide can raise its temperature with less heat than Nitrogen and Oxygen can (Nitrogen and Oxygen have high specific heats, meaning it takes more heat to raise their temperatures), naturally the temperature of the Carbon Dioxide only jar rises faster than the predominantly Nitrogen-Oxygen jar!
-
HK at 20:54 PM on 8 May 20172017 SkS Weekly Climate Change & Global Warming News Roundup #18
DeanMJacksons claim that the GHE of a gas depends on its density can easily be debunked by comparing the molecular mass of some gases. The molecular mass determines the density of gases when their pressures and temperatures are the same. First, the two major constituents and non-GHGs in our atmosphere:
N2: 28
O2: 32
And then some greenhouse gases:
CO2: 44
H2O: 18
CH4 (methane): 16
N2O (nitrous oxide): 44
O3 (ozone): 48
NH3 (ammonia): 17
SO2 (sulfur dioxide): 64
CFCl3 (Freon-11): 137So, it's evident that the molecular mass (and therefore density) of GHGs can be both lower and higher than the two major non-GHGs in Earth's atmosphere!
Prev 419 420 421 422 423 424 425 426 427 428 429 430 431 432 433 434 Next


