


 Arguments


Recent Comments
Prev 35 36 37 38 39 40 41 42 43 44 45 46 47 48 49 50 Next
Comments 2101 to 2150:
-
Eclectic at 04:16 AM on 20 March 2023The Big Picture
Gootmud @109 ,
you seem very alarmed at the imminent prospect of Earth's oceans freezing over or becoming boiling hot. Have you been reading alarmist blogs such as Dr Judith Curry's ? . . . or the even less scientific WattsUpWithThat ? Warning ~ those "contrarian" sources are lacking in common sense.
And there is no need for you to be alarmed about climate scientists using "models". The scientists are not clueless about Earth's future climate ~ they are guided by a good knowledge of basic physics plus knowledge of Earth's climate responses to altered Greenhouse Gas levels in the past millions of years. And also by recent responses to volcanic aerosol events and minor fluctuations in solar output.
No models are required to get a straightforward understanding of how climate changes occur. Please feel more relaxed, and take the time to educate yourself from genuinely scientific sources.
But you need to be careful not to be fooled by the many BS sources (such as Curry's or the WUWT mentioned above).
-
Bart Vreeken at 03:50 AM on 20 March 2023The Big Picture
Rob Heneycutt, back to your original remark @74. There you say
"Hang on. Am I missing something or is Bart actually thinking that the gravitational mass of Greenland is going to pull sea level away from The Netherlands, when it's 3000km away, making their impacts of SLR nominal? Surely not."
Yes, I am actually thinking something like that. But it's a little different. At the moment the gravitational mass of the ice is attracting mass. 3000km is no problem, the influence goes much further. So, because of the ice mass the sea level here is higher then it should be without the ice. When the ice melts a part of this effect is gone, and because of that the sea level will drop here. On the other hand, there's the meltwater that distributes over the ocean. That aspect makes the sea level rise. The sum of these to is slightly positive.
And now you say:
"They're talking about fractions of a millimeter per year. So, at maximum, they're saying the effect around Greenland (deep blue) over the course of the next century would be on the scale of 5 cm, out of a potential of 1-2 meters of SLR."
Yes I do agree with most of that, so whats the point? The 2 m SLR is a bit to wild, KNMI talks about max 1.2 m in 2100.
-
Gootmud at 03:49 AM on 20 March 2023The Big Picture
MA Rodger @110, saturation is already here. More CO2 can't make the sky much darker than it already is within its absorption bands.
Negative feedback effects and magnetic fields are likewise neither magic nor speculative. They're demonstrably real physical phenomena, just like the greenhouse effect. Figuring out how all these factors interact to create warming or cooling climate is a dizzyingly complex job that can only be attempted with computer models.
Moderator Response:[BL] Frankly, Gootmud, you are very badly misinformed.
If you want to talk about saturation, the place to learn where you are wrong is on this thread:
At a guess, your "magnetic fields" probably has something to do with cosmic rays. Here is where you can find out you are wrong:
https://skepticalscience.com/cosmic-rays-and-global-warming.htm
For computer models, you need to go here:
And please read the Comments Policy.
-
Rob Honeycutt at 03:33 AM on 20 March 2023The Big Picture
Gootmud @102... One correction there. Arrhenius' work wasn't a thought experiment. It was actually based in what was mathematically understood at the time about radiative absorption spectra and the product of extensive calculations, all done without benefit of computers. Just lots of laborious pencil and paper calculations, I'm sure with the help of a small army of lab assistants.
-
Rob Honeycutt at 03:28 AM on 20 March 2023The Big Picture
For purposes of clarity...
Bart, @108 you stated, "On global scale this meltwater isn't neglectable (sic), and on locale (sic) scale (western Europe) the gravity effect isn't neglectable (sic). The last two things can neutralize each other. I hope it's clear now."
On a global scale there is clearly an important effect.
On a local scale (western Europe) the effect is negligible, meaning almost no effect at all, positive or negative.
The part where you say, "[t]he last two things can neutralize each other" is completely wrong. This is what I'm trying to explain to you.
You have made a very specific claim about the science. You have provided a citation to research in support of that claim (both good), but your interpretation of the citation is in error.
This is the time where it would be rational to carefully think about this, admit your error, and move on.
-
Rob Honeycutt at 03:12 AM on 20 March 2023The Big Picture
Bart... At this point I would highly suggest you thoroughly read the paper you're citing because you're just not grasping what they're discussing. In particular take note of the scale of the maps. They're talking about fractions of a millimeter per year. So, at maximum, they're saying the effect around Greenland (deep blue) over the course of the next century would be on the scale of 5 cm, out of a potential of 1-2 meters of SLR.
The region they refer to (northern Europe including the Netherlands, Atlantic coastline of Germany and along theArctic coastline of Russia [Fig. 2a]) would have a negligible effect, meaning neither net positive nor net negative. In other words, no effect.
Here is a link to the paper so you don't have to look it up again. Please read it thoroughly and carefully.
-
Rob Honeycutt at 02:58 AM on 20 March 2023The Big Picture
Bart @108... No, I have not made the wrong interpretation of the text. I'm reading it correctly. The word is not "neglectable," it is "negligible." And "negligible" means it's so small that it can be ignored. The word "neglectable" in the context of this discussion is nonsensical.
-
MA Rodger at 02:20 AM on 20 March 2023The Big Picture
Gootmud @109,
CO2 will not "saturate" prior to the planet warming to ridiculously high levels. The potential for some magic negative feedbacks to counteract further GHG warming or for some magnetic field effect to appear is lower enough to be ignorable. And I don't see why you need complex models to tell you that.
-
Gootmud at 01:05 AM on 20 March 2023The Big Picture
Eclectic and John Mason @104
We do need models to predict whether it will keep on warming. As CO2's absorption spectrum saturates, it can't trap more heat. Negative feedback effects like clouds might nullify any warming. Temperatures might drop due to independent effects like magnetic field changes much more influential than the greenhouse effect. We might be at 600ppm, freezing, and looking for ways to warm the Earth and slow the advancing ice.
Without models that account for all these effects, we.know nothing about future temperatures. We don't know ranges of likely changes. We don't even know the sign. A model need not be perfect--no model is ever perfect--but it must be representative of all the relevant physics if we are to trust its output.
-
Bart Vreeken at 20:38 PM on 19 March 2023The Big Picture
Rob Honeycutt @91
Unfortunately, you made a wrong interpretation of the text. The 'neglectable' is about the influence of meltwater from Greenland in western Europe. On global scale this meltwater isn't neglectable, and on locale scale (western Europe) the gravity effect isn't neglectable. The last two things can neutralize each other. I hope it's clear now.
-
Eclectic at 17:51 PM on 19 March 2023The Big Picture
Gootmud @106 , I've no argument against vitamin D, in moderation.
But when you apply common sense to the situation, it is evident that the "thousand other effects" must be so exquisitely balanced against each other as to be in toto largely insignificant in comparison to the well-known Usual Suspects [insolation, albedo, aerosols, and of course the biggies of the Greenhouse gasses group].
As a follower of (but not disciple of) the vague hand-wavey arguments put forward by Dr Curry, that forces unknown to human science are steering our planet's climate . . . I must say that Dr Curry is a disappointment, for she has provided no worthwhile evidence to back her statements.
I will say two points in Dr Curry's favor :-
(A) She has not actually mentioned Martians in her testimony to Congressional Committees ;
(B) She is not a science-denier of the Greenhouse Effect.
-
Gootmud at 17:05 PM on 19 March 2023The Big Picture
Eclectic @21,
Knowing about a greenhouse effect in principle gives us no guidance at all about what to do in practice, since a thousand other effects are also at work.
In principle sun exposure causes skin cancer. Does it follow we should remain indoors at all times? Of course not, because a thousand other principles also apply. We need to do things. We need vitamin D. We have evolved defenses against skin cancer. And so on.
-
John Mason at 16:26 PM on 19 March 2023The Big Picture
-
John Mason at 16:24 PM on 19 March 2023The Big Picture
Just having first coffee of the day so will deal with comment #100 in a piecemeal fashion.
"Sections 6 (Human GG are causing global warming) and 8 (warming will continue) overstate the case. We know those to be true not from a simple application of "fundamental physics" but from elaborate computer models trying to approximate physics too complex for us to grapple with any other way."
Assuming the first principles of this topic are correct (they are) then how can that statement be inaccurate? We've known for over 150 years that if GHG concentrations are driven upwards, then a warmer climate will be the eventual result and that the warming will take decades to develop to its fullest extent. Now that may be a blunt object approach, but remember that set of conclusions was reached long, long before computers were around.
Models are not perfect but nevertheless extremely useful. They help us interrogate complex and highly variable systems to see how they respond to changes in those variables. Think of them as tools in the tool-kit, alongside observations, human resources, basic principles and so on. For we don't need models to tell us it will carry on warming the more CO2 emissions grow. We;ve known that all along. -
Eclectic at 16:09 PM on 19 March 2023The Big Picture
Gootmud @102 ,
Quite agree, if you want some fine-tuning of predictions of future conditions ~ then go do your best with some complex math workings & models. Not an easy task to be very "fine".
But if you need pragmatic guidance as to what policies & actions are needed right now in the present day ~ then models are not necessary. Common sense is the necessary ingredient . . . and if you are interested in fine-tuning, then you can reassess the situation in 10 years regularly.
The climate scientists already have a sufficiently good idea of the relative importance of CO2 forcings in the overall Big Picture. Unlike the delightfully vague insinuations made by Dr Judith Curry & Co., there are no hidden Martians mysteriously manipulating Earth's climate (or if there are, then they are tragically ineffective at it).
-
Gootmud at 15:15 PM on 19 March 2023The Big Picture
Eclectic @101,
Yes, everyone agrees with Arrhenius that more CO2 means warmer temperatures, all other things being equal.
Which is fine as a thought experiment, but in real life other things are nowhere close to equal. Questions like what the temperature will be in 2050, or how much CO2 matters versus other climate drivers, require a much more detailed understanding of climate dynamics. Which is why researchers have spent decades developing elaborate computer simulations. These models are indeed vital to many of the article's claims.
-
Eclectic at 14:39 PM on 19 March 2023The Big Picture
Gootmud @100 ,
you are right that shutting down the old reliable (fossil fuel) power sources is premature, pending the establishment of a fully resilient new renewables and/or nuclear power system. That's simply common sense. Just as it's simply common sense to press ahead rapidly to achieve "Zero Nett Carbon", even though that will take decades to complete the transition.
But you are in the wrong, to think that "models" are vital (or even mildly important) in making a sensible pragmatic assessment of the climate situation. For example, back in the 1890's [not a misprint] a scientist was able to make a reasonable assessment of what happens as CO2 atmospheric level increases. All he needed to use was a pencil & paper [not a model or a computer in sight]. Granted, he had a better brain than me (and possibly than you, too). He was not in any way dependent on complex "models". Nor, using common sense, do the conclusions of climate scientist of today need more than basic physics ~ helped along by paleontological knowledge of Earth's climate history.
Economics ~ yeah, not really much of a science. Too much Friedman and freedom from common sense.
-
Gootmud at 13:49 PM on 19 March 2023The Big Picture
This article starts off strong with the first five sections.
Sections 6 (Human GG are causing global warming) and 8 (warming will continue) overstate the case. We know those to be true not from a simple application of "fundamental physics" but from elaborate computer models trying to approximate physics too complex for us to grapple with any other way.
To substantiate the statements, the article needs to show those models are rock solid and do reproduce all the relevant physics. But section 11 (legitimate unresolved questions) acknowledges the opposite.
The subsequent sections on net benefits and risks are therefore even shakier, because they rely on another layer of computer models. Like many of us post pandemic, I've become much more skeptical of pronouncements attributed to unnamed "experts" bearing computer models. Even on their own, state of the art economics models can predict next quarter's GDP only two quarters after it ends. For the article to persuade effectively, these model dependencies need buttressing.
The risk discussion needs to be brought up to date in light of the European energy crisis, which has shown "better safe than sorry" has a faulty premise. Shutting down cheap, reliable power sources is not safe at all but introduces massive hazards including economic collapse and war.
-
One Planet Only Forever at 13:33 PM on 19 March 2023The Big Picture
I find Bart Vreeken’s comments interesting, but not in the same way that Bart appears to be interested.
My interest is the Big Picture of the future of humanity and the development of sustainable ways for humans to share the limited capacity of this planet to be lived on sustainably, to not be compromised by the impacts of human activity. A significant part of that interest is understanding the possible peak effects of the harmful accumulating impacts of continued fossil fuel use.
Bart @84, starts with: “MA Rodger @82 your quote is about the global sea level rise, not the local SLR.” The set of images Bart presents are about ‘global sea level impacts’ of the loss of ice due to global warming. But Bart’s interest is limited to the impact on the Netherlands of ice loss from Greenland. The other presented ice loss evaluations do not ‘interest’ Bart as much. This selective regional, rather than Big Picture, interest can be observed in many of Bart’s comments.
Bart’s comments @533 and @537 on the recently updated SkS Climate Myth “Is Antarctica losing or gaining ice?” appear to be their first presentation (March 9, 2023) of what they find ‘interesting’. It is essentially the following: The most recent heavy snow fall on Antarctica, rather than all the other history of events on Antarctica, may be indicating the future of Antarctica. Why would that be ‘interesting’? Maybe because of what happens to the Netherlands due to ice loss from Antarctica as shown in the image set of Barts’s comment @84 referred to above.
And in Bart’s comment @560 indicates they live in the Netherlands and are concerned about sea level rise but “We have to monitor Antarctica very well, try to understand how it works, try to predict what will happen. But not with panic, that won't help us.” Their ‘interest’ in the potential that the most recent year of heavy snowfall on Antarctica indicating a very different future is like the claims that the lack of warming after 1998 indicated a very different future than the ‘panic about ending the harmful impacts of fossil fuel use, especially the global warming impacts. Many people tried to claim that post 1998 temperatures indicated ‘the end of the warming that some people were panicking about’. And Bart appears to be doing a similar thing by trying to claim that this recent year in Antarctica is a turning point of behaviour in Antarctica (as Bob Loblaw tried to point out in his comment @534 in response to Bart’s comment @533).
There is a wealth of evidence in Bart’s comment history that appears to indicate that their interests are not Big Picture. Their interests appear to be much smaller/narrower. They appear to be seeking ‘positive perceptions from the perspective of short-term regional interests’.
They may be correct about the interpretation of the Green lines of the images in their comment @84 and @87 ... but their lack of interest regarding the potential peak impacts (way beyond 2100 levels) on places like Bangladesh is what I find “Interesting” (and not in a Good Way). See My comment @68.
-
Rob Honeycutt at 11:23 AM on 19 March 2023The Big Picture
Bart @94... It's strange that you claim Bob doesn't understand the figures when you are the one directly contradicting what the authors of the figure are stating when they clearly say, "There is a negligible impact on the rest of northern Europe including the Netherlands..." Negligible, as in, "unimportant" and "not worth considering."
Avoiding responding to my posts doesn't make them go away.
-
Bart Vreeken at 08:53 AM on 19 March 2023The Big Picture
Bob @96 here's the source of the figure:
I don't understand your problem with % and numbers in mm/yr.
Again: In the example on the map there is a mass loss of 166 Gt/yr. 361.8 Gt of ice will raise global sea levels by 1 mm. So, in this example the sea level rise will be 166/361.8 = 0,46 mm. 12.5% of this is 0,0575 mm/yr.
Moderator Response:[RH] Shortened link so it didn't scroll off-page
-
Bob Loblaw at 06:09 AM on 19 March 2023The Big Picture
Bart @ 94:
Please explain how you make comparisons between numbers in % and numbers in mm/yr.
And please provide a reference for your interpretation of the "relative sea level change" - e.g. the source of the figure. Your interpretation of other figures and numbers in this discussion has been exceedingly unreliable.
-
John Hartz at 04:58 AM on 19 March 2023The Big Picture
The following article may contain updated data pertinent to the ongoing discussion of sea level rise on this comment thread.
NASA Uses 30-Year Satellite Record to Track and Project Rising Seas, Staff, NASA's Global Climate Change, Mar 17, 2023
-
Bart Vreeken at 04:22 AM on 19 March 2023The Big Picture
Hi Bob Loblaw, I'm afraid you don't understand the figure well.
Above a) you see the mass loss of Greenland where the calculation is based on. It says -166 Gt/yr. This causes a global sea level rise of something like 0,46 mm/yr. Due to the gravitation effect there are places on earth where the sea level rise is less then that, and places where it's more then that. The border between these two area's is the green line on the map between Africa and South America and in the Pacific. So, the Netherlands are in the area with less then 0,46 mm/yr sea level from Greenland, but it's more then zero. Then there is an other line, between yellow en blue. In the blue area there is no sea level rise by Greenland at all. Instead there is a drop of the sea level.

-
Bob Loblaw at 03:26 AM on 19 March 2023The Big Picture
Bart @ 87:
Thank you for your clarification of your position, and for providing such an excellent example of your complete incompetency in this matter.
Yes, 12.5 is larger than zero.
The problem is that your 12.5 magic number is a percent. As in "1 is 12.5% of 8", or "25 is 12.5% of 200".
In my comment 86, I am looking at the figure you provided in comment 84. The zero value in that figure has units of mm/yr. A value of zero means no difference from the global mean. If you want to convert any of those numbers to a percent, you need to know what the global mean value is, in mm/yr.
...except for one of those values. Regardless of what the global mean value is, a location where the relative sea level change differs from the global mean by 0.00 mm/yr will have a sea level rise that is 100% of the global mean.
So, the skill-testing question is:
- Which is larger? 12.5% of the global mean, or 100% of the global mean?
Remember, you've already claimed that 12.5% is higher.
-
Bob Loblaw at 03:12 AM on 19 March 2023The Big Picture
Rob @ 89:
Sorry, yes, I'm sure you understand the process. The way you'd worded it left it open to others thinking you questioned the gravitational effects, rather than just questioning the effect on The Netherlands, 3000km away.
-
Rob Honeycutt at 03:04 AM on 19 March 2023The Big Picture
Bart @84... If you were to actually read the paper you got those images from (like I just did) you would find the authors state, "There is a negligible impact on the rest of northern Europe including the Netherlands, Atlantic coastline of Germany and along theArctic coastline of Russia (Fig. 2a)." [emphasis added]
That's very different from what you're claiming. You're claiming, "Netherlands are close enough to Greenland to take profit of this effect..."
"Negligible impact" and "close enough to take profit" are very different conclusions, the former being the conclusions of the researchers and the latter being something you're making up on your own without the benefit of a full understanding.
Negligible means "so small or unimportant as to be not worth considering; insignificant."
-
Rob Honeycutt at 02:50 AM on 19 March 2023The Big Picture
Bart @84... You were doing so well in your explanation up to the point you started making up stuff on your own, like: "Netherlands are close enough to Greenland to take profit of this effect..."
The Netherlands are 3000km away.
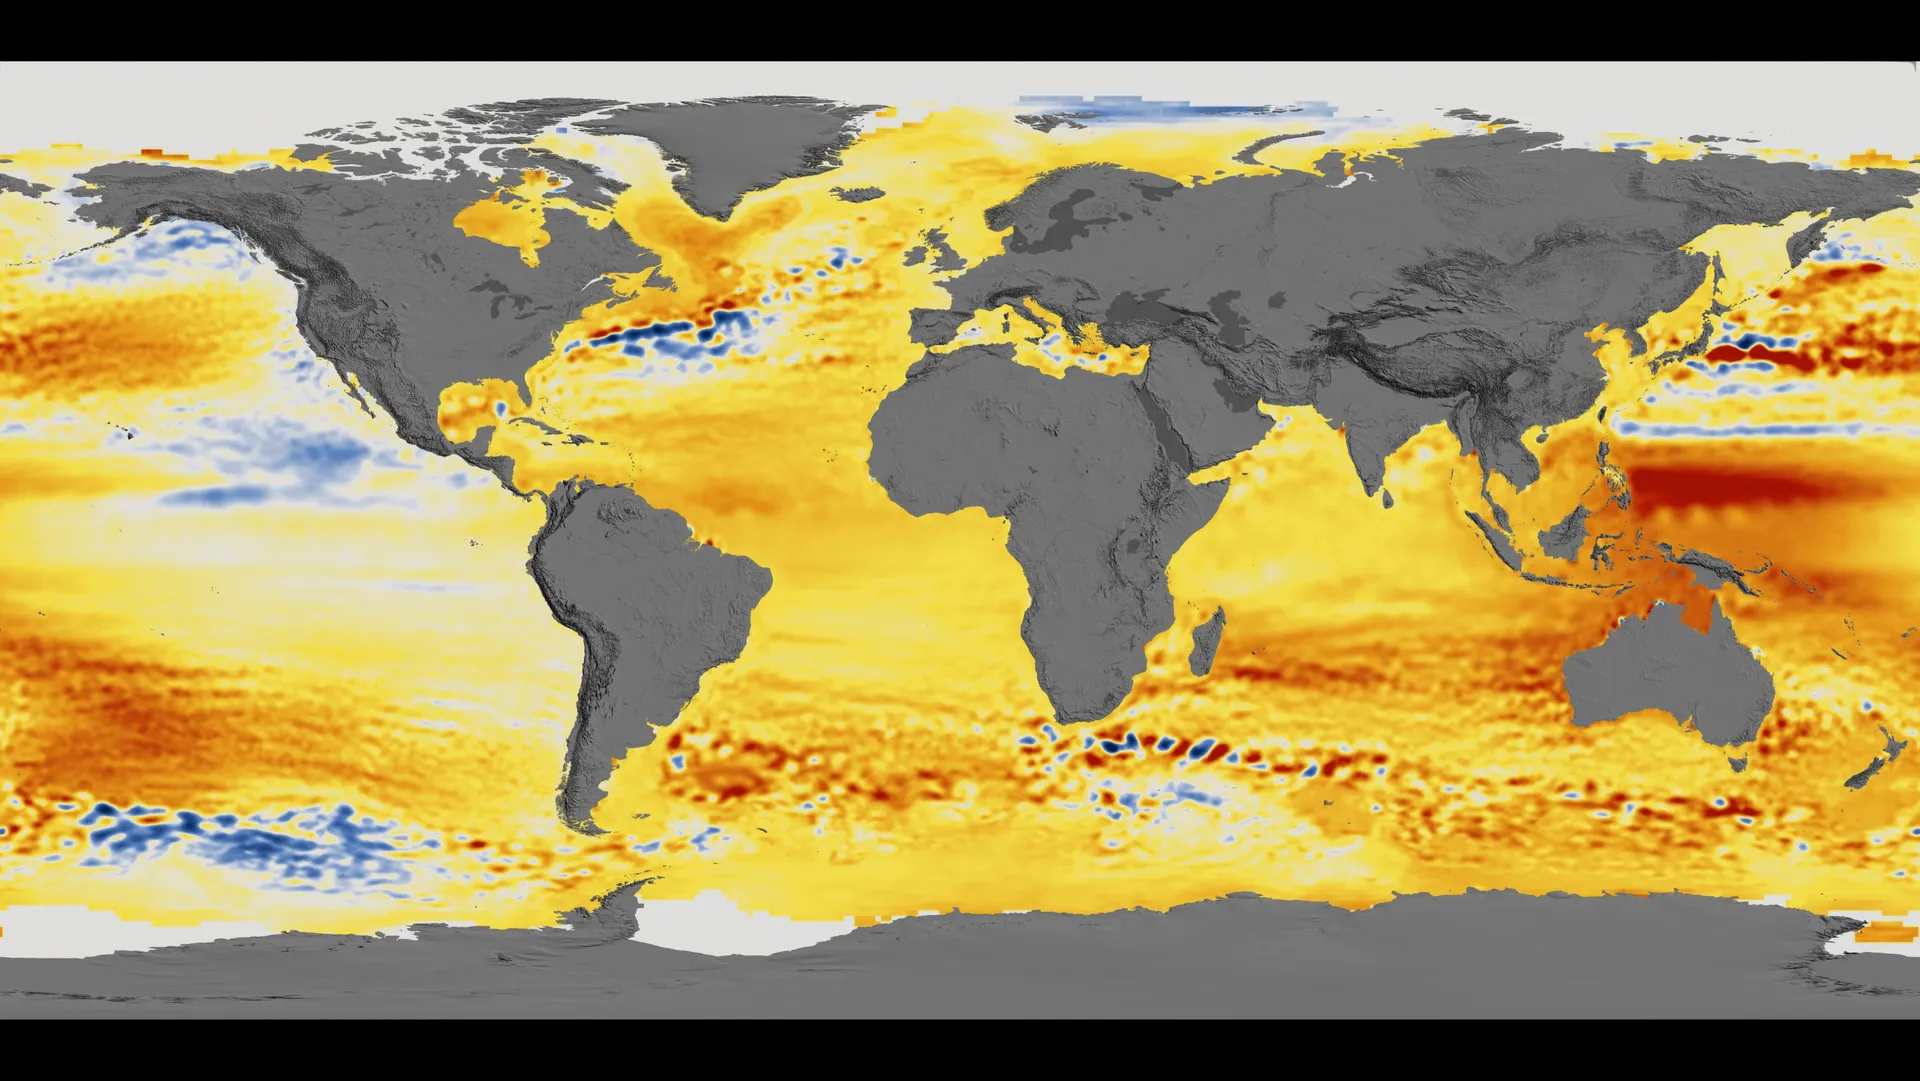
Here is a map from NASA, created through the JASON and TOPEX satellite missions to measure SLR over the past 23 years. This map represents the change in SLR over that period. Blue/white areas are where SL has fallen or stayed the same. Orange/red are SLR.
Now, look close at the area between Greenland and The Netherlands.
-
Rob Honeycutt at 02:24 AM on 19 March 2023The Big Picture
Bob @76... I'm very aware of the gravitational effects of the ice sheet. I'm just curious is Bart actually believes it has a substantive effect on The Netherlands 3000km away.
-
John Hartz at 02:17 AM on 19 March 2023The Big Picture
Speaking of Greenland, what is described in the following news article does not bode well for the future of the Greenland ice sheet...
Greenland temperatures surge up to 50 degrees above normal, setting records by Ian Livingston & Kasha Patel, Weather, Washington Post, Mar 8, 2023
The lede for this article:
The record-breaking warmth is raising concerns about melting summer ice.
-
Bart Vreeken at 23:08 PM on 18 March 2023The Big Picture
So, now michael sweet @72 says my 12.5% was too low, and Bob Loblaw @86 says it was too high. Who is right? One thing is for sure, it can't be me.
-
Bob Loblaw at 22:35 PM on 18 March 2023The Big Picture
In fact, looking closely at the upper right diagram of Bart's comment # 84, we see that The Netherlands falls pretty close to the 0.0 relative sea level change boundary in the colour code (light blue vs. light yellow).
-
Bob Loblaw at 22:32 PM on 18 March 2023The Big Picture
Bart @ 84: "but not enough to avoid sea level rise from Greenland completely."
....and none of these diagrams or papers you refer to support your original claim that The Netherlands would only see 12.5% of the global mean sea level rise.
-
Bart Vreeken at 22:30 PM on 18 March 2023The Big Picture
MA Rodger @82 your quote is about the global sea level rise, not the local SLR.
This is how it works. The Greenland Ice Sheet has a lot of mass, so it attracts sea water. Due to that, the sea level in a large area around Greenland is higher then it should be without the mass of the ice. When the ice starts to melt a part of this effect disappears. So, around Greenland the sea level will drop, not rise. Netherlands are close enough to Greenland to take profit of this effect, but not enough to avoid sea level rise from Greenland completely.
-
Bob Loblaw at 22:28 PM on 18 March 2023The Big Picture
Bart @ 81: "Well, that's great. Do you really think I would write about Greenland when I didn't know how it works? "
I only know as much about you as I have read in your comments here. Based on what you have written here, my overwhelming impression is that yes, you would write about Greenland when you don't know how it works.
-
MA Rodger at 21:42 PM on 18 March 2023The Big Picture
Bart Vreeken @80,
That is a curious quote about the Greenland contribution to Netherland SLR given the KNMI Report also says on P22:-
The mass loss of the ice sheets of Antarctica and Greenland and glaciers continues unabated. Since 1993, this component has been the largest contributor to sea level rise.
The idea that the melt water from Greenland, part of the largest contribution to SLR, should somehow choose to avoid the seas off the Netherlands is somewhat silly. I think the idea being expressed is that (as explained within the KNMI Report) SLR is not appearing so much off Netherlands due to altered weather in the North Sea and so the 'Greenland melt' is being used in your quote synonymously for SLR.
-
Bart Vreeken at 20:35 PM on 18 March 2023The Big Picture
Bob Loblow @75 you said:
"Another clue for you: losing ice at lower altitudes around the perimeter of the ice sheet, and gaining ice at the higher altitude is Business As Usual for continental ice sheets. There is this thing called "glacial flow" that moves ice from the accumulation zone to the ablation zone"
Well, that's great. Do you really think I would write about Greenland when I didn't know how it works?
My turn then. The mass change of Greenland by year. Cherry-picking? Maybe, but I use all the available data of GRACE. Over a longer period (altimetry data) there is an increase of mass loss. Don't pay too much attention to the trendline, for the data have a lot of noice. But there is a similarity with Antarctica: more snowfall in the last years, caused by less sea ice.

-
Bart Vreeken at 19:48 PM on 18 March 2023The Big Picture
Thank you michael sweet @72 for the map of Greenland, based on altimetry. I didn't know this one, it's different from what I expected. I was too quick with my map of the SMB anomaly of only this year, it turns out to be untypical. Never the less we don't expect so much contribution from Greenland here. From the KNMI-report we discussed before:
"Many factors have been taken into account in the calculation of sea level rise on the Dutch coast, including the expansion of the oceans due to warming, self-gravitation, the changes in salinity, and the mass loss of glaciers and ice sheets in Greenland and Antarctica. Because the melting of the Greenland Ice Sheet hardly contributes to the sea level rise off the Dutch coast, we expect that the increase here will lag slightly behind the world average."
-
Bart Vreeken at 19:30 PM on 18 March 2023The Big Picture
michael sweet @78
Good summary of the gravity point. I hope that it's clear for everyone now.
About the KNMI-report: the 2 meter sea level rise is not in the summary on page 2. Mayby you were confused by the european notation of the number? "de zeespiegel kan tot 1,2 meter stijgen" means: "the sea level can rise up to one point two meter.
An other thing is that the report has changed from the original version. We don't know what was in the original version now.

-
michael sweet at 12:36 PM on 18 March 2023The Big Picture
It is a real phenomenom that when the great ice sheets in Greenland and Antarctia melt that means there is less gravity there and the sea flows away. I remember that around Greenland itself that could be tens of meters less water and more around Antarctia. There are papers describing where in the globe there will be less water and where there will be more water (ths article describes the affect). By looking at the pattern of sea level rise (upthread I posted a map of sea level rise) and seeiing where it is higher and where it is lower scientists can get an idea of where the water is coming from.
Bart Vreeken posted a map upthread, it is probably accurate. They suggested that melting in the Antarctic will result in higher sea level rise than the global average but melting in Greenland will result in less sea level rise than the global average in Holland. Different parts of Greenland affect Holland differently.
There are other effects on sea level rise that are not intuative. The Gulf Stream carries water from North America to Europe. Sea level in Europe is about 1 meter (!!!) hgher than off North America. If the Gulf Stream stopped, sea level in Europe would decrease substantially while the East coast of the USA would flood. Who wudda thunk.
-
One Planet Only Forever at 11:54 AM on 18 March 2023The Big Picture
peppers @69,
I will offer the following response to your departure.
Claiming that a person who is twice as harmful as all other individuals is acceptable because thetotal imp[act of 3 of those others would be more harmful is ... so many applicable terms, none of them compliments.
I will add that the 'more harmful' are not discovered by evaluating the total impacts of a group. Identifying the most harmfully impacting people within any group is the proper action. The problem for any group is when its leadership is taken over by the most harmful and misleading members of the group. And that is more likely to happen in a group with a higher per capita level of harmfulness.
-
Bob Loblaw at 11:34 AM on 18 March 2023The Big Picture
Rob @ 74:
Yes the horizontal gravitational pull is indeed a factor that will affect regional sea level around Greenland.
Less mass in Greenland should mean less gravitational pull towards Greenland, so more sea water to spread elsewhere. I'll leave it to Bart to try to explain why less water around Greenland would lead to less sea water in The Netherlands. (I don't expect it to be a logical or rational explanation.)
-
Bob Loblaw at 11:28 AM on 18 March 2023The Big Picture
Bart @ 62:
In addition to pointing out what Rob said to you at comment 64 about the error in using Surface Mass Balance, I note that you have also given a map of SMB for a single winter season. Do you not bother looking at the ful captions of the figures you pick up? This one does not need translation from Dutch - it is dated March 16, 2023, and states "Accumulated anomaly since Sep 1, 2022".
You're back to the same basic error that you made in your very first post here at SkS on March 9, regarding Antarctic ice. Treating a single year of data as if it represents a long term trend.
At least you honestly say "...how the Greenland Icesheet reshapes at the moment..." Now all you need to figure out is that "the moment" is not enough to make predictions about the future.
Another clue for you: losing ice at lower altitudes around the perimeter of the ice sheet, and gaining ice at the higher altitude is Business As Usual for continental ice sheets. There is this thing called "glacial flow" that moves ice from the accumulation zone to the ablation zone. You should read about it some time.
-
Rob Honeycutt at 11:20 AM on 18 March 2023The Big Picture
Hang on. Am I missing something or is Bart actually thinking that the gravitational mass of Greenland is going to pull sea level away from The Netherlands, when it's 3000km away, making their impacts of SLR nominal?
Surely not.
-
michael sweet at 10:44 AM on 18 March 2023The Big Picture
Bart Vreeken,
I am sorry, the summary page showing 1.2-2.0 meters of sea level rise is page 2 of the document I linked. This was widely reported in newspapers like here, here and here. When a number is in the summary page at the start of a report many people do not read the rest of the report. I have difficulty reading the report, my computer does not translate PDF's.
-
michael sweet at 10:24 AM on 18 March 2023The Big Picture
Here is a map of surface height change in Greenland. That includes snowfall, melt runoff, ocean melting and iceberg calving.

The caption reads:
Maps of elevation change from satellite altimetry reveal where the Greenland Ice Sheet is changing mass. Map created using data acquired by the CryoSat-2 satellite radar altimeter. Credit: CPOM
I note that the major areas of ice loss are on the west and northwest side of the island, the opposite of Holland.
-
Rob Honeycutt at 10:10 AM on 18 March 2023The Big Picture
Peppers, I will also note that you never responded to my corrections to your C-P extinction statement that "Everything died, except the microorganizms around the rim of the oceans, around the world."
-
Rob Honeycutt at 10:06 AM on 18 March 2023The Big Picture
Peppers @69... "No one could forsee a rise in Co2 being a side effect to solving almost ever ailment of mankind..."
Give it a rest (rolls eyes). You're presenting fossil fuels as if they were the messiah.
Fossil fuels have merely been one form of energy in a long line of sources of energy through human history. They are not the "reason" for humanity solving problems nor have we solved "almost ever[y] ailment of mankind."
As pointed out before, without acknowledgement, we now have access to cheaper, more abundant forms of energy than fossil fuels and those sources are cleaner, safer, and do not emit CO2. And eventually even those forms of renewable energy will be replaced with fusion energy.
-
peppers at 09:17 AM on 18 March 2023The Big Picture
Hi One Planet,
We are not so far apart, as a growing human presence is bringing more co2 to the surface.
I depart with the vilification of part of the population as being most harmful-per person. Every segment has grown, and the greatest contributors are not the highest per person emitters. China is 4 times the population of the USA, and they are at 7.5 per capita to the USA's15.5pc, and therefore emits twice as much as the USA. If the USA were to halve thier emissions to match China's pc the USA would be at 7% of the worlds emisions. Its just not going to do anything against the new emitters being born and growing.
Great interactive chart: https://www.worldometers.info/co2-emissions/co2-emissions-by-country/
There are 15 nations as higher emitters pc than USA, including Canada and Australia. They are 1/3 in population total (of the USA) yet emit 1/2 that again of the USA. Blaming nieghbors so can scold them is what needs to be lost, when you realize it was population that has caused more co2 to be emitted.
I would be in a camp for any and all aid in helping people adapt to the forseable new environment. No one could forsee a rise in Co2 being a side effect to solving almost ever ailment of mankind, except cancer pretty much. More live to adulthood, and they live much longer too. Conquering infant mortality and pennicillin has take us from 1 to 8B and rising. There are no villians is my point. We need to be of help, not blaming. Co2 is going to continue to rise for a while.
Thanks, tons, David
-
One Planet Only Forever at 08:58 AM on 18 March 2023The Big Picture
The comments have improved my understanding of sea level rise.
Thank you Rob, Bob and Michael.
Though I lack detailed background knowledge regarding sea level rise I feel confident about pointing out that the 'peak sea level rise', not 'sea level rise by 2100', is what the future of humanity will have to deal with.
From an ethical and moral perspective, the people who benefit(ed) most from causing the harmful result should be responsible for paying for the required mitigation and adaptation. The more that they suffer because of the 'mitigation actions to rapidly end the harmful impact' the less they will have to pay in advance for the required adaptations. This avoids the problem of 'benefiting from harm done while evading the consequences of the harm done'.
What is happening today is serious unethical and immoral attempts to make the future impacts worse and avoid paying for the required repairs and adaptations. The 'highest harming' portion of the global population is not building CO2 removal devices now required to bring harmful impacts back down to 1.5 C levels of warming. And that group is also not planning to pay for the required adaptation in places like Bangladesh (or the island nations being submerged).
I will go one step further on the point of the real problem being the peak impact that has to be adapted to. There is uncertainty regarding how much adaptation is 'enough'. As a structural engineer I am very familiar with the requirements for all load resisting aspects of a structure to have a very low probability (less than 2%) that very severe potential future impacts would exceed the performance capability of the aspects of the structure. And aspects of the structure that are Primary, where their failure would cause significant overall structure failures, would have redundant mechanisms that would keep the structure system from collapsing due to the failure of a Primary element.
Sea level rise impacts would be equivalent to impacts on Primary Structure elements. So the sea level rise that the biggest beneficiaries of fossil fuel use in the current generation are ethically obligated to build globally, for all of the inhabited areas affected by the future sea level rise that they benefited from causing, would be the 'peak sea level increase' that has far less than 2% chance of being exceeded.
The big question is not the different evaluations (uncertainty) regarding the ways that Greenland and Antarctica will respond to human caused global warming. The big question is: What level of warming is almost certain to be the maximum level of the harmful human impacts.


