


 Arguments


On Hens, Eggs, Temperature and CO2
Posted on 31 May 2024 by Guest Author
The original version of this blog – written by Giacomo Grassi, with contributions from Stefano Caserini, Giorgio Vacchiano, Gianni Comoretto, Claudio della Volpe, and Mario Grosso - appeared in the Italian climate website Climalteranti. The version here has been checked and further enriched by Pierre Friedlingstein (Global Carbon Project).
A recent article suggests that the accumulation of CO2 in the atmosphere is caused by the influence of temperature on natural systems, rather than fossil fuels. But it's a glaring mistake, like confusing the brake with the accelerator.
A few months ago, a scientific article titled "On Hens, Eggs, Temperatures and CO2: Causal Links in Earth’s Atmosphere" was released, led by Demetris Koutsoyiannis, a professor of Hydrology at the University of Athens. The article analyzes the correlation between temperature difference (ΔT) and atmospheric CO2 concentration difference (ΔCO2) over the past 60 years. The correlation is evident between ΔT and ΔCO2 six months later, while it is null between ΔT and ΔCO2 six months earlier (figure 1 below). From these correlations, the authors conclude that it is not the variation in CO2 levels that influences temperatures, as claimed by a century of climate science and the IPCC, but the exact opposite.
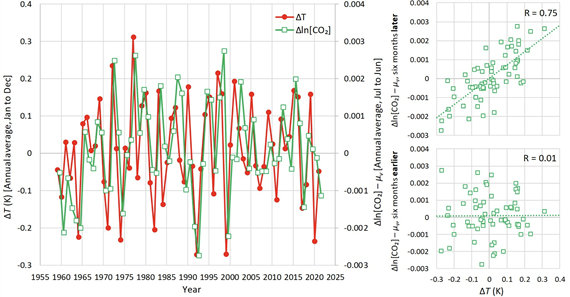
Figure 1: From Koutsoyiannis et al. 2023
The authors further assert, among other things, that: (i) the sequence they propose (first an increase in temperature, then a raise in atmospheric CO2 concentration) is well-documented in the planet's geological history; (ii) currently, human activities contribute only 4% of total emissions, with natural emissions being dominant and their increase - due to rising temperatures - more than three times higher than those linked to human activities.
The study has received some attention in climate change-denying or skeptic circles (e.g. here).
Acknowledging that the observed correlation may raise doubts among non-experts, this post briefly outlines how the conclusions of the study by Koutsoyiannis et al. represent a glaring mistake.
Let's start with what scientists studying the carbon cycle, whose data is utilized in IPCC reports, have to say. According to the Global Carbon Project, which annually publishes the Global Carbon Budget, anthropogenic CO2 emissions have reached about 40 billion tons per year on average over the last decade. These emissions are predominantly from fossil fuels (88%) and partly from land use and deforestation (12%) (see figure below). Only about 45% of these emissions remain in the atmosphere. The remaining portion is absorbed by terrestrial ecosystems (around 30%) and oceans (around 25%).
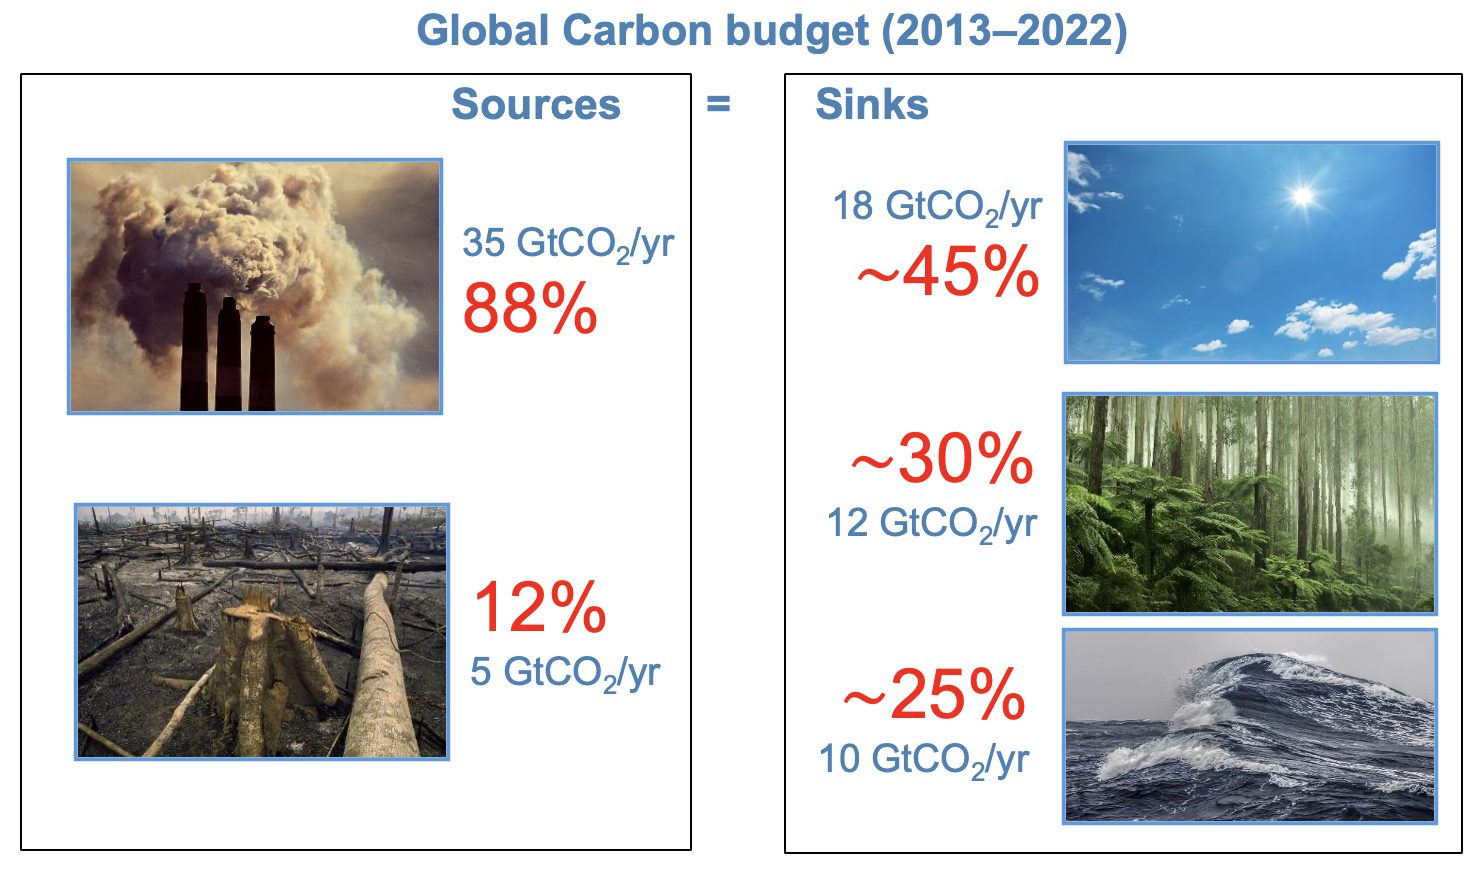
Figure 2: Approximated numbers from Friedlingstein et al. 2023, Global Carbon Project
Over the past 60 years, emissions from fossil fuels have increased rapidly, with a slowdown in the last decade (see figure below), while emissions from deforestation have slightly decreased. Net CO2 uptake by oceans and terrestrial ecosystems has increased proportionally to emissions from human activities, leaving the fraction of these emissions remaining in the atmosphere (airborne fraction) relatively constant over time (about 45%). It's important to note the significant interannual variability in net CO2 uptake by terrestrial ecosystems, causing a corresponding strong variability in CO2 accumulation in the atmosphere.
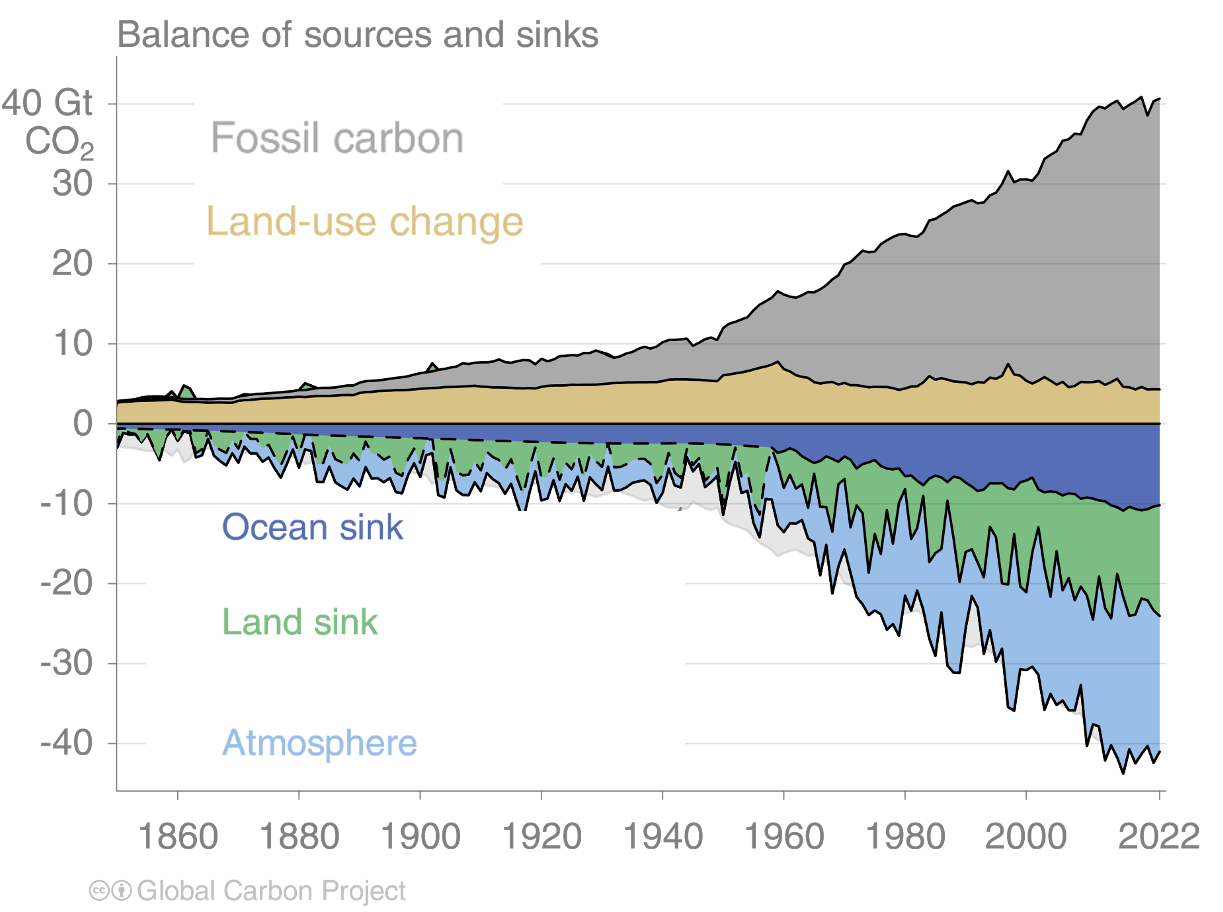
Figure 3: Source Global Carbon Project
How certain are we of these estimates? Some things we know quite well, others less so. For example, the estimates of emissions from fossil fuels (uncertainty of 5%) and the accumulation of CO2 in the atmosphere (uncertainty of 2%) are highly precise. However, we are still somewhat uncertain about the net uptake of CO2 (uncertainty of 14% for oceans and 24% for terrestrial ecosystems), and especially about emissions from land use and deforestation (uncertainty of 54%).
Let's now revisit what was stated in Koutsoyiannis' study.
Is it true that in the planet's climatic history, temperature increases before atmospheric CO2 concentrations? In several cases, yes, as well-known to climatologists and explained here: changes in glacial cycles over the last 800,000 years were initiated by changes in Earth's orbit and then amplified by the temperature-CO2 feedback, mainly mediated by oceans (the warmer the ocean, the less CO2 it can dissolve, and vice versa). In other cases, however, the sequence was reversed, with volcanic CO2 causing temperature rises. However, it's crucial to note that the observation of a phenomenon in the past, and its potential ongoing occurrence, does not necessarily imply that this phenomenon predominantly explains what we observe today, particularly the increase in atmospheric CO2. Conclusions such as "climate has always changed due to natural causes, so today's changes are unrelated to human activity" represent a logical fallacy alien to the scientific method (see figure below).

Cranky Uncle cartoon from Skeptical science
Is it true that human CO2 emissions are 4% of natural ones? Yes, this is the order of magnitude, if one only considers the estimates of gross natural CO2 emissions. Gross natural emissions include plants respiration and soils carbon decomposition as well as outgassing of CO2 from the oceans. However, what Koutsoyiannis fails to mention is that these gross natural CO2 emissions are more than balanced by gross natural CO2 absorptions (see figure below), including terrestrial and marine photosynthesis and the uptake of CO2 by the oceans. What matters for the accumulation of CO2 in the atmosphere is the net flux, i.e., the difference between gross emissions and absorptions.
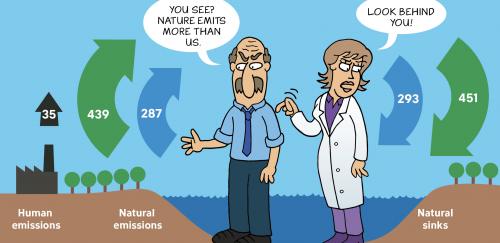
Source: Cranky Uncle vs. Climate Change by John Cook. Please note that this cartoon is illustrative in nature as an example for cherry picking and that the numbers shown are from 2023.
Let's explain it with an analogy: imagine a bathtub with a continuous flow of water entering and exiting (for example, 20 liters per minute). In the absence of human interference (emissions from fossil fuels), these flows (emissions and absorptions, or sinks) balance each other out, and the water level in the bathtub (CO2 in the atmosphere) remains constant. Now, imagine adding an additional inflow (human emissions), small compared to the natural one (1 liter per minute), which in turn stimulates a further small outflow (0.5 liters per minute of additional natural sinks). Although these two additional flows are modest compared to the original ones, over time they can significantly alter the natural balance: consequently, the water level in the bathtub increases, minute after minute. The same happens with emissions and the concentration of CO2 in the atmosphere, year after year.
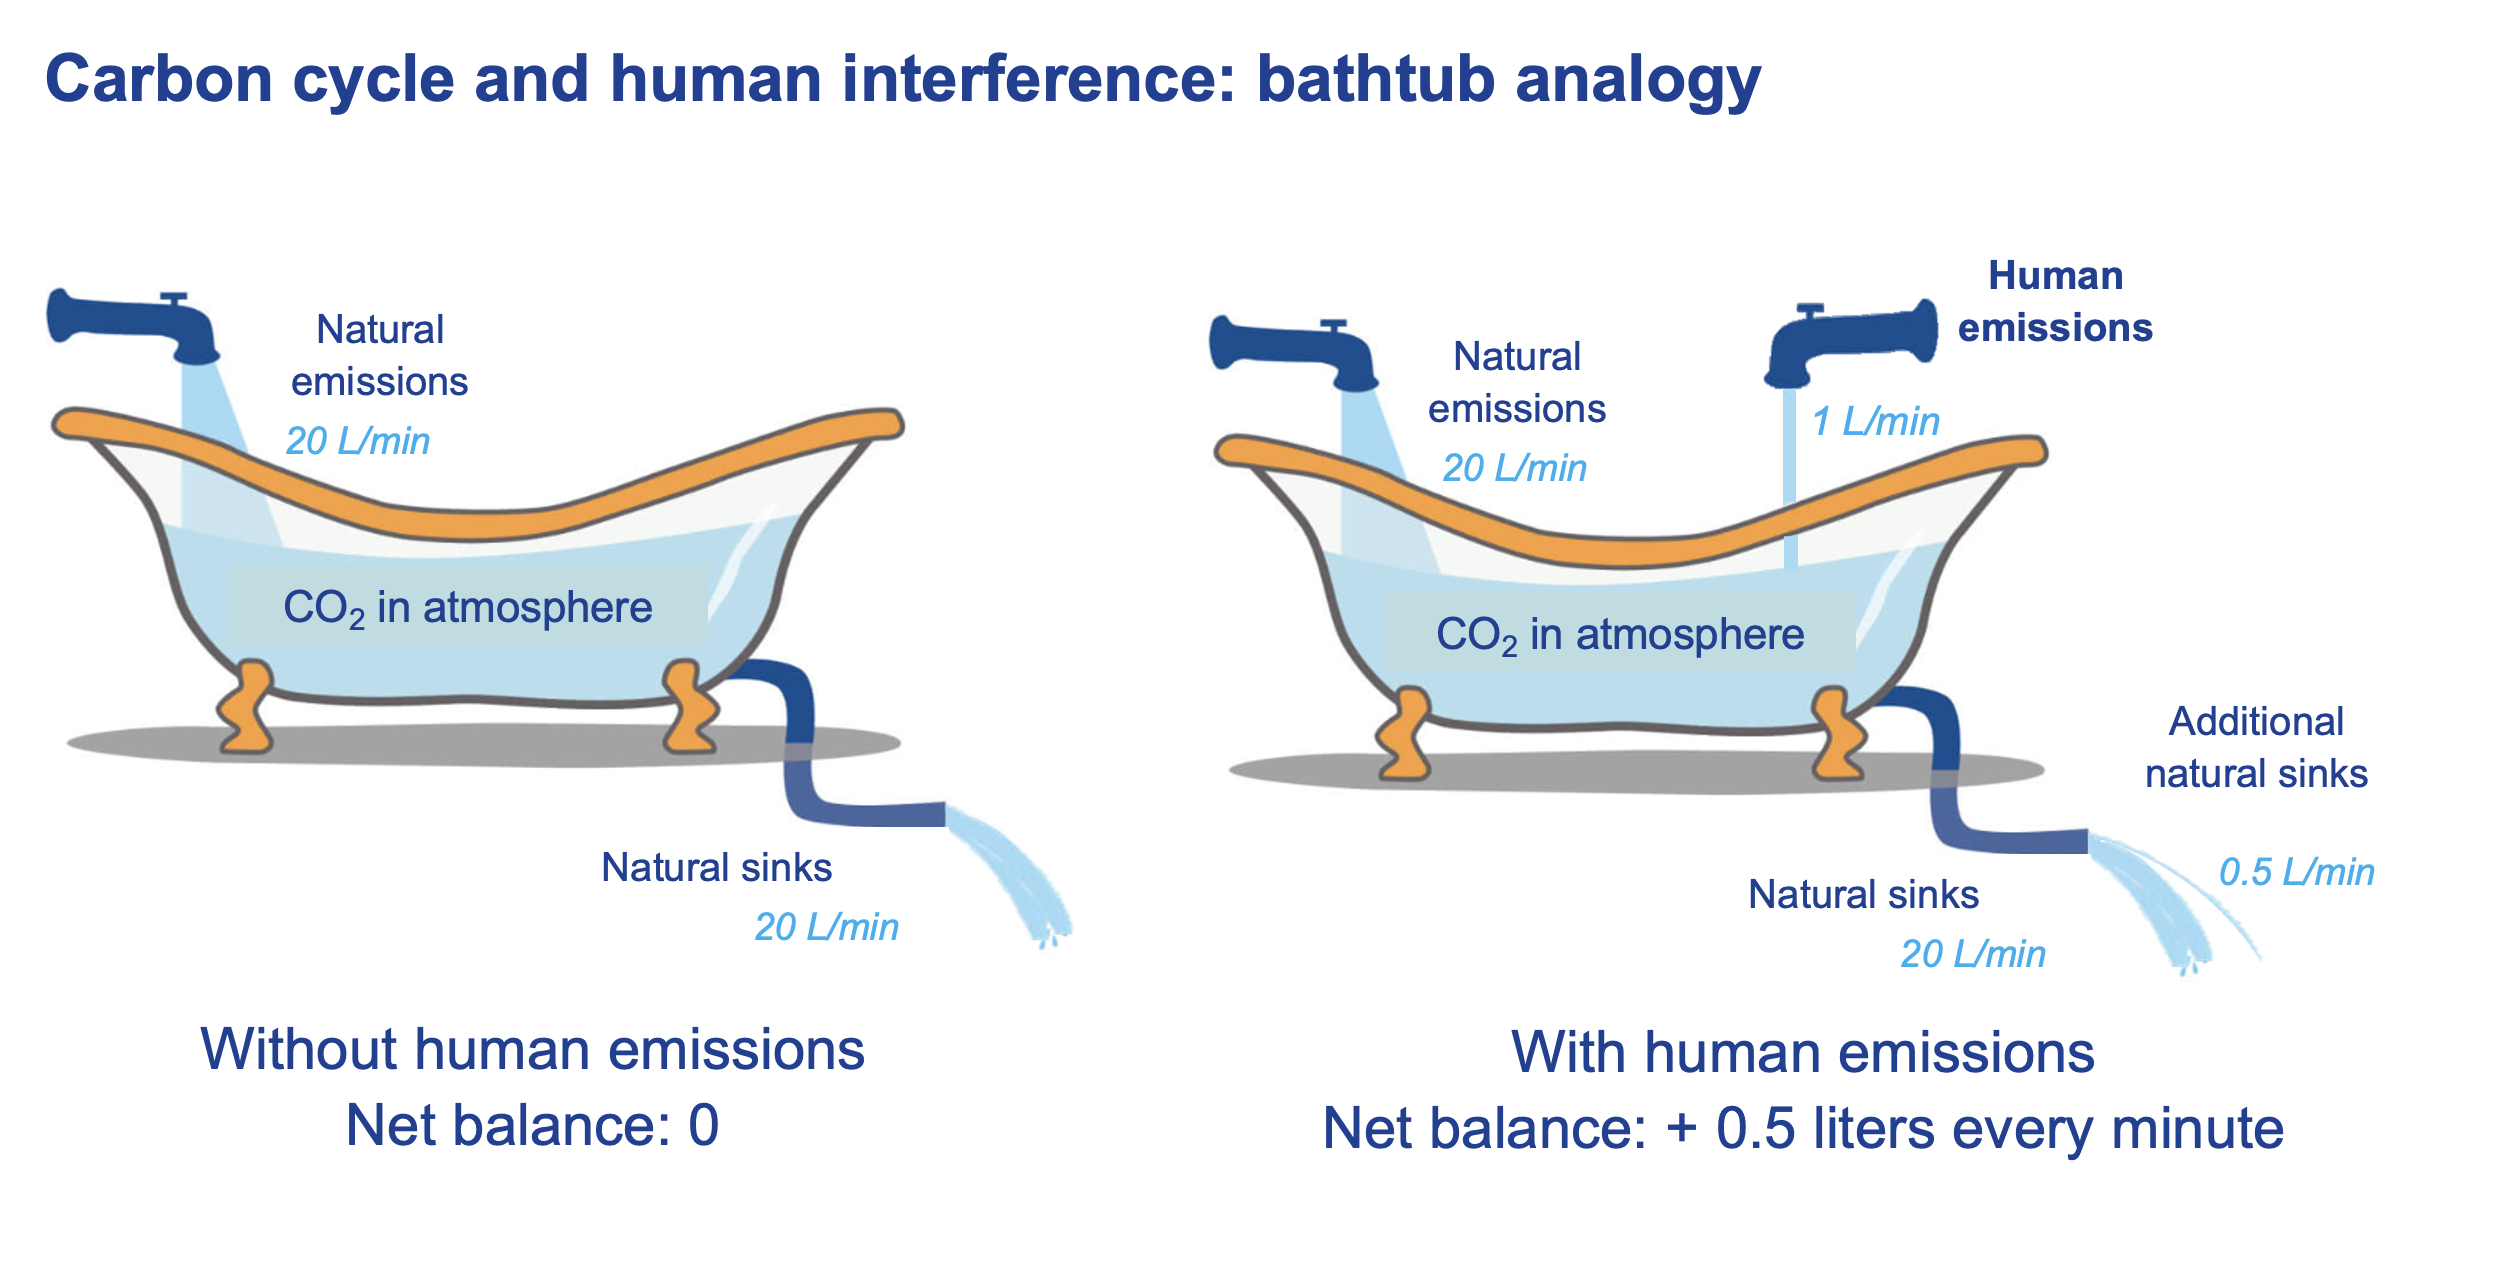
Figure 4: Modified from Climate interactive.
Is it possible for Koutsoyiannis' claim to hold true, that the increase in natural emissions caused by rising temperatures - more than three times greater than human emissions - is the dominant factor explaining the increase in atmospheric CO2?
Verifying this is not difficult using well-known data on the carbon cycle. And here's where the problem lies. If Koutsoyiannis' thesis were true, it would follow that: (i) the increase in CO2 in the atmosphere would be at least three times higher than human emissions and (ii) natural processes would be a net source of CO2 emissions. It's easy to verify that both these consequences are not occurring at all: the increase in CO2 in the atmosphere is less than half that of human emissions, which means that natural processes can only be a net CO2 sink (not a net source as claimed by Koutsoyiannis). This sink is mostly because the additional CO2 in the atmosphere stimulates photosynthesis on land and dissolution of CO2 in the ocean surface waters.
Another important verification can be done by analyzing carbon isotopes: different sources of CO2 have their own unique isotopic fingerprints. CO2 from the fossil fuel burning doesn't have carbon 14 (14C), and CO2 from terrestrial plants has less carbon 13 (13C) than from the ocean. Since fossil fuels are derived from ancient plants, they also have less 13C isotopes. Using this information, scientists can figure out why trends in 14C and 13C occur. Isotope data from ice cores show a decrease in the 13C/12C ratio since the beginning of the industrial era, which clearly indicates that the excess CO2 comes from fossil carbon, not from biogenic sources, as illustrated in the figure below.
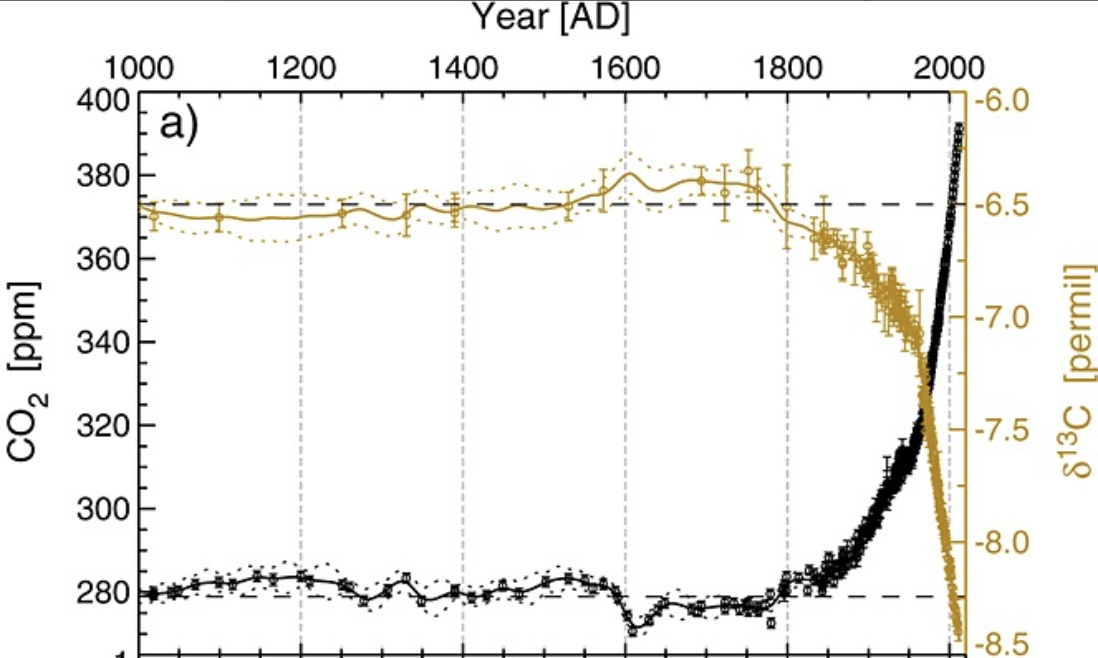
Figure 5: from Rubino et al. 2013
Further confirmation of the role of fossil fuels can be drawn from ocean acidification and the decreasing trends in O2 levels, as explained here.
In short, there's simply no doubt that Koutsoyiannis has made a glaring mistake
But then, how should we interpret the correlations between temperature increase and the subsequent increase in atmospheric CO2 concentration found in Koutsoyiannis study?
Simply put, the interannual anomalies of atmospheric CO2 are influenced by climatic variability, mediated for example by El Niño, the cyclical warming of the equatorial Pacific that impacts global climate, including the productivity of terrestrial ecosystems and the frequency of fires. This affects the net amount of CO2 absorbed by terrestrial ecosystems in a given year, and thus the amount of CO2 remaining in the atmosphere. Is this groundbreaking? Well, not really: over the last 30 years, numerous studies have explored the relationship between climate variability and the global carbon cycle (for example, here, here, here or here), and the IPCC first reported on this in its third assessment, more than 20 years ago (IPCC TAR WG1 chapter 3, figure 3.3, 2001, reproduced below). Every IPCC report published since (4th, 5th and 6th IPCC assessments) summarised our knowledge on interannual variability of the carbon cycle and reaffirmed the clear role of climate variability on the land carbon fluxes on interannual time scales.
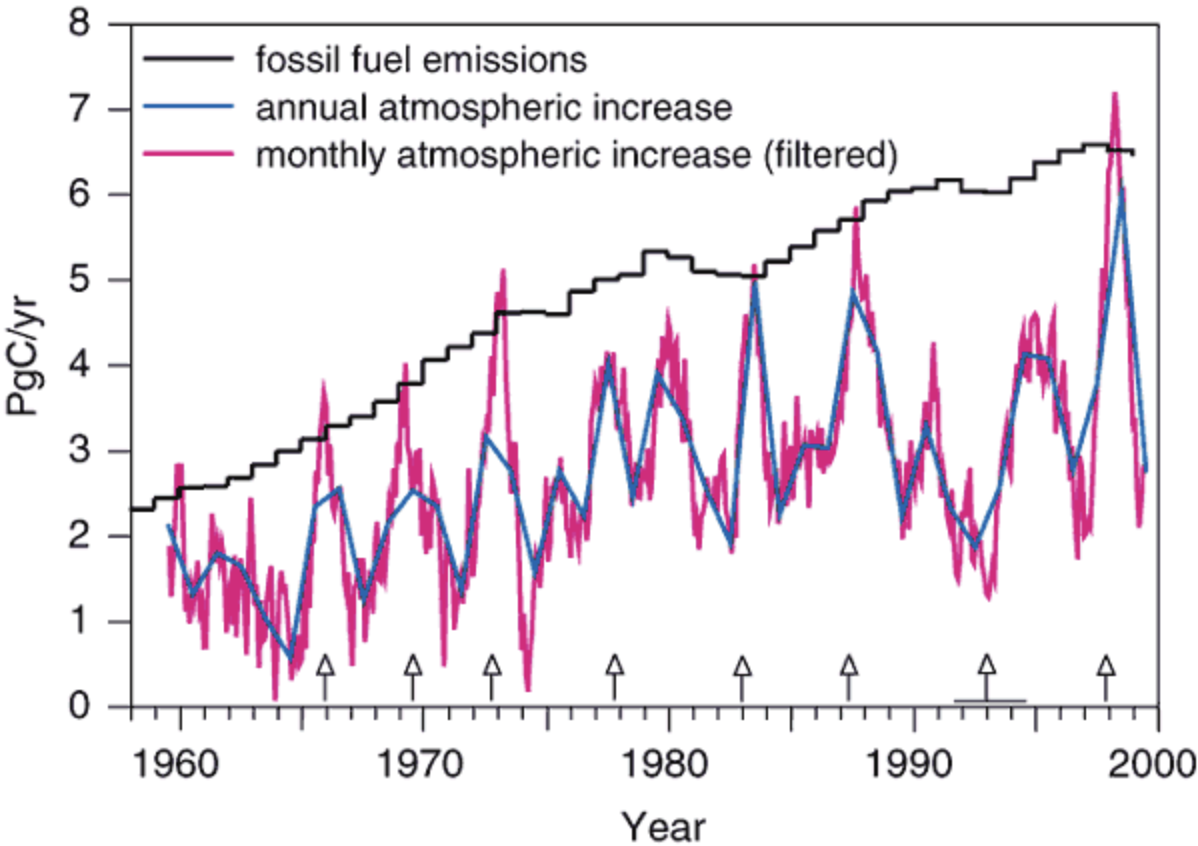
Figure 6: From IPCC TAR, WG1, chapter 3
In summary:
- The observed increase in atmospheric CO2 over the last 150 years is due to human emissions (fossil fuel and deforestation). This is evidenced by the growth rate of atmospheric CO2, the observed decline in atmospheric carbon isotopes (13C and 14C) and the observed decline in atmospheric oxygen. A natural net source of CO2 would not be consistent with those observations.
- The average atmospheric CO2 growth rate is lower than human CO2 emissions: less than half (45%) of emissions remains in the atmosphere.
- The land and the ocean are net sinks of CO2: they currently remove about 55% of the CO2 emitted by human activities. These sinks are primarily due to the atmospheric CO2 increase. Warming tends to reduce these sinks.
On interannual time scales, variations in the atmospheric CO2 growth rate are driven by the climate variability. El Niño years have larger than average atmospheric CO2 growth rates, while the opposite occurs during la Niña years. The fact that on short interannual time scales climate anomalies drive the carbon cycle anomalies in the atmospheric CO2 growth rate does not imply that climate is responsible for the long-term CO2 increase.
Some of the observations above are included in this study, in response to previous works by Koutsoyiannis, where it is noted that the correlation between CO2 and temperature strongly depends on the timescale used. While it's known that atmospheric CO2 fluctuations over a couple of years are caused by temperature variations, in the medium term, it's CO2 that typically drives the correlation (as in the last few decades, due to fossil fuels), while in the long term, other factors may determine temperature variations (such as orbital changes for glaciations), with CO2 simply representing a positive feedback.
In conclusion, the data are very clear: it's the use of fossil fuels that has caused the increase in atmospheric CO2 in recent decades, reaching levels not seen in at least 800,000 years. Natural systems represent a net absorption of CO2: by slowing the increase of CO2 in the atmosphere, they cannot be the cause of it. The interannual variability of this net absorption is influenced by temperature, which consequently indirectly influences the interannual variability of CO2 accumulation in the atmosphere.
Imagine acting with your right foot on the accelerator (CO2 emissions from fossil fuels) and with your left foot on the brake (CO2 absorption by natural systems). The accelerator is constantly pressed while the pressure on the brake fluctuates. It's evident that the oscillation on the brake influences the speed (CO2 accumulation in the atmosphere), but it would be wrong to conclude that the left foot is the cause of the speed. Yet, this is what the study by Koutsoyiannis et al. does, confusing the brake with the accelerator.
Statistics is an essential tool in much of scientific work. Occasionally, it can be used to draw conclusions incompatible with the reality we know beyond any reasonable doubt. Being an expert in one discipline (such as statistics) does not authorize drawing important conclusions in areas where one lacks expertise. Breaking this simple rule can lead to scientifically embarrassing missteps.


Good article!
Koutsoyiannis et al. have made essentially the same mathematical blunder that Murray Salby did ten years ago (and he was far from being the first), which I covered here:
https://skepticalscience.com/salby_correlation_conundrum.html
Correlations are insensitive to constant offsets in the two signals on which it is computed. The differencing operator, Δ, which gives the difference between successive samples converts the long term linear trend in the signal to an additive constant. So as soon as you use Δ on both signals, the correlation can tell you precisely nothing about the long term trends.
When the earlier work was published in Proceedings of the Royal Society A, I communicated this error to both the authors of the paper and the editor of the journal. The response was, shall we say "underwhelming".
The communication (June 2022) included the observation that atmospheric CO2 levels are more slowly than the rate of fossil fuel emissions, which shows that the natural environment is a net carbon sink, and therefore the rise cannot be due to a change in the carbon cycle resulting from an increase in temperature. It is "dissapointing" that the authors have published a similar claim again (submission recieved 17 March 2023) when they had already been made aware that their claim is directly refuted by reliable observations.
[BL] Link activated.
The earlier paper by Koutsoyiannis et al.
which seems somewhat ironic at this point.
Yes, this blog post does a really good job of outlining the correct scientific background on atmospheric CO2 rise, and pointing out the glaring error that Koutsoyiannis et al have made.
The recent paper is a rehash of an earlier Koutsoyiannis paper that is allude to but not specifically linked in the OP and comments. The OP does subtly link to a rebuttal publication of that earlier work (link repeated here... You'll have to verify you're not a robot to get to the paper). As Dikran has pointed out, the authors appear to have doggedly refused to accept their error.
Both the current Koutsoyiannis et al paper and the earlier one have threads over at PubPeer:
...and as Dikran mentions, this basic error is an old one, being repeated again and again in the contrarian literature on the subject. Two Skeptical Science blog posts from 11 and 12 years ago discusses this and similar errors. Plus ca change...
The blog And Then There's Physics also posted a blog on the earlier papers.
The importance of the differencing scheme used by Koutsoyiannis et al cannot be overstated. I hate to inject that dreaded word "Calculus" into the discussion, but if you'll bear with me for a moment I can explain. Taking differences (AKA detrending) is that dreaded Calculus process called differentiation - taking the derivative. This tells you the rate of change at any point in time - but it does not tell you how much CO2 accumulates over time. To get accumulation over time, you need to sum those changes over time - in Calculus-speak, you need to integrate.
The catch is, as Dikran points out, that taking differences has eliminated any constant factor - in Calculus-speak, the derivative of a constant is zero. And when you turn around and do the integration to look at how CO2 accumulates over time (basically, undo the differentiation), you need to remember to add the constant back in. Koutsoyiannis et al fail to do this, and then make the erroneous conclusion that the constant is not a factor. Their method made it disappear, and they can't see it as a result. David Copperfield did not actually make that airplane disappear - he just applied a method that hid it from the sight of the audience. (Of course, David Copperfield knows the airplane did not disappear, and is just trying to entertain the audience. In contrast, it appears that Koutsoyiannis et al are fooling themselves.)
At least introducing Calculus to the discussion give me a chance to mention one of my two math jokes. (Yes, I know. "math joke" is an oxymoron. Don't ask me to tell you the one about Noah and the snakes.)
To continue, one nice new example that appears in this blog post is the accelerator versus the brake analogy. The OP does a nice job of describing the natural carbon cycle, pointing out that the natural portions of the cycle include both emissions and removals - adding to and subtracting from atmospheric CO2 storage.
Koutsoyiannis et al basically assume that if there are changes in atmospheric CO2, they must be linked to something that changed emissions. As the OP points out, the likelihood is that the correlation Koutsoyiannis et al see (in the short-term detrended data set they massaged) is more likely related to changes in natural removals.
Once again, Koutsoyiannis et al do not realize the limitations of their methodology, ignore a well-known physical process in the carbon cycle (rates of natural atmospheric CO2 removal), and attribute their correlation to the wrong thing. The right thing isn't in their model (statistical method) or thought-space (mental model), so they don't see it.
The OP's bathtub analogy is useful to see this. The diagram (figure 4) looks at the long-term rise in bathtub level (CO2 rise), but it is easy to do a thought experiment on how we could introduce short-term variability into the water level. There are three ways:
The bathtub analogy is similar to the water tank analogy that is used in this SkS post on the greenhouse effect. The primary analogy in that post is a blanket, but the level of water in a water tank appears further down the page.
In short, the Koutsoyiannis et al paper ignores known physics, fails to incorporate known physics in their methodology, and comes to incorrect conclusions because the correct conclusion involves factors that were eliminated from their analysis from the beginning.
From the Koutsoyiannis et al. abstract: "According to the commonly assumed causality link, increased [CO2] causes a rise in T. However, recent developments cast doubts on this assumption by showing that this relationship is of the hen-or-egg type, or even unidirectional but opposite in direction to the commonly assumed one."
"Commonly assumed"? I don't think so. The link between CO2 and Temp is shown by a wealth of actual physical evidence. There is no question that Temp increases can cause CO2 increases and that the opposite ("commonly assumed causality link") relationship is also true: CO2 inc. can cause Temp inc. Koutsoyiannis et al. seem to be saying that their study proves that the causality relationship can only be "unidirectional": Temp inc cause CO2 increases.
It is all very strange. They seem to be trying to answer questions about climate science which have very solid answers already from different lines of evidence. Is their statistical magic a new line of evidence which overturns the vast majority of climate science? I doubt it.
But, since we're on the subject of hens and eggs, this paper reminds me of an old Looney Tunes cartoon starring the rooster Foghorn Leghorn and the highly intelligent little chick, Egghead, Jr. Foghorn is babysitting little Egghead and they decide to play hide and seek. Egghead starts counting while Foghorn hides in a large "Feed Box". When Egghead finishes counting he gets out a slide rule and a pencil and paper and runs some calculations to try to locate Foghorn. He grabs a shovel and starts digging a hole nowhere near the Feed Box. With his last final tug on the shovel handle Foghorn pops out of the hole, flabbergasted.
Foghorn Leghorn-Hide and Seek: https://www.youtube.com/watch?v=jMyD3TSXyUc
I think Koutsoyiannis et al. think they are like Egghead, Jr and have come up with some magical statistics which override our physical reality. Maybe their calculations would work in Looney Tunes land. But they don't work in the climate system we are familiar with.
An easy way to test whether today's atmospheric temp inc. are causing today's rise in CO2 levels might be to look at this chart of data from the EPICA ice core:
From this SkS rebuttal: https://skepticalscience.com/co2-lags-temperature-intermediate.htm
Yes indeed, some of the CO2 inc during glacial-interglacial cycles was caused by Temp inc first. Koutsoyiannis et al. would have us believe that the current huge increase in CO2 in the atmosphere is also caused by Temp inc first.
Where is this huge increase in Temp?
David @ 5:
Yes, that wording of "commonly assumed" in the Koutsoyiannis paper is rather telling. Either they are unaware of the carbon cycle and climate science work that has gone into the understanding of the relationship between CO2 and global temperature, or they are using a rhetorical trick to wave away an entire scientific discipline as if it is an "assumption".
That Looney Tunes clip has one more snippet that I think applies to Koutsoyiannis et al: at the end Foghorn Leghorn says "No, I'd better not look". I think that Koutsoyiannis et al did that with respect to learning about the science of the carbon cycle: "No, I'd better not look".
David @ 6:
Yes, the point you make about how glacial cycles show CO2 and T variations that would imply a huge temperature increase is needed over the last century to cause the observed rise in CO2 is discussed in the PubPeer comments on the earlier paper.
The earlier paper used the UAH temperature record that only covers very recent times (since 1979). The new paper also looks at temperature data starting in 1948 - but temperature data from re-analysis, not actual observations.
If their statistical technique is robust, then they should come up with the same result from the glacial/interglacial cycles of temperature and CO2...
...but their methodology is devoted to looking at the short-term variation, not the long-term trends. Our knowledge from the glacial/interglacial periods has much lower time resolution. Different time scale, difference processes, different feedbacks, different causes. That does not fit with their narrative of "The One True Cause".
A purely statistical method like Koutsoyiannis et al cannot identify "cause" when the system has multiple paths and feedbacks operating at different time scales.
The most powerful message of the paper Koutsoyiannis et al (2023) 'On Hens, Eggs, Temperatures and CO2: Causal Links in Earth’s Atmosphere' is their "Graphical Abstract" which is reproduced in the OP above as Figure 1.
They are not the first to try and use these data to suggest increasing CO2 is not warming the planet. And likely there will be other fools who attempt the same in the future.
So what does their "Graphical Abstract" show?
The graphic below is Fig2 of Humlum et al (2012) which insists this same data shows that CO2 lags temperature and not the other way round.
The data that is missing is the ENSO cycle which precedes both the T and the CO2 wobbles and thus drives global temperature wobbles and, by shifting rainfall patterns, drives CO2 wobbles. To suggest (as Koutsoyiannis et al do) that such "analyses suggests a unidirectional, potentially causal link with T as the cause and [CO2] as the effect" is simply childish nonsense.
As MAR points out in comment 9, Koutsoyiannis et al ignore ENSO as a possible factor in their analysis.
Is ENSO a factor in global temperatures? Yes. Tamino has had several blog posts on the matter, where he has covered the results of a paper he co-authored in 2011, with updates. The original paper (Foster and Rahmstorf, 2011) looked at the evolution of temperatures from 1979-2010, and determined that much of the short-term variation is explained by ENSO and volcanic activity. After accounting for ENSO and volcanic activity, a much clearer warming signal is evident.
Tamino recently updated this analysis, with modified methodology and covering a longer time span (1950-2023). This method turns this:
to this:
Now remember: Koutsoyiannis et al used differenced/detrended data in their analysis, which means that they have removed any long-term trend and fitted their analysis to short-term variations. If you remove the short-term effects due to ENSO, Koutsoyiannis et al will have a temperature signal with a lot less variation. That means they have a lot less ΔT to "cause" CO2 changes. Their physics-free "causality" gets stretched even thinner (if this is possible with an analysis that is already broken).
RE: my comment 10:
Now, if Koutsoyiannis et al want to claim that ENSO effects on temperature are irrelevant - i.e., that it does not matter if the temperature variation is due to ENSO, volcanoes, or fairy dust, etc. - then they can try to make that claim. But then they are breaking the chain of causality.
Causation has to start somewhere, and their "unidirectional, potentially causal link with T as the cause..." is basically ignoring any previous cause. By ignoring anything else, they fail to consider the possibility that both T and CO2 are responding to something else (hello, ENSO!). And, of course, they ignore the possibility of feedbacks, where two or more factors affect each other - i.e., the world is not unidirectional.
Bob, @7:
Ha-ha, yes, good catch, re. Foghorn's quantum-state delimma (as it were) and Koutsoyiannis et al's refusal to look at the bleedingly obvious climate science found in Foghorn's Feed Box.
Since we are using cartoons to represent Koutsoyiannis et al's thought process, today's XKCD cartoon seems appropriate. (As usual with XKCD, if you follow the link to the original web page, you can hover over the cartoon to get additional insight.)
https://xkcd.com/2945/
Here’s a simple way to look at the Koutsoyiannis paper… It claims that the data from 1980-2019 has correlations demonstrating that temperature changes drive CO2 and no correlation supporting CO2 driving temperature. He then concludes that this proves CO2 changes can’t drive temperature changes. There is a leap here from not seeing an effect in a 39-year period to the conclusion that it doesn’t happen.
The temperature drives CO2 side of the relationship occurs when something else such an El Nino, solar cycles, etc. causes a temperature change which causes a change in the degassing rate from oceans and that causes CO2 levels to change. These events occurred during the 39-year period and are shown in the Koutsoyiannis analysis.
The CO2 drives temperature side of the relationship occurs when something causes the CO2 concentration to change which modifies the strength of the greenhouse effect and this changes the temperature. Humans were emitting CO2 at a steadily increasing rate during the 39-year period and it is not clear that there were any changes in the rate of CO2 emissions that were significant enough to cause the temperature shift that would be detectable by Koutsoyiannis.
The mechanism used in the paper to look at shifts in the moving difference between values and the previous 5-year average will not detect a steadily increasing CO2 concentration causing a steadily increasing temperature. The paper is focused on the cause-and-effect of shorter-term fluctuations. The paper only shows that all the short-term changes during the monitoring period were the result of temperature changes driving CO2. The claim that this proves CO2 doesn’t drive temperature is unjustified.
Keith R @14,
You are correct that the Koutsoyiannis paper does not assess the on-going +2ppm/yr of CO2 resulting from fossil fuel use (less the ocean and biosphere draw-down).
But your comment has goaded me into a back-of-fag-packet assessment of how much out-gasing the wobbles in the global temperature record would actually achieve. (I'd reckon beforehand it would be exceedingly tiny.)
If the last ice age saw CO2 rise by about 100ppm and global temperature rise about +4ºC, that would suggest a big El Niño-induced temperature rise of +0.4ºC would see CO2 rise 10ppm but only if equilibrium was achieved (which would take about a millenium).
An El Niño temperature wobble is up-&-down in a single year so there is of course no equilibrium. The out-gasing would be greater earlier and quickly tail off: say 50% happening in the first century, so 5% in the first decade and 0.5% in the first year? That would suggest an out-gasing CO2-rise resulting from a +0.4ºC temperature rise in temperature following a big El Niño of just 0.05ppm.
The actual CO2 wobbles the Koutsoyiannis paper relies on being temperature-induced out-gasing (and not drought-induced reductions in forest growth) are about 1ppm. So "exceedingly tiny" is a good description.
Why don't we see a higher temp spike along with the very high CO2 spike in the graph in 6? It seems CO2 is not influencing T at all.
rkcannon @ 16:
What on earth are you talking about? Figure 6 does not have temperature in it, so what temperature graph are you referring to? And figure 6 is showing short-term variation that includes annual or shorter times. It is a rate of change graph, not a cumulative storage graph. And which "very high spike" are you referring to? What year?
...and are you seriously thinking that every temporary spike in CO2 (really, rate of CO2 change, if you are using figure 6) will lead to a temperature spike? It takes time for global temperatures to change. The atmosphere alone has a sufficiently large heat capacity that it takes months for an energy imbalance of a few W/m2 to reach a new equilibrium. If you take the shallow ocean mixed layer (<100m depth), the heat capacity means it take a decade or two for it to adjust. When you take the deeper ocean into account, the time lag increases proportionally.
...and CO2 is not the only factor affecting temperature. especially on the shorter time scales.
By thinking that every little short-term spike in CO2 has to correlate with a spike in temperature, you are making exactly the sort of basic error that Koutsoyiannis et al have made (several times). Koutsoyiannis has assumed that there is only one cause in one direction at all times scales, and has completely ignored the multi-factor and multi-time-scale nature of the carbon cycle and global temperature - and done it using a technique that removes the multi-decade slow rise in CO2 and how it correlates with global temperature.
It seems that you are not looking at the whole system, and focusing narrowly on some tiny feature that you think disproves the big picture.
Bob Loblaw @ 17:
He's clearly referring to the graph in post 6, not figure 6. It took me 20 seconds to realize this - perhaps you could have taken 20 seconds of your own time before jumping down his throat?
And by the way, his question is a reasonable one and deserves a civil reponse. Using language like 'what on earth...?', 'are you seriously thinking..?', '..some tiny feature that you think..' are hardly conducive to constructive debate.
And if you'd actually read Koutsoyiannis et al, you would know that they absolutely do not say or even imply 'that there is only one cause in one direction at all time scales'.
Mark Johnson @ comment 18:
No, rkcannon @ 16 is not clearly referring to anything specific. For his first comment on this thread, he just comes up with one statement (in two sentences), and can't be bothered to tells us whether he's looking at the original post, or one of the comments? Did he put more than 20 seconds of thought into his question?
Even if we look at the graph in comment 6, which spike is he referring to? Possibly the last one, but he has not take the time to write a clear comment explaining exactly what he is looking at or explain his reasoning. And he has not returned to clarify what he means - which I asked him to do.
rkcannon has a history here. which includes several occasions of throwing out one-liner "gotcha" kinds of questions, and then not bothering top engage in any constructive discussion when his errors are pointed out. That behaviour is "hardly conducive to constructive debate".
And yes, I have read the Koutsoyiannis paper referred to in this post. I have also read the comments on that paper and an earlier one on PubPeer, as I indicated in comment 3. The comment from rkcannon @ 16 comes on the heels of one he made on another thread. In that thread, rkcannon quoted the abstract of another Koutsoyiannis paper (emphasis added):
Similar statements appear in several Koutsoyiannis papers. The statistical technique used by Koutsoyiannis is incapable of detecting multi-directional processes, and it is incapable of detecting correlations at multiple time scales. Even though Koutsoyiannis et al do not state it or imply it, it is an essential characteristic of their method. The fact that they do not even realize this is why Koutsoyiannis keeps producing papers that contain the same basic error. In essence, they have assumed their conclusion as a result of their methodology.
Mark Johnson, this is an example of why it's wise to lurk awhile before before commenting here. Your comment may seem reasonable to newcomers, but amounts to tone trolling when one considers rkcannon's history of gratuitous denialism. Believe it or not, there are professional disinformers out there taking advantage of naive expectations like yours.
Mark Johnson:
To understand the fundamental error made by Koutsoyiannis, I suggest you go to the PubPeer discussion of an earlier paper that I referenced in comment 3. In particular, read the second comment on that discussion, where Gavin Cawley (who posts here as Dikran Marsupial - e.g., comment #1) demonstrates how the methodology used by Koutsoyiannis is utterly incapable of telling the difference between three different signals - one with a steady increase, one with a steady decrease, and one with no long-term trend.
Since Koutsoyiannis' methodology is incapable of telling the difference in trend between those three signals, it is by definition incapable of helping decide whether the past century of generally increasing CO2 and generally increasing temperature are related in any way.
rkcannon @16.
Assuming Mark Johnson @18 is correct and you do refer to the graphic posted @6 (which seems entirely sensible), your question has still not been properly addressed.
And that presumably is to ask why the CO2 fluctuations through recent ice ages (180ppm to 280ppm) are associated with large temperature fluctuations (10ºC peak-to-peak) but the larger recent anthropogenic CO2 (280ppm to 420ppm) doesn't result in any commensurate temperature increase in the graph.
There are a number of factors to consider.
(1) The forcing from changes in CO2 is logarithmic, so the recent CO2 forcing would be slightly smaller than the ice age forcing (2.2Wm^-2 as opposed to 2.4Wm^-2).
(2) It takes time for the temperature to react to an imposed forcing so only about two-thirds of any CO2-forced increase would have occurred in the decades of man-made warming so far.
(3) The ice age CO2 forcing was not the major forcing through ice ages. The change in albedo due to the shrinking ice sheets and the rising oceans would be double the CO2 forcing. Other factors like methane and dust were also in play. (The orbital forcing that triggers ice ages is very minor.) Increasing CO2 contributed perhaps a third of the ice age forcings.
(4) The temperatures being plotted are from the EPIC ice core data and thus Antarctic temperatures which wobbled tiwce as much as global temperatures through the ice ages. (Note the modern CO2 value has been added, marked with an asterisk. Grafting on the modern EPIC temperature record would be difficult, and would not show much as the instrument record is more wobble than rise.)
So taking (1) to (4) into account, the 10ºC ice age cycle in the graphic @6 would be a little smaller, say 90% (1) then a third off (2) then two-thirds off (3) and finally halved (4). So the global temperature should be very roughly something like [10ºC x 0.9 x 0.67 x 0.33 x 0.5 =] +1ºC which is pretty-much what we see globally today.
MA Rodger @ 22:
Although that may seem to answer the direct question that rkcannon asks in comment 16, he finishes that comment by saying "It seems CO2 is not influencing T at all." To come to such a conclusion, it seems that he simply does not see or rejects all the synchronous rises and dips in the CO2 and temperature lines that precede that last spike. The explanation of those synchronous CO2 and T changes involves both T leading to an increase in CO2, followed by CO2 causing further increases in T.
David Kirtley's comment @ 6 is intended to challenge the argument that only T causes all the CO2 increase, all the time. If so, then why do we not see a huge increase in T before the recent large increase in CO2?
rkcannon appears to be ignoring any cause-effect for the previous cycles of T/CO2, and only looks at the last spike.
I saw "appears", because rkcannon has not bothered to return to this discussion to clarify his question or comment. We can speculate about what he really meant until the cows come home, but he is the only one who can really tell us.