


 Arguments


What is causing the increase in atmospheric CO2?
What the science says...
| Select a level... |
 Basic
Basic
|
 Intermediate
| |||
|
There are many lines of evidence that clearly show that atmospheric CO2 has increased to the highest levels seen in 800,000 years due to human behavior. Observational evidence indicates that this increase is caused by humans because the rise in CO2 levels is consistent with recent industrial trends and emissions are largely linked to the burning fossil fuels. |
|||||
Climate Myth...
CO2 increase is natural, not human-caused
"Salby is arguing that atmospheric CO2 increase that we observe is a product of temperature increase, and not the other way around, meaning it is a product of natural variation..." (Anthony Watts)
CO2 Levels are Higher Than They’ve Been in 800,000 Years
Atmospheric CO2 has increased by more than 100 parts per million since the Industrial Revolution in the mid-1700s, when humans began burning fossil fuels like coal and oil. Human activity has increased CO2 to levels not seen in the past 800,000 years.
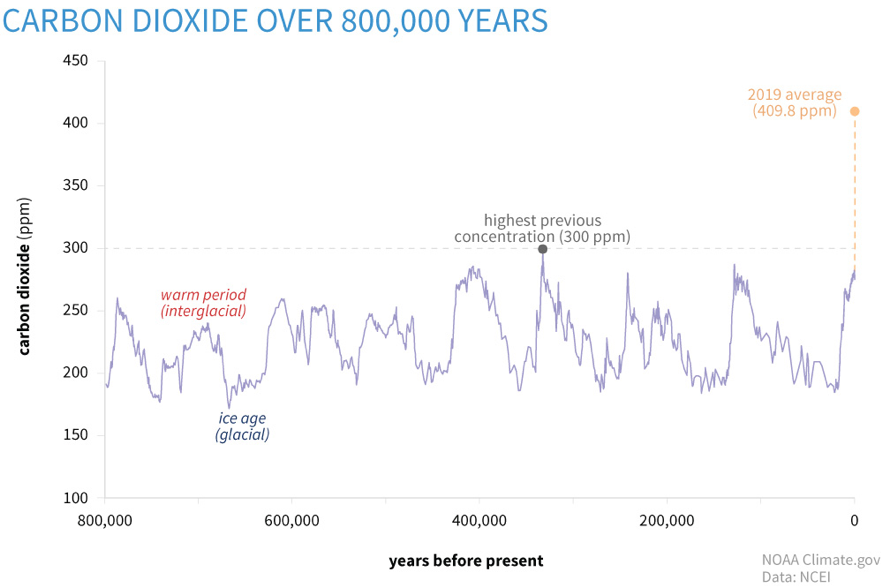
Figure 1: Atmospheric CO2 concentrations in parts per million (PPM). Levels have peaked throughout time but we’ve seen a steep increase of 100 PPM since the industrial revolution, Climate.Gov
To understand atmospheric CO2 levels, we must look to the carbon cycle. The carbon cycle allows us to track the CO2 being emitted into the atmosphere and absorbed by the planet.
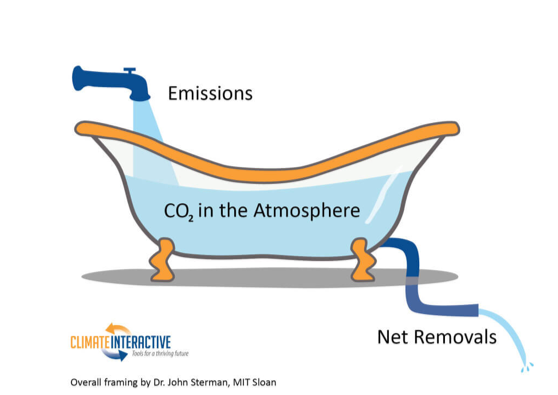
Figure 2: Bathtub Simulation, Climate Interactive
A common analogy for this is a sink or bathtub. When you turn on a faucet, water flows into the basin and out through a drain. As the amount of water in the basin increases, more pressure is put on the drain, and therefore more water releases from the drain. The carbon cycle works in a similar way. As more CO2 (water from a faucet) is released into the atmosphere (the basin), more CO2 is naturally absorbed by the planet (the drain). In addition to the atmosphere, the planet has three main carbon reservoirs which include the solid earth, the land surface, and the ocean. Natural glacial and interglacial cycles over the last 800,000 years have worked to move CO2 between the atmosphere and these reservoirs, specifically the ocean reservoir.
Figure 1 shows that CO2 levels were lower during the glacial periods (180 PPM) and higher during warmer interglacial periods (280 PPM). Since the Industrial Revolution, there is a visible difference in CO2 level measurements in the “basin” (aka the atmosphere). This could be caused by either an increase in emissions from the “faucet” or decreased net removals in the “drain.” Below we will take an in-depth look at the scientific evidence that net removals are actually increasing, and therefore the recent atmospheric CO2 increase must be due to an increase in emissions.
The Climate Myth Ignores Evidence of Human’s Role in Increasing CO2
Take a close look at the myth and you’ll see that the argument being made implies that humans aren’t the cause of recent CO2 increases because the increase is natural. Instead, the myth suggests that global warming is the cause of the CO2 increase and further, that global warming is occurring naturally. This commits the fallacy of “slothful induction” or ignoring relevant information to come to a conclusion. In this case, the myth ignores multiple sources of observational evidence that burning fossil fuels has caused increased atmospheric CO2 levels.
Ocean are Becoming More Acidic
We know nature is not the source of growing CO2 levels in the atmosphere because land and ocean CO2 storage has increased. One way that we know the planet’s “drain” is absorbing increased levels of CO2, is by looking at our oceans.
The oceans store the largest amount of the Earth's carbon, so if the atmospheric CO2 increase were "natural", it would likely be coming from the oceans. But we know the CO2 increase is not coming from the oceans because the pH of the oceans is dropping (a.k.a. ocean acidification).
When CO2 is absorbed into a solution, it binds with a water molecule to form a molecule of carbonic acid (H2CO3)
Carbonic acid [H2CO3] has a rather strong acidifying effect in that 95% of it turns into bicarbonate [HCO3-]. This loss of an H+ ion causes the ocean pH to decrease.
In short, CO2 could be coming from the ocean, but falling pH shows that it’s not. Instead, our oceans are absorbing more carbon than they are releasing.
Isotopic Signature Shows Increased Fossil Fuels Emissions in Atmosphere
Isotopic evidence points to fossil fuels as the source of CO2 emissions. Carbon is composed of three different isotopes: carbon-12, 13, and 14. Carbon-12 is by far the most common, while carbon-13 is about 1% of the total, and carbon-14 accounts for only about 1 in 1 trillion carbon atoms in the atmosphere.
CO2 produced from burning fossil fuels or burning forests has a different isotopic composition than CO2 in the atmosphere. This is because plants have a preference for the lighter isotope (carbon-12); thus they have lower carbon-13 to 12 ratios. Since fossil fuels are ultimately derived from ancient plants, plants and fossil fuels all have roughly the same carbon-13 to 12 ratio – about 2% lower than that of the atmosphere. As CO2 from these materials is released into, and mixes with, the atmosphere, the average carbon-13 to 12 ratio of the atmosphere decreases.
Reconstructions of atmospheric carbon isotope ratios from various proxies, such as tree rings and ice cores, have determined that the carbon-13 to 12 ratios in the atmosphere are the lowest today than they’ve been in the last 10,000 years. Furthermore, the carbon-13 to 12 ratios begin to decline dramatically just as the CO2 starts to increase — around 1850 AD. This is exactly what we expect if the increased CO2 is in fact due to fossil fuel burning beginning in the Industrial Revolution. These isotopic observations confirm that the increase in atmospheric CO2 comes from plant-based carbon, not from the oceans or volcanoes.
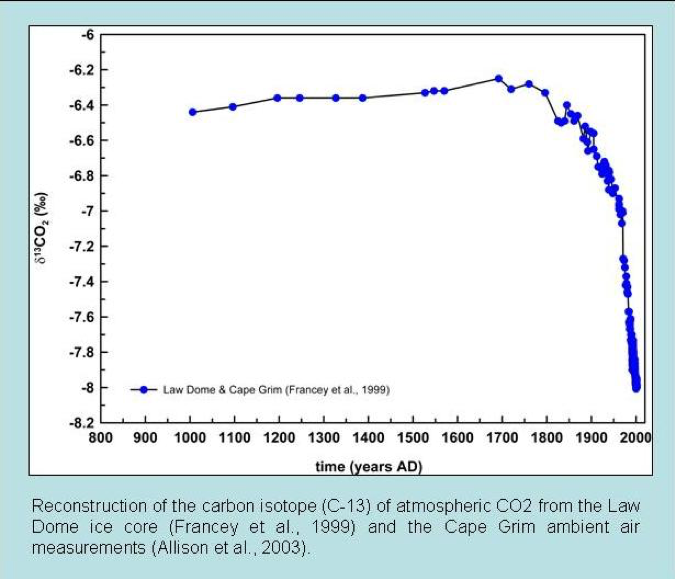
Figure 3: Ice core carbon isotope measurements of atmospheric CO2
Some argue that the carbon-13 ratio isn't unique to fossil fuels. However, because the carbon-14 ratio has also decreased significantly (Figure 4), we know it's from old (fossil fuel) sources, not modern sources. The carbon-14 ratio decreases as more fossil fuel emissions dilute the atmospheric CO2 signature. This is not new science either, it's something we've known for over half a century (Revelle and Suess 1957), and there have been many studies confirming these results. For example, Levin & Hesshaimer (2000):
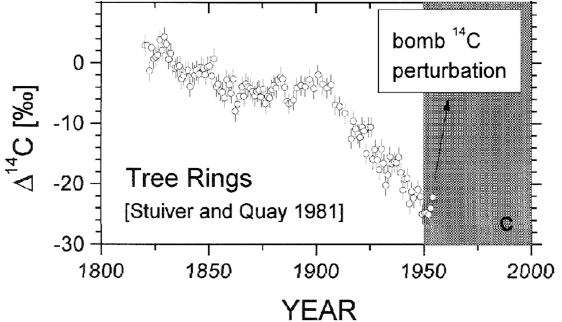
Figure 4: Temporal change of carbon-14 ratio in tree rings grown at the Pacific coast (Levin & Hesshaimer 2000)
Atmospheric O2 is Decreasing
We also know that burning fossil fuels has led to the recent increases in CO2 levels because of observed decreases in atmospheric oxygen levels. Burning carbon requires oxygen, so when we burn an atom of carbon, the required oxygen becomes part of the CO2 molecule. If the CO2 increase is caused by burning carbon (fossil fuels), we would expect atmospheric O2 levels to decrease at the same rate. And that's indeed what we observe (Figure 5). O2 concentration is changing exactly as we would expect from a fossil-fuel driven CO2 increase.
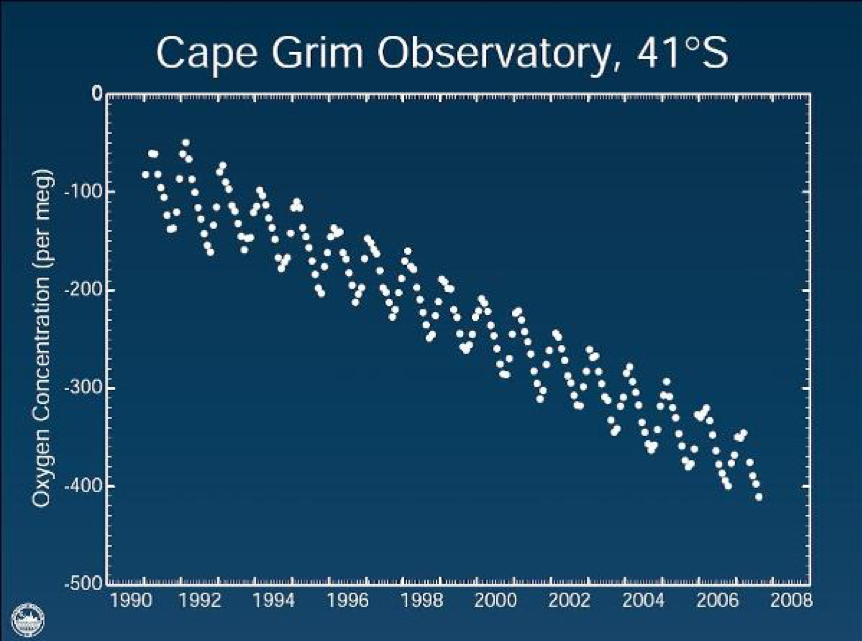
Figure 5: Atmospheric Oxygen Concentration observed from Cape Grim, Tasmania
Correct Causation: Human Emissions Contribute to Atmospheric CO2 Increases
So let’s review. One climate myth argues that atmospheric CO2 increases are the result of natural global temperature changes. However, as described above, scientists have found multiple lines of evidence that show recent CO2 level increases are the result of burning fossil fuels. Between ocean acidification, isotopic signatures of the atmosphere, and trends in O2 levels, the evidence is abundantly clear that burning fossil fuels have resulted in an increase of atmospheric CO2, not seen in 800,000 years. The correct causation is an important distinction to make. Rather than global warming causing the increase in atmospheric CO2, our use of fossil fuels are actually the source of the increase. Moreover, we know that it is this human-caused increase in atmospheric CO2 that is warming our planet.
Last updated on 16 November 2020 by eharrin5 . View Archives


Question on the part on "simple accounting":
I assume if we set HE to 0, then NE-NA would result in a deltaC of 0, representing the pre-industrial equilibrum. This puzzles me: Why is nature (oceans, plants, soils) suddenly able to absorb 15 billion tons more CO2 with an atmosphere with ~400ppm, as opposed to the pre-industrial equilibrium with ~200ppm?
Falkenherz @2.
If we say there was pre-industrial equilibrium with 280ppm CO2 by volume, NE-NA=0, but the natural carbon cycle is still at work. NE=NA= 770 GtCO2 pa.
Now we are at 400ppm having pumped something like 2,200 GtCO2 into the atmosphere over the previous century or so and seen a little over half of it get absorbed by the oceans and biosphere, if we stopped emitting tomorrow (HE=0), equilibrium will not be achieved for a millenium or so. The eventual level of atmospheric CO2 would be somewhere near 340ppm.
Archer et al 2009 is usually seen as a pretty definitive study on the subject.
Falkenherz to add to what MA ROger has already said, if you want a specific mechanism, the transport of carbon dioxide between the atmosphere and surface oceans is proportional to the difference in partial pressure of CO2 between air and ocean. Therefore if we increase the partial pressure of CO2 in the atmosphere (e.g. by burning fossil fuels) then this difference increases, and more CO2 passes from atmosphere to the ocean than in the other direction. This causes the oceans to take up more CO2 until the partial pressures are in equilibrium again.
David Archer has written a very good primer on the carbon cycle, which is well worth a read.
Thanks for the answers and sorry for the double-post, no idea how that happened.
[Dikran Marsupial] no problem, easily fixed.
Oh Dear......
1) http://climate.nasa.gov/evidence
2) http://oilprice.com/The-Environment/Global-Warming/Carbon-Isotopes-Prove-Humans-Have-Caused-Global-Warming.html
3) or maybe it is greed: http://www.the-one-project.net/survival_of_human_beings_and_the_danger_of_economic_growth.htm
SIMPLE ACCOUNTING REVISITED "IT’S THE ANIMALS"
Simple Accounting Revisted "It's the Animals"
The simple accounting demonstration that CO2 increase is manmade is pure crap.
Animals and plants produce more than 220 GT of CO2 per year. Let’s just change a few words. Let humans be part of the nature term NE (as we are) and let a group of animal species A be the one that produce some extra CO2 by an amount of 30 GT (we can certainly find some species to be blamed). Then we have the same result,
NE-NA = -15
but now the added CO2 is blamed on animals, not humans. Why should humans be solely responsible for all CO2 production added to the atmosphere? Is this some sort conspiracy against humans? Why not share the blame among all species, animals and humans included?
In any way, the NE and NA terms will balance in the future (CO2 will stabilize as it always did in history) and humans and animals will keep on living. As is well known, CO2 levels have been much higher in the history of the planet and life kept growing despite of it. I'm just sick of alarmists and skeptics bashing against those who have another perspective about this whole topic and who, ironically, are also skeptics. Skeptics against skeptics. How uglier can it get?
[TD] Please do not use all caps, because it is the web equivalent of yelling. Instead use the bold and italic formatting controls.
Chris, plants take carbon out of the atmosphere. Animals eat plants. Animals breathe out CO2. In general, animals are carbon neutral, just as human breathing is carbon-neutral. Humans, however, are also digging up and burning billions of tons of carbon that has been stored in the Earth over hundreds of millions of years. We're adding the carbon of the past to the present (and future).
Chris636
You are not doing the accounting correctly. It's not enough to simply produce CO2. You have to have a net exchange from one reservoir to the other.
So, for your example to work, the respiring organisms would have to cause a net loss of plant carbon to the atmosphere. To match the observed increase in atmospheric CO2, you would have to move about 250 petagrams of carbon from the terrestrial biosphere to the atmopshere (current - preindustrial atmsopheric CO2 = 850 Pg - 600 Pg).
That is 40-60% of current living terrestrial plant biomass (terrestrial plant C ~450 - 650p petagrams C according to the IPCC.) About 2/3s of that deline in terrestrial biomass would have occured since 1970. There is large uncertainty around estimates of plant biomass for sure, but you bet we would have noticed such a massive decline over such a short period of time.
As indicated in the post, the CO2 accumulating in the atmosphere is highly depleted in 14C. We know it is therefore tens of thousands of years old because that is how long it takes for 14C to decay completely. That age rules out everything except fossil fuels.
It is simple accounting in the end. Really, scientists are not so stupid to miss something so obvious. If individuals had been, you can bet their competitors would take them to task!
Chris636: Of course the CO2 level eventually will stabilize--when humans eventually run out of fossil fuels to burn. The problem is that the ill effects of those high CO2 levels will get much, much worse, for a very, very long time in the time scale of human lives, civilization, and even species. See RealClimate for a couple of relevant posts.
Chris626 wrote "The simple accounting demonstration that CO2 increase is manmade is pure crap."
so all of the worlds carbon cycle specialists are wrong, no hubris there then! ;o)
"Let humans be part of the nature term NE (as we are)"
This is just silly, if you define humans as part of nature the word "anthropogenic", "artificial" and ultimately "natural" have no meaning.
" let a group of animal species A be the one that produce some extra CO2 by an amount of 30 GT "
The flaw in this argument is obvious. The carbon dioxide that animals produce through respiration is directly (in the case of herbivores) or indirectly (in the case of carnivores) derived from plant matter, which is contructed from carbon dioxide taken out of the atmosphere. Thus all animals merely return to atmosphere the carbon that was taken out of it via photosynthesis, and hence are essentially carbon neutral. Now if you can identify an animal species where this is not the case and is increasing the amount of carbon moving through the carbon cycle, then you might have the beginings of an argument.
"Why should humans be solely responsible for all CO2 production added to the atmosphere? Is this some sort conspiracy against humans? Why not share the blame among all species, animals and humans included?"
because humans are the only animals that introduce additional carbon into the carbon cycle by extracting it (in the form of fossil fuels) from the lithosphere and burn it, which puts it in the atmosphere.
"How uglier can it get?"
Rather ironic thatyou should ask that, given you started your post by calling the work of eminent scientists "crap".
It is sad that there are skeptics that can't even accept that the increase in atmospheric CO2 is due to anthropogenic emissions when the evidence is unambiguous and unequivocal. If the natural environment (including all the animals) were a net carbon source, the atmospheric CO2 would be rising faster than anthropogenic emisssions as both nature and mankind would be net sources. However we know for sure that this is not the case, the observations rule that out completely.
I dont want to dogpile, but Chris626 is only looking at one of the lines of evidence presented (getting the accounting wrong). If it is "crap" then explain the isotopic evidence and ocean acidification.
While the planet might have had higher levels in past, (but also different solar input) the problem is rate of change (because adaption takes a long time), not the final temperature.
All: Please do not dogpile any future comments posted by Chris626. Dogpiling is both unnecessary and unseemly. Furthermore, it is prohibited by the SkS Comments Policy.
chris626: The first comment you posted on this thread was deleted by me because it did not comply with the SkS Comments Policy.
Please note that posting comments here at SkS is a privilege, not a right. This privilege can be rescinded if the posting individual treats adherence to the Comments Policy as optional, rather than the mandatory condition of participating in this online forum.
Please take the time to review the policy and ensure future comments are in full compliance with it. Thanks for your understanding and compliance in this matter.
Sorry John..being a skeptic is fine but in this case you're incorrect..I'm not saying only mankind is contributing but I'm saying what they manufacture,since the Industrial revolution has contributed immensly..how could it not?? btw I taught several volunteer FYI college classes at night several years back to mostly adults who had no idea what it was all about....my saying to those who must deny GCC..is "well I guess we'll just have to wait and see"..yep it's moving along a good deal faster than old mother nature had in mind..have a swell day..glad I found and joined this site..ciao
Hi,
I agree with the CO2, 13C and 14C could be attributed to fossil fuel burning. But the oxygen isotopes in the CO2 molecule are not mentioned in the explanations.
Can anyone explain why CO2, 13C and 14C isotopes follow a trend while 18O isotopes of CO2 do not show a clear trend?
Data Sources:
http://scrippsco2.ucsd.edu/assets/graphics/png/co2_sta_records.png
http://scrippsco2.ucsd.edu/assets/graphics/png/c13_sta_records.png
http://scrippsco2.ucsd.edu/assets/graphics/png/c14_sta_records_all_sta.png
http://scrippsco2.ucsd.edu/assets/graphics/png/o18_sta_records.png
[RH] Fixed image width. Please keep your images down to 500px.
jlfqam @16, total oxygen content in the atmosphere is showing a trend, as shown in this graph from the 2001 IPCC TAR:
You will notice that the trend is in parts per million. The graph you show of the d18O isotope is in parts per mill, ie, parts per thousand. A reduction of 30 ppm over 10 years (as shown above),ie, three parts per hundred of the scale, will not register on a graph scaled in parts per thousand.
Thanks for the figure of the evolution of atmospheric O2 concentration.
A comparison of simultaneous variation O2(atm) with CO2(atm) can be seen in the plots from Scripps measurements
http://scrippso2.ucsd.edu/plots
for example.
http://scrippso2.ucsd.edu/sites/default/files/pdfs/plots/daily_avg_plots/mlo.pdf
I am sorry, I did not explain properly the figures, the fourth plot refers to the Oxygen isotope composition of O atom in the atmospheric CO2 molecule,
the isotope ratio 18O/16O, in this molecule refers to the ratio of 12C18O16O+12C18O2(less abundant) over 12C16O2, for example.
According to two possible sources of CO2, biomass/fossil fuel burning or ocean sources: (equations are not stoichiometric)
In the first case, burning, the oxygen source is atmospheric Oxygen (O2), which is produced by photosynthesis, and ultimately bears the isotope composition of the water used
by photsynthetic organisms during the water photolysis reaction: H2O=>O2 + (2H --->sugars (CnH2nO))
combustion #CnH(2n+x)+*O2=> #C*O2+H2*O
#C has the isotope signature of the fuel organic Carbon, and is measured in the 13C and 14C plots in the previous posting.
*O is the isotope signature of the O2 used in the combustion, and is represented in the 18O plot from Scripps CO2(atm) measurements.
The second case, the marine source of CO2, has also isotope signatures
remineralisation of organic matter from ocean bottom organic rich sediments $CnH(2n+x)+^O2=> $C^O2+H2^O
$C has the isotope signature of the marine biomass remineralised, as it's of biogenic origin is depleted in 13C, and since it's old, it's mostly depleted in 14C, hence in principle it's difficult to distinguish from fossil fuel carbon
^O is the isotope signature of ocean waters, either deep or shallow, as bicarbonate or dissolved CO2 rapidly equilibrate with water.
"C·O2+H2^O<=>"C^O·O+H2·O
"C^O·O+H2^O<=>"C^O2+H2·O etc.
In principle the measurement of the 18O isotope ratio in atmospheric CO2 should tell us which of the two sources is the dominant.
Is this argument correct?
Which one of the two sources can explain the plots in the previous posting 16.jlfqam
jlfqam @18, fossil fuels are completely depleted in C14. That is, there Δ14C = -1000 per mill, as per this chart:
(Source)
In contrast, the Δ14C of abyssal oceanic waters averages about -160 per mill, with minimum values of about -240 per mill (See figure 1 here). Taking those minimum values, you would need an increase in atmospheric CO2 4.2 times greater than has been observed to obtain an equivalent reduction in atmosperic C14 to that which has been observed as a result of the combustion of fossil fuels. Therefore the C14 evidence by itself is sufficient to show the primary source of the increased CO2 is from the combustion of fossil fuels.
That being said, it is a bad practise to relly on a single indicator in making these sorts of determinations. In fact there are at least 10 different lines of evidence that help us determine the source of the increase in atmospheric C14. Some lines only provide evidence regarding a single potential source, while some provide relevant evidence for all four "major" theories. Overall, only a fossil fuel source is not contradicted by any line of evidence. Further, it is strongly supported by five of the ten lines of evidence, and given moderate support by a further two. This evidence is discussed here, and summarized by this chart:
I have not come across a discussion of Δ18O in this connection, but given the strength of the evidence from other sources, I would be flabberghasted were it to show anything different.
Thanks Tom,
I will post the answer in the corresponding forum page. I am sorry I did not find it first.
http://www.skepticalscience.com/anthrocarbon-brief.html
Tom -
In your post (29th November 2016, #19 above) you wrote:
That being said, it is a bad practise to relly on a single indicator in making these sorts of determinations. In fact there are at least 10 different lines of evidence that help us determine the source of the increase in atmospheric C14.
My understanding was that the levels (or actually ratio) of C14 were decreasing as they come from a fossil source. Am I wrong, or could you possibly have meant CO2?
KalleH @21, you are quite correct that I intended to write "...determine the source of the [decrease] in atmospheric C14". Thankyou for picking up on my error.
In general, I believe that many things happen naturally. But naturally, cause a very little amount of effect if we compare to human activities. CO2 or carbon dioxide is a colorless gas consisting of carbon and oxygen. It occurs naturally in the atmosphere. Plants use it and animals also produce it in respiration. It is a major greenhouse gas emitted by fossil fuel combustion. Burning fossil fuels is one of the causes that make CO2 increase so we can't say that iCO2 came from natural because human is the one who controls everything even we can control that in next 50 years what we want our world gonna be like. The science researcher says that humans are emitting CO2 at a rate twice as fast as the atmospheric increase (natural sinks are absorbing the other half).Nature is absorbing more CO2 than it is emitting. So, the percent that CO2 increases in our world today caused by human activities whether directly or indirectly way. It has more effect than natural.
MY question is this: Since the total annual amount of CO2 has increased on an annual basis, the amount of CO2 from Earth keeps going up as well. I've seen reports that say "our" Co2 is absorbed to the rate of about 55%. That is consistently evey year. If, as some assume, all of earth's CO2 is absorbed, in ever larger amounts, how come our 45% is always left over?
chromedome49 @24,
The 45% isn't written in stone. Using the MLO data for atmospheric CO2 and the emissions estimates from Global Carbon Project, the 45% value has remained pretty much the multi-decadal value since 1990. Over the period 1960-90, the Airborne Fraction had been slowly increasing from an early value of 35%.
There are a lot of waggles along the way. Over the period since 1959, annual Airborne Fractions have varied from 20% all the way up to 80%. The El Nino is one big factor in these waggles, as are big tropical volcanoes. Taking multi-year averages, the percentage is still a bit waggly. After the rise to 1990, there was a short sharp dip caused by the eruption of Pinatubo in the early 1990s, a rise into the 2000s due to the high incidence of El Ninos then a dip into the 2010s due to all the La Ninas.
Where the Airborne Fraction goes in coming years? If we begin to reduce the acceleration of our emissions, it should start to drop, and drop quicker if our emissions begin to fall. Mind, all the waggles will prevent a clear sight of any such a drop for some time.