


 Arguments


Recent Comments
Prev 429 430 431 432 433 434 435 436 437 438 439 440 441 442 443 444 Next
Comments 21801 to 21850:
-
Miguelito at 10:50 AM on 2 December 2016Justin Trudeau approves two big oil sands pipeline expansions
It's worth noting that western Canadian bitumen is doubly discounted to Brent, not just because of its low quality, but because there's a lack of pipeline access to get that oil shipped outside western Canada, leaving rail as the only substitute, which is pretty pricy. This would only worsen without pipeline access to tidewater.
So, if climate-change was used as a reason to stop building pipelines to tidewater, western Canadian producers wouldn't only have to pay whatever carbon price is leveled on their upstream emissions ($30/ton, $50/ton, $100+/ton, or whatever it'll be), they'd have to pay an extra penalty based lack of pipeline capacity. This extra no-pipeline discount would be on the order of $10/barrel, which probably works out to more than $100/ton or more (rough guess, but it sounds like what I've heard).
In other words, Canadian oil and gas producers would get hit with a effective carbon price much higher than other Canadian sectors. From an economic perspective, it's not an efficient way to fix the climate. From an economic-fairness perspective, it's not really fair to pick on one sector while lowering the burden on other sectors. We all drive cars and should share the burden. Manufacturing and cement industries should share that burden too.
Another way of looking at it is that the Canadian oil and gas industry with its higher effective carbon price would subsidize other Canadian emitters like the transport sector, industry, cement, home heating, etc... We do need to transform the car and heavy truck sector so electric vehicles are widely adopted, but a lower effective carbon price on gasoline because of this subsidization will slow that. Same with reducing the emissions in cement, industry, home heating, and other things.
Also, government projections of CO2 emissions are useful, but often limited and neglect things like technological change and the impact of escalating carbon prices. Given that the oil and gas sector is already a large contributer to Canada's emissions, there are a lot of potential reductions if there's a price signal to encourage industry to do that. While, yes, escalating carbon prices would cause less production than without a price, there could also be significantly decreased emissions. Chances are, if companies can keep the costs of reducing emissions below whatever carbon tax there is, then they'll keep producing rather than not produce oil at all.
I guess I'm arguing that using climate-change as a reason to deny pipelines doesn't have much merit. Pipeline safety is a whole other issue and is much easier to make that argument on.
-
Tom Curtis at 08:31 AM on 2 December 2016Climate Change Cluedo: Anthropogenic CO2
jlfqam @61, in addition to HK's fine response, I will note that at the location of Mauna Loa, the CO2 air-sea flux is slightly negative, according to the map you show. Further, it is no closer to the strong positive flux in the tropical east pacific than it is to the strong negative flux at about 40 degrees north in the west pacific. That directly contradicts your claim that "upwelling may be the main source of CO2 at mloa".
-
jdeutsch at 07:03 AM on 2 December 2016Trump and the GOP may be trying to kneecap climate research
Climate deniers may be beyond convincing, but all the more reason to make sure we are consistent in our units (Gt of what? Carbon, CO2, or CO2 equivalents? Total energy accumulation in the earth system, or average air temperature, etc.). And lately all that talk of the North Pole being "hot".
-
jdeutsch at 06:56 AM on 2 December 2016Justin Trudeau approves two big oil sands pipeline expansions
Just as in the nuclear industry, there is difficulty accepting and responding to the reality of rising energy retention in the earth system. A big issue is loss of secure, well-paying jobs. There is immense need to build and repair infrastructure, insulate homes, shift agricultural practices, and gear up more health- and life-friendly alternatives to GHG-producing power generation and transportation. So many jobs to be created, but planning must include a living wage.
-
nigelj at 06:39 AM on 2 December 2016Trump and the GOP may be trying to kneecap climate research
John Warner @2 you claim your calculations discredit everything the IPCC claims then say you will provide the calculations"eventually". You appear to have let it slip that you havent actually done any calculations. Such is the obviously ridiculous component of your statements, I wonder if your post is satire/ sarcasm?
I'm also not aware of any temperatures decreasing since 1979. All data sets show an increase although some show a slightly slower rate since 1998. However this year is almost over and its clear it will set a huge temperature record.
-
ubrew12 at 06:30 AM on 2 December 2016Trump and the GOP may be trying to kneecap climate research
john warner@2 said: "If you don't have a 34 to 1 feedback to carbon dioxide forcing explanation what really caused this temperature increase [in the last 4.75 years]?" I think the switch from a La Nina dominated period to a massive El Nino can explain that. Nobody would use a 4.75 year period for a climate study, 1) too short to study Earth warming. The ocean alone delays sensible warming about 10-20 years, and 2) 4.75 years sounds suspiciously cherry-picked for a time interval.
-
nigelj at 06:12 AM on 2 December 2016Dear Mr President-elect: a message from across the Pond
Michael Sweet @18, fair comments. It was my understanding elevated temperatures would last about 3000 years, but I want to emphasise even that is a serious problem. Clearly it is also proceding at a rate that could be hard to adapt to. Last years temperatures would suggest the so called pause is over and that we are on track to lock in substantial sea level rise.
I have already read a long article on Ruddimans work that basically suggests farming and deforestation have caused some warming for the last 5,000 years or so and are an explanation for the unusually mild interglacial period we have experienced. It sounds distinctly plausible.
Given global warming will have a definite life span whether 3,000 or 100,000 years it cannot stop all future ice ages. I was just thinking long term that "if" global warming could permanently eradicate all ice ages it might be a good thing. Maybe this was an off the wall thought. But clearly global warming cant stop all ice ages. Ice ages are also slow phenomena so possible to adapt to one assumes.
I promise I will never mention ice ages again.
-
Climate Change Cluedo: Anthropogenic CO2
61 jlfqam:
"An alternative, and very simple explanation, could be the CO2 measured at Mauna Loa station emanates from the CO2-rich ocean waters of the tropical Pacific Ocean."Short answer: No!
If you are suggesting that much of the CO2 measured at Mauna Loa is a result of oceanic out gassing, then you are wrong. CO2 is measured all over the world, and once you get away from large local sources or sinks, the background concentrations and trends are almost identical.
This graph is based on direct measurements, with the seasonal variations removed. If you find it hard to distinguish the curves, it should be obvious that there isn’t anything special about the atmosphere around Mauna Loa. CO2 really is a well-mixed gas, far more so than gases like water vapour, ozone or even methane.
And BTW, your first map does not show ocean surface CO2 concentration, but the net CO2 exchange between the atmosphere and ocean. Red is oceanic uptake, while violet shows oceanic out gassing.
-
JWRebel at 03:55 AM on 2 December 2016Justin Trudeau approves two big oil sands pipeline expansions
"For the benefit of those who don't follow Canadian politics (and who could blame you for that)"
Canadians. Canadians are betting on the wrong horse in terms of future economic development and returns on investment. Sooner or later fossil fuel stores must be written down in value. Oil sands bitumen has a lot of disadvantages:
- Huge up front infrastructure required with risks to capital sinks
- High cost of production
- Huge amount of CO² emission as input requirement
- Inferior grade oil with higher CO² emissions.
Canadian oil can only be competive in a world short of oil. Once writing down of reserves starts (and CO² is taxed), Canadian oil will not be able to compete with cheaper sources (such as the Middle East, with huge stores of oil that is cheap to produce). Not to mention LNG from huge gas stores.
-
rdr95 at 03:08 AM on 2 December 2016Justin Trudeau approves two big oil sands pipeline expansions
That's a fair report - it has a certain amount of 'political' content, though, so can I make a 'political' comment?. I'm dubious about the claim that Trudeau will pay a large political price for trying to 'square the circle'. Support for pipelines is not restricted to Alberta, nor are the positive economic benefits of pipeline construction and oil sales restricted to Alberta. In Atlantic Canada where I live, for example, polls have shown support for pipelines and plenty of Atlantic Canadians work 'away' in Alberta. National polls are not that different, and, like it or not, there are clear national economic benefits from the oil industry. Given that the NDP currently is in power in Alberta, Trudeau might think he does have a shot at picking up a few seats there. And the BC govt is supportive of the pipelines - that suggests the 'bitterly divided country' you are referring to might be some other country. Insofar as the carbon tax is concerned, that tax is expected to increase over time is it not? That would further reduce emissions over those you enumerate in your story. You can argue that the approach here is imperfect, but if the carbon tax does get implemented we are moving in the right direction.
-
Dennis at 00:06 AM on 2 December 2016Trump and the GOP may be trying to kneecap climate research
People need to know who this Bob Walker is. It took a little digging, but it turns out he's the same former Republican Congressman Robert Walker who was closely aligned with Newt Gingrich during his time in Congress. He served on the House Science committee and in a recent opinion article described NASA climate science as “politically correct environmental monitoring."
source: LINK
Moderator Response:[RH] Shortened link.
-
jlfqam at 21:28 PM on 1 December 2016It's the sun
Message for Tom Curtis,
could you please help me testing if the correlation in the last figure of this posting is strong enough.
http://www.skepticalscience.com/news.php?p=2&t=61&&n=1534#119495
The data sources are
Data sources
http://www.esrl.noaa.gov/psd/data/correlation/nina3.data
(Note although the file name is ninA3.data it actually refers to ninO3)
http://www.esrl.noaa.gov/psd/data/climateindices/list/
list entry:
Nino 3* Eastern Tropical Pacific SST (5N-5S,150W-90W) From NOAA Climate Prediction Center (CPC): now uses the NOAA ERSST V4
Thanks
JLF
Moderator Response:[RH] Shortened link.
-
jlfqam at 21:19 PM on 1 December 2016Climate Change Cluedo: Anthropogenic CO2
Sorry,
I forgot pasting the map of ocean surface CO2 concentration,
Notice how close is the Mauna Loa station (Hawaii, filled black Circle) to the ocean CO2 rich waters
http://www.ldeo.columbia.edu/res/pi/CO2/

And just one more plot, please take a look at the "good" correlation (I would say, one of the best I could find from independent measurements of natural phenomena) between the Mauna Loa CO2 18O isotope composition, right end plot in 59-jlfqam posting above, and the NINO3 ocean surface temperature series.
Data sources
http://www.esrl.noaa.gov/psd/data/correlation/nina3.data

My question is, how is it possible the surface ocean temperature over the equatorial pacific affects the isotopic composition of the CO2(atm) produced by independent sources such as fossil fuel burning anywhere on the Planet?
An alternative, and very simple explanation, could be the CO2 measured at Mauna Loa station emanates from the CO2-rich ocean waters of the tropical Pacific Ocean.
Thanks for your attention
Best
JLF
Moderator Response:[PS] Perhaps see the article here . (and dont forget isotopic signature of atmospheric CO2 is consistent with FF not ocean). What is your "simple" explanation for where the FF we have burnt is gone if magically not increasing CO2 in atmosphere? You can use the "Arguments" menu item above to find responses to common myths. You seem to be engaged in a effort to find anything except CO2 (which is by the simplest explanation). Perhaps time to ask yourself where this bias comes from?
[RH] Shortened link.
-
michael sweet at 21:03 PM on 1 December 2016Dear Mr President-elect: a message from across the Pond
Ngelj,
It is my understanding that the changes in heat on the Earth from current emissions will last about 100,000 years. That is not the rest of the life of the Earth, but no-one currently alive will be around to see sea level what it is today. How long is forever for you? Already the climate will not be the same as it was in 2000 until long after everyone now living has passed on. If sea level rises 25 meters (in 1000 years) it will cover all the great deltas of the world which include a very large percentage of arable land. Several billion people would be displaced with no-where to go. It was pointed out above how much disruption is caused by one million refugees, imagine 300 million from 2 meters of sea level rise. That is in the range of what is expected by 2100.
Look at the linked videos from James Hansen above. He goes into more detail.
William Ruddiman suggests that humans have been affecting climate for 7,000 years. His view has gained a lot of support in the last few years, but has not yet reached consensus. According to this hypothesis we would currently be in the start of the next ice age without human intervention.
-
john warner at 20:51 PM on 1 December 2016Trump and the GOP may be trying to kneecap climate research
If you calculalte the theoretical scientific magnitude of carbon dioxide's effect on the earth's average annual global air temperature and divide this number into the lower troposphere temperature increase for the last 4.75 years the ratio is 35 to 1. If you can't do the calculations yourself I will provide them eventually. In addition you should inform you readers what the first footnote for policy makers says from the IPCC TAR Climate Change 2001: The Scientific Basis. These two facts alone discredit the whole CAGW fraud scheme. If you don't have a 34 to 1 feedback to carbon dioxide forcing explanation what really caused this temperature increase? In addition, since 1979 carbon dioxide never decreased, what explains all of the decreases in the earth's air temperature? This is why the IPCC scientists insisted on the disclaimer that human activity caused climate change and redefined climate change to include natural variability.
Moderator Response:[PS] Accusation of fraud and sloganneering. You must substantiate claims. If you want to show science wrong, you first quote the actual claim with source (because you are simply promoting a straw man at the moment), then you provide data/publications to support your alterrnative view. Note in particular: climate is defined as 30 year average since long before IPCC because of large internal variability. No climate scientist from FAR onward has ever claimed that temperatures would keep rising year after year. Even a cursory reading of report would explain why. Leave the rhetoric at the door.
Please note that posting comments here at SkS is a privilege, not a right. This privilege can be rescinded if the posting individual treats adherence to the Comments Policy as optional, rather than the mandatory condition of participating in this online forum.
Please take the time to review the policy and ensure future comments are in full compliance with it. Thanks for your understanding and compliance in this matter.
-
jlfqam at 19:17 PM on 1 December 2016It's the sun
Thanks for the comments. I temporarily stop posting in order to carefully read the comments.
Best
-
denisaf at 14:59 PM on 1 December 2016Trump or NASA – who's really politicising climate science?
This is an interesting discussion of the perception by a range of communities of the likelihood of climate change. But it is misleading as it focusses on the variation of perception rather than on the fact that the overwhelming view, especially amongst those knowledgeable of the scientific backing, is that rapid, irreversible climate change (and ocean acidification and warming) is under way. So the article adds to the confusion rather than fostering the mitgration and amelioration that the precautionary principle ordains
-
John Mason at 14:20 PM on 1 December 2016Dear Mr President-elect: a message from across the Pond
Nigelj - this argument is sometimes put forward, although it has a major flaw. It's not the end-state but the transition from here to there that is so deadly. Sea-level rise, as pointed out above, destroys the economic infrastructure of all countries to a large or massive degree. That can't be good. However, more serious again is the shifting of Earth's climate belts with respect to their current position. That variably but inevitably takes out a) habitability and b) agriculture. We have seen the desperate situation of folk fleeing the conflict in Syria - the boats, the mass-drownings, the political instability in parts of Europe. Maybe a million people are trying to find sanctuary. Let the climate run away with itself and you're looking at hundreds of millions.
Another assumption I've seen put forward is that defrosted permafrost country in the far north will compensate for such issues - however, the timeframe is too long. Soils do not develop overnight - they are the product of thousands of years of biochemistry. Soil is a lot more complex than most people realise, yet we take it for granted in the same way we expect to find tins of beans on the supermarket shelf.
It was a lot easier for our ancient predecessors to move south or north as the Quaternary ice-sheets waxed and waned. Small bands of hunter-gatherers, with no governments or nations and borders, had a fraction of our modern problems to address. I could live off the land - and from the sea - if I needed to. I do so to an extent already. But the fraction, in the West, that have such capabilities - or even the ability to learn them and put them into practice - is tiny.
-
nigelj at 13:57 PM on 1 December 2016Trump and the GOP may be trying to kneecap climate research
Perhaps Bob Walker doesn't realise NASA is involved in not just space research and climate change, but all sorts of remote sensing of earths systems. The things all just sit comfortably and work efficiently together.
Please don't try to fix what isn't broken Mr Walker. The history of humanity is littered with mistakes like that.
-
nigelj at 13:37 PM on 1 December 2016Dear Mr President-elect: a message from across the Pond
ubrew @12, yes thanks I get that. Global warming will cause serious sea level rise. We have had maps published in my country on the extent and it's not good.
I was really just asking if we continute to burn fossil fuels at current rates will this cause permanent global warming for billions of years, or temporary global waming of a few thousand years (or how much would we expect?) or dont we know?
So far I have received mostly conflicting and blunt or hostile answers.
-
denisaf at 12:36 PM on 1 December 2016Global weirding with Katharine Hayhoe: Episode 5
There is appreciable uncertainty about the temoral and regional impact of climate change, as noted here. But the impact of climate change is only one of the predicaments that society will have to try to deal with in coming decades. Declining availability of irreplaceable natural resources, including oil, over and aging population, the impact of ocean acification, pollution and warming on the marine ecosystem, the irrevocable aging of the vast infrastructure (from cities down to ipads) that provides society with the services they have become dependent on, together with the degradation of the environment and the consequences of flora and fauna species extinctions will provide a challenging mix of predicaments.
-
ubrew12 at 10:12 AM on 1 December 2016Dear Mr President-elect: a message from across the Pond
nigelj@13 said: "So I just struggle to see that we would be in a permanent warm... system for all eternity." No. We would be in a temporary warm system just long enough to erase most of our coastal cities, which conduct the vast majority of our trade. Jim Hansen on this (15' video).
-
johnthepainter at 08:57 AM on 1 December 2016Dear Mr President-elect: a message from across the Pond
We now can add a female scientist to the history of climate science as the first to prove that CO2 effectively traps the sun's heat. In 1856, she concluded on the basis of her experiment that, “An atmosphere of that gas would give to our earth a high temperature; and if as some suppose, at one period of its history the air had mixed with it a larger proportion than at present, an increased temperature [from its own action as well as from increased weight] must have necessarily resulted.” http://www.climatechangenews.com/2016/09/02/the-woman-who-identified-the-greenhouse-effect-years-before-tyndall/
Unfortunately, European scientists were unaware of her report, and she did not carry her research on the subject further.
-
nigelj at 06:27 AM on 1 December 2016Dear Mr President-elect: a message from across the Pond
John Mason @10, thanks but I am still mystified on a couple of points as follows.
First I want to point out I see global warming as a problem for humanity, and am on record on this website saying this.
However being devils advocate, isn't a warm / hot climate phase long term actually preferable to a warm / cold climate with periodic ice sheets over most of the northern hemisphere? Ice ages are a real killer and hard to adapt to. On that basis some might say global warming is a good thing.
And I dont see how earth would enter a permanent warm / hot phase. Wouldnt the excess atmospheric CO2 gradually be reabsorbed into the oceans? And given we have had a warm / hot climate in the distant past something caused it to change to a warm / cold system. So I just struggle to see that we would be in a permanent warm / hot system for all eternity.
-
jimspy at 05:01 AM on 1 December 2016Conservatives elected Trump; now they own climate change
@Red Baron: For the record, I'm a card-carrying liberal...and I wholeheartedly agree with your approach. Make it potentially wallet-fattening to support mitigation, and the stogie-chompers will come a-runnin. (No offense).
-
ubrew12 at 00:14 AM on 1 December 2016Dear Mr President-elect: a message from across the Pond
What will Trump really bring to the Climate Change discussion? Consider that yesterday Dr Jeff Masters, founder of The Weather Underground website, appealled for donations for the Climate Science Legal Defense Fund (CSLDF), to defend U.S. Climate Scientists from a tidal wave of McCarthyist witchhunts in Congress designed to chill their research. To quote: "[Lamar] Smith’s House Science committee issued more subpoenas in his first three years than the committee had for its entire 54-year history; many of these subpoenas demanded the records and communications of [climate] scientists who published papers that Smith disapproved of."
-
ubrew12 at 00:03 AM on 1 December 2016Dear Mr President-elect: a message from across the Pond
Trump says he has 'an open mind' about Climate Change. In the same interview, he says CC is 'a very complex subject', says on one hand 'they have science' and on the other hand 'there are those horrible [Climategate] emails... where they got caught, you know', says 'we've had storms always', and says 'the hottest day ever was in 1890-something'. Today we learn KellyAnne Conway, his campaign manager and likely press secretary, will travel to the Alberta tar sands in January, to highlight its importance to America. So, in this case, we're talking about an 'open mind' filled with Koch-propaganda.
-
jlfqam at 22:24 PM on 30 November 2016It's the sun
Hi,
I hope this time I got the accepted width for the posted figures.
Here I present the isotope composition of a speleothem from Mexico covering the last 2.4ka, but only plotted over the SSN measurments time.
data is available from NOAA
ftp://ftp.ncdc.noaa.gov/pub/data/paleo/speleothem/northamerica/mexico/juxtlahuaca2012.txt
in excel format
ftp://ftp.ncdc.noaa.gov/pub/data/paleo/speleothem/northamerica/mexico/juxtlahuaca2012.xls
Thanks to Tom Curtis 1221-2 for the demonstration, but unfortunately for me I am not good with numbers, I prefer visual correlations as this one,

Notice how the rainfall over the Cave Basin has abruptly decreased after Pinatubo eruption. In fact what I have found is that volcanoes accelerate the cooling caused by decrease in solar irradiance. But volcanoes have another interesting effect on climate.
Regarding MA Rodger 1220, I have a good idea on what is the cause of the lack of correlation after 1990, but since nobody I have already explained how can the global temperatures can increase while the solar irradiation is decrasing does accept the mechanism, I will not tell it here unless I found someone really interested in testing that in a model and willing to publish the results.
Please take a look at this one that shows how Pinatubo eruption of 1991 caused a change in trend on the CH4(atm). I am also trying to find what caused the the turn point after 2000 AD. Or the disturbance of 2 consecutive years after Pinatubo or one year after 2000, on the MLOA CO2 curve, or why methane recovered the production rate after 2006?

The legend

It's also interesting to note that atmospheric CO2 response is very rapid to the volcanic eruption derived cooling of ocean surfaces.
Rampino et al Nature 1992, suggested Toba (Indonesia) eruption around 74kaBP, which lasted 6years (ashes reached E Africa) caused the deepening and extension of an ongoing glaciation. The corresponding full deglaciation was delayed by 40ka, so now here we are as we are.

Here you may find how CO2 responded in a single plot. Notice how minor euptions had barely no effects at the Ka range. However Pinatubo, had only an effect of a couple of years on the CO2.

Frankly, I would not rely on the greenhouse effect of CO2
This picture from a recent paper data shows how WDC, an ice core from an Antarctic region on the Pacific Coast started to warm up a few ka before the CO2(atm) started to rise in concentration
http://www.nature.com/nature/journal/v514/n7524/full/nature13799.html

It's not a matter or refuting or rebuting, it's a matter finding new clues.
The decrease in precipitation over Mexico, it's scary, as it means less rain over many other regions of the Planet.
Take a look at the Great Lakes, I leave you the correlation with SSN.
http://www.tides.gc.ca/C&A/network_means-eng.html

It's time someone starts a global call on how to solve a global cooling situation, which is much worse than a global warming, just because there will be less precipitation, which means less food for the less developed regions.
Thanks again for your patience.
JLF
PS: If you are interested on a discussion on the sources of CO2(atm), I have posted some plots.
http://www.skepticalscience.com/news.php?p=2&t=60&&n=1534#119462
take care
Moderator Response:[DB] Off-topic, sloganeering and Gish Gallop snipped. At the bare minimum, you need to acknowledge where others have adequately disproved your position on various points. If you wish to break this into smaller chunks with a demonstrated understanding of the physics involved plus citations to credible literature that supports your position, then do so.
Until then, please refrain from the above or your posting rights in this venue may be rescinded. Please refresh yourself with this site's Comments Policy and ensure that all subsequent comments comport with it. -
John Mason at 21:12 PM on 30 November 2016Dear Mr President-elect: a message from across the Pond
As the author of this piece, I'll just reply to nigelj (post #2) on the topic of ice ages.
Earth has had two climatic states over the Phanerozoic (the Age of Visible Life) that represents the last 541 million years: Hothouse and Icehouse. Both are vividly recorded through that time-span by the geological record.
In an Icehouse climate state, the climate cycles between warm and cool, or in technical terms interglacial and glacial. There are Polar ice-caps throughout, but in cool cycles, ice-sheets develop more widely.
In a Hothouse climate state, the climate cycles between warm and hot. There are no Polar ice-caps and the positions of Earth's climate belts are different to those of an Icehouse.
We are currently in a warm phase Icehouse, and would be on schedule to enter the cool phase in several thousands of years' time, but we have altered the atmosphere significantly. We are about a third of the way to taking it to a full-blown Hothouse atmosphere. Whatever point we manage to stop at on that journey, Earth will come in time to equilibrium with the properties of the atmosphere at that point. It's what natural systems do.
-
denisaf at 14:56 PM on 30 November 2016The simple, cheap instruments measuring global warming in the oceans
I commend those specialists who work hard to develop and use devices such as the XBTs to obtain temperature measurements that provide understanding of what is happening in the oceans as the result of the greenhouse gas emissions.
-
jdeutsch at 13:49 PM on 30 November 2016Scientists rate Canadian climate policies
Looking at the accumulating Hiroshima heat energy box on the right side of this web page, it appears that physics will determine our fate, while the compromises and false promises of politicians and negotiators will matter little. An economic response to the nonlinear rise in climate destabilisation is absurd, when viewed through this lens.
-
chriskoz at 12:43 PM on 30 November 2016Dear Mr President-elect: a message from across the Pond
barry@3,
Thanks for bringing this thread back on the topic.
I would go even further: this government (i.e. president-elect) not only cannot "think that far [thousands of years] ahead", it provides plenty of evidence that it does not even think of the reality of the moment. I'm very confident that this article, if presented to president-elect, will be dimissed as unimportant distraction, or if forced to read it, president-elect would likely not even understand it. President elect made more than obvious and on many occasions, that the only "facts" he accepts as real are those that make him the "winner" in his mind, even if those "facts" are in fact falsehoods. The very recent example: in 2012 he called Ellectoral College a 'disaster', in a mistaken belief that Romney won the popular vote (he didn't) over Obama. Now, he is happy about EC because it made him win:
Since winning the 2016 election, Trump has been tweeting about the "genius" of the Electoral College system, because "it brings all states, including the smaller ones, into play."
and at the same time is criticising popular vote by inventing conspiracy theories of "millions of fraudulent votes for Hillary Clinton". He does not need to invent such theories, just accept the "genius" system, but he has to boast ego that he's always a "winner" in every game, even by inventing non-sense theories.
It becomes clear that the factual argumentaion in this article is futile if directed to a person such as president-elect. Different type of arguments (e.g. reinforcing his ego along the way) are needed. However this article is important as an open letter to be read by the supporters who elected him. I have a faith that the level of understanding/acceptance of reality by those average american voters is higher than that represented by president-elect. And they realise their mistake of electing such grossly incompetent president. The soonner they do, the better.
-
scaddenp at 11:01 AM on 30 November 2016Dear Mr President-elect: a message from across the Pond
nigelj - sorry if that came over too aggressively, i know you meant well. I cant moderate on a thread that I am commenting on, but can I suggest no more comment on this so that we all conform with the "no dogpiling" rule.
-
Dear Mr President-elect: a message from across the Pond
James Hansen about AGW and future ice ages:
(page 9, §3)"But shouldn’t Earth now, or at some point, be headed into the next ice age?
No. Another ice age will not occur, unless humans go extinct. Orbital conditions now are, indeed, conducive (albeit weakly) to initiation of ice sheet growth in the Northern Hemisphere. But only a small amount of human-made GHGs are needed to overwhelm any natural tendency toward cooling. The long lifetime of human-made CO2 perturbations assures that no human generation that we can imagine will need to be concerned about global cooling.
Even after fossil fuel use ceases and its effect is drained from the system an ice age could be averted by chlorofluorocarbons (CFCs) produced in a single CFC factory. It is a trivial task for humanity to avert an ice age." -
nigelj at 09:44 AM on 30 November 2016Dear Mr President-elect: a message from across the Pond
Thank's for the feedback, but I did not suggest government consider ice ages or that far ahead. I did not suggest that the current rapid rate of climate change is not an issue. By stopping an ice age it should be self evident I meant cancel the drop in temperatures, not stop the underlying cause.
I simply said that a typical sceptical argument is that global warming is good because it would stop or slow down the next ice age and indeed all ice ages. My understanding was global warming cannot even stop the next ice age as per this article below, so theres no long term benefit to global warming.
www.technologyreview.com/s/416786/global-warming-vs-the-next-ice-age/
My comments were made in good faith. The article seemed quite convincing. However I accept comments that most research does strongly find that global warming could at least reduce the effects of the next ice age.However it would be unlikely that global warming would be permanent, and would cancel all future ice ages.
-
scaddenp at 09:06 AM on 30 November 2016Dear Mr President-elect: a message from across the Pond
Further to chriskoz, even without human intervention, an ice age is not expected for 50,000 (see Berger & Loutre 2002). However, the ice age cycle is a Pleistocene phenomena - when natural CO2 levels got low enough for the milankovich cycle effect on albedo to come into play - and when we last had 400ppm of CO2 in Pliocene, then we didnt have ice ages. As Barry says, the issue with climate change is speed (can we adapt fast enough) and the ice age is incredibly slow compared current rates of change.
-
Tom Curtis at 07:41 AM on 30 November 2016It's the sun
Turning to the 10.7 cm microwave flux, using annual values from 1947-2015, the correlation is 0.141 and the r^2 is 0.02, indicating that (ignoring other correlated or anti-correlated causal factors), solar variation accounts for just 2% of CET variation. For your convenience, here is the scatter plot showing the low correlation:
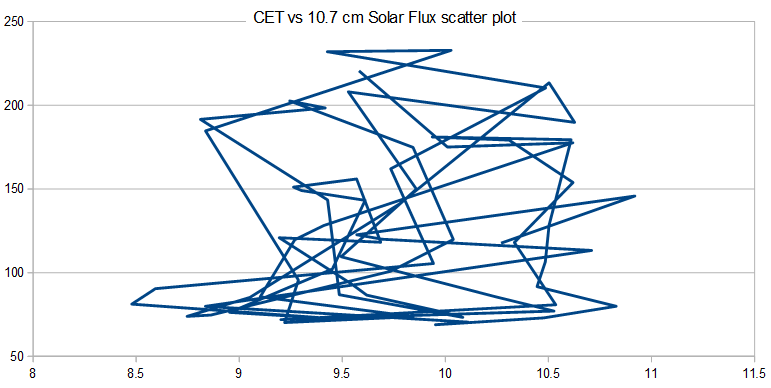
And here is the plot of both against time, using normalized values to provide a common scale:

Human instinct makes us pick out commonalities of patterns, so that when we see such a graph we pick out the (approximately) shared peaks prior to 1960, and the strong correlation between 1980-1993. We do not notice the difference of the height of the peaks shared between those two (which indicates a weak correlation), and we tend not to notice the anticorrelation between 1965 and 1980. Particularly if we are committed to a theory that requires correlation between the two data, the graph plotted against time tends to decieve us. But the scatterplot cuts through that tendency to notice only those features which support our theory; as do the raw numbers which show only a weak correlation.
As with the Sun Spot Numbers, the weak correlation rebuts your theory.
If we crunched the numbers, we would make a similar finding with regard to the Dome C Deuterium record (though less so because to compare we would need to smooth the data, and smoothing artificially inflates correlations). We can see this because the scale that shows a strong correlation around 1815 shows a weak correlation elsewhere. Even more, we know this because we know the temperature trough arount 1815 was due to the Tambora erruption, and the resulting "Year without a summer".
-
chriskoz at 07:34 AM on 30 November 2016Dear Mr President-elect: a message from across the Pond
nigelj@2,
My understanding is global warming cant stop an ice age or even soften one.
That stetement is demonstrably invalid. Start by read ing e.g. Archer 2005, then his following articles in 2007, 2009 etc. Others may provide links and other copious supporting material. I have tine to only say that virtually all climate/carbon models (not just David's model) predict that moving all fossil fuel C (ca 5000Pg) into athmosphere would result in enough warming to skip the next ice age cycle. Even with the amount we've already added, the next ice age may already be disturbed, of course depending what you mean by "disturbed"
-
barry1487 at 07:31 AM on 30 November 2016Dear Mr President-elect: a message from across the Pond
nigelj,
No government today is going to implement any kind of policy to address the climate of the planet 5 to 20,000 years from now, and nor should they.
The issue with modern climate change is the pace at which it is occurring. Climate changing slowly over thousands of years (ice age transitions) is inevitable and something we can adapt to much more easily than rapid change over decades. It's difficult enough to get politicians to think that far ahead. Prognosticating thousands of years ahead for policy purposes is a needless distraction.
-
Tom Curtis at 07:14 AM on 30 November 2016It's the sun
jlfqam @1218, I assume your comment that "I am sorry, but I am a bit lost with number, especially when restricted to narrow time spans" is a response to my post @1218.
First, as to the "narrow time spans", the SSN data I had downloaded was the monthly values from 1749 available here. The CET data I downloaded was the mean monthly values available here. I converted both to annual means as that was easier than converting the CET series to anomaly values, a step that would otherwise have been necessary to avoid incorporating the seasonal cycle (which is noise in this context). Therefore the "narrow time span" was merely the full overlapping time span on the data I had available. It was certainly a sufficiently long time span to test your thesis. Given that the data show a low correlation over 266 years, even if adding in the additional 49 years of annual data available on the SSN increased the correlation, it would merely show that increase to be coincidental.
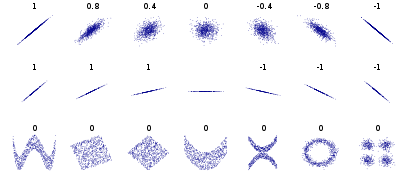
As to what the number mean, if two values are correlated, when one value is high, so also is the other; when one value is low, so also is the other; and when one value is near its mean, so also is the other. That is what correlation means. Pearson's product moment coefficient, or "Pearson's r", measures that tendency. That relationship can be seen when you plot the values against each other rather than each seperately against time, a type of plot which is called a scatter plot. In a scatter plot, values which are perfectly correlated, form a line with a positive slope. Values which a perfectly anti-correlated form a line with a negative slope. Uncorrelated values typically (but need not) form an an amorphous mass, but the trend of their scatter plot exhibits zero slope. These tendencies can be seen in this graph of various scatter plots with their correlation (Pearson's r) shown:
With this explanation, and given that you are "... a bit lost with number", here is the scatterplot of SSN vs CET from 1749-2015, using annual values. (I have normalized the data, ie, subtracted the mean and divided by standard deviation, to bring them to a comparable scale, but that has no effect on the shape of the graph.)
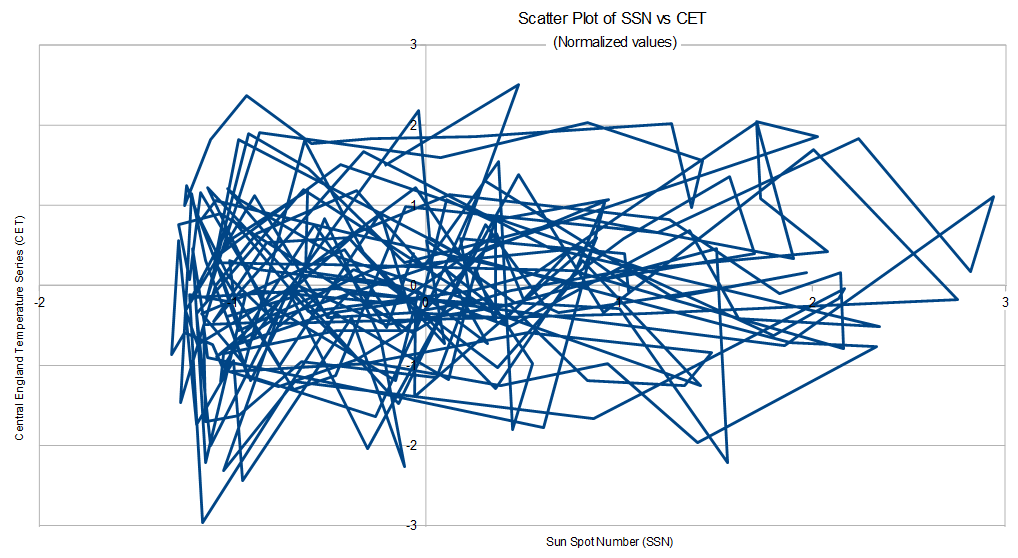
As you can see, there is little apparent trend, and the points are far from forming a simple line. That is, they are poorly correlated.
Given that you are drawing conclusions from the purported high correlation between the two, the actual low correlation refutes you completely.
-
nigelj at 06:36 AM on 30 November 2016Dear Mr President-elect: a message from across the Pond
Just on a related issue of climate history, a lot of people I talk to think global warming is a good thing because it could stop the next ice age. Trump may believe this himself. My understanding is global warming cant stop an ice age or even soften one.
From what I have read is if we burned all the fossil fuels on the planet, warming would last about 5,000 years and then start to return to lower temperatures well before the next ice age, let alone the ones after that. However I'm not certain how firm the science is on this issue.
I'm just thinking that the IPCC should perhaps discuss this in its advice to policy makers, and it needs more public awareness.
-
nigelj at 06:27 AM on 30 November 2016Dear Mr President-elect: a message from across the Pond
Your history makes for interesting reading, and I think your conclusions are 100% valid. However I dont think Trump really believes climate change was a scam invented by the Chinese. Trump is not quite that crazy. This was simply emotive rhetoric to get votes from his particular target audience.
Trump's positions appear to be somewhat flexible. However his appointment of hard line climate sceptics suggests that Obamas work will be at least partly scaled back. Trump may try to have climate change policy both ways to appease all interests, so he may keep some policy but quietly undermine other policies in the background. This needs to be watched carefully and exposed if it appears to be happening.
-
MA Rodger at 23:20 PM on 29 November 2016It's the sun
jifqam @1212,
You ask what other questions should be asked "in order to satisfy those in favor or anthropogenic or non anthropogenic cause of climate change?"
The CET and SSN data is but a few centuries in length. (Despite your efforts @1219, you fail to better this. Do remember you need two variables to carry out a comparison.) Both CET & SSN have shown signs of multi-century rising trends but in recent decades CET has continued to rise while SSN has paused and now shows a sharp downward trend. I conclude from this break in correlation that SSN must have no great infulence in CET. However you disagree. You say CET is greatly influenced by SSN but not since 1990. You do not provide an coherent explanation why the correlation held (roughly) for centuries and has now failed. @1212 you said "it may be intersting to find out why do temperatures sometimes follow the solar cycle and sometimes do not." Why is it? Coincidence. That is all. CET &SSN rise not in unison but in coincidence.
Let me make it more difficult for you. The IPCC conclude that CET & other global temperatures are not greatly affected by solar variation (ie SSN variation). IPCC AR5 figure 10.6 (pasted below) shows in figure 10.6 panel d) that the temperature rise resulting from solar forcing is small as are the wobbles in global temperature resulting from the solar cycle. The wobbles are about 0.1ºC in ampitude & result from SSN variation of roughly 200, or 2000(SSN)/ºC(CET). Does CET show such a wobble? What size is it?
If you detrend the wobbles in CET and in SSN by, say, calculating annual variation from an 11-year rolling average, the two records can be analysed for such a wobble. The CET-to-SSN correlation is not statistically significant suggesting SSN is not a major driver of wobbles in CET. But if you calculate correlations for CET with different levels of lag, you encounter a pretty little sine wave of ampitude roughly 0.0005 or 2000(SSN)/ºC(CET). This appears to confirm the IPCC result for the wobble size. They are small like the IPCC calculate. So if the wobbles are small, how can the trend be anything other than small?

-
jlfqam at 21:15 PM on 29 November 2016It's the sun
I am sorry, but I am a bit lost with number, especially when restricted to narrow time spans. Please take a look at this figure representing the isotope composition of the most recent layers from the antarctic ice core DomeC, in two time spans, compared the the obvious effect of solar irradiance on the ice, from the model by Lean 2000, which is frequently posted in this forum.

The sun clearly had an effect on the warming of antarctica since
 Maunder's Minimum to, lets say until the mid 1950's. NO more data is available from that site, unfortunately.
 Since the mid 1950's, if solar irradiance is decreasing but temperatures do not, you are right, there must be a buffering or thermostat effect, which is what we have to find before it's too late and the oceans start to cool down until the sun recovers.
Let me also post the linked figures from a previous posting which show how the sun has strenghtened the East Asian Monsoon that had reached a steady stated around 2kaBP after a continuous weakening since the Thermal Optimum of the Holocene around 7-9kaBP, due to the decrease in NH insolation caused by Earth Orbital Cyclicity.


If you are interested we can discuss in detail the ocean circulation mechanisms that have caused the contradictory warming during a net solar irradiance decrease. I have gathered enough data and plots to support that. As mentioned before, after over a decade of "time travel" to past climates, back to 50Ma, thanks to the free paleo climate proxy databases Pangaea and NOAA Paleo, we could select a good deal of hight quality data sufficient to explain how climate works. Unfortunatly it's difficult to publish in official media for the obvious reasons everybody is aware of.
Collaboration of specialists in getting field data, data comparison, mathematical correlation and good scientific writing will be necessary because, unfortunately, those qualities are not available in one single person. In this particular and complex topic of climate, there is no "super scientist" as someone may expect, hence "real" and positive collaboration is the only way to succeed.
Thanks again for letting comments to be posted freely and the constructive replies from readers
Best
JLF
Moderator Response:[JH] Please note that all graphics included in comments must be restricted to 500 pixels in width in order to preserve the integrity of the column. You have repeatedly posted graphics that exceed the width restriction. Moderators have reduced the size of the graphics and have politely asked you to adhere to the width restriction. Please do so in the future.
-
jlfqam at 20:21 PM on 29 November 2016Climate Change Cluedo: Anthropogenic CO2
Continuation of 59 jlfam,
Yes we can see slightly more negative values in the higher latitude d18O values from the figure above, but only during seasonal minima of CO2 production, notice how maximum seasonal CO2 values coincide with more positive or eriched 18O values. This discards mainland as the source or seasonal CO2 production peaks. Mainland CO2 18O are more depleted in the heavy isotope 18O due to isotope fractionation processes that carry water from the ocean surface to the land.
I have prepared a table comparing the seasonal variation of the different parameters measured in the Scripps Station at Mauna Loa, since it's the classic to compare atmospheric CO2 values.
CO2 concentration [{CO2], d8O, d13C, D14C and O2 concentration [O2].
The background value to which seasonal variations are added or subtracted is indicated by an equal sign (=).
A plus sign (+) means the value increases seasonally (either concentration [CO2] or [O2], or the isotope values become more enriched in the heavy isotope (for example d18O,+, increases 18O/16O ratio)
A minus sign (-) means the opposite, a seasonal decrease in concentration or an isotope depletion, the light isotope 12C, 16O becomes more abundant in the ratio 13C/12C, 18O/16O, or the D14C suggests older values, lower 14C/12C ratio values.
Question mark (?), means its open for discussion with specialists.
The Peclet effect is related to plant metabolism, its inclusion in the table has been suggested by a well known plant metabolism and isotope specialist.

The possible sources list is not complete, new suggestions are welcome.
For example, at mloa, an increase in CO2 concentration shows that the CO2 18O isotope ratio is simultaneously more enriched, delta13C takes more depleted values, D14C shows more negative or older values and the [O2] also decreases. This is seen by comparing one by one the plots and data available from here. About [O2], a decrease in concentration when the CO2 concentration increases fits perfectly with water upwelling from the deepest ocean regions which are obviously depleted in oxygen due to microbial respiration. Take a look at this figure from Scripps station.
http://scrippso2.ucsd.edu/sites/default/files/pdfs/plots/daily_avg_plots/mlo.pdf

Dole means, the d18O value depends on the Dole effect, that is the isotope fractionation of photosynthetic O2, which includes a background value from metabolic water.
http://scrippsco2.ucsd.edu/graphics_gallery/isotopic_data/
I prefer each one of the readers to do the work, to avoid any alledged manipulation of the data from this writer.
As you may see the only source that fulfills the same conditions shown by Mloa station is the ocean upwelling.
I will be glad to discuss any details and accept any correction.
To illustrate why the upwelling may be the main source of CO2 at mloa, please take a look at Takahashi's team arduous task represented in this map of CO2 sources from the ocean. Notice how close are the Hawaii Islands from the bicarbonate, CO2 rich waters of the Tropical Pacific.
http://www.ldeo.columbia.edu/res/pi/CO2/
On this page it's shown how the concentrations of ocean surface CO2 change seasonally, (figures can be expanded indiviually in separate browser tabs)
http://www.ldeo.columbia.edu/res/pi/CO2/carbondioxide/pages/pco2_maps.html
Thanks for letting me post this and comments and for the constructive replies.
Best
JLF
-
jlfqam at 19:25 PM on 29 November 2016Climate Change Cluedo: Anthropogenic CO2
Hi,
let me please start a discussion on the source of CO2(atm) based on the 18O isotope composition. This reply comes from this posting
http://www.skepticalscience.com/argument.php?a=508#119448
Let me please continue, the 18O isotope composition in atm CO2 is key to understand the sources.

The lack of any significant trend in d18O reveals there's one main source of CO2 Oxygen atoms. The seasonal variation gives clues on the two alternating sources.
If the Oxygen comes from atmospheric O2 by combustion, there are two main sources of photosynthetic O2, terrestrial and marine organisms.
In this posting, I have already discussed with more detail the reactions involved.
http://www.skepticalscience.com/argument.php?a=508#119450
Photosynthetic O2, has the isotopic signature of the water the organisms use in their metabolism.
As convention, the 18O isotope composition of sea water is taken as zero, although, deep and surface ocean waters show important diferences.
Terrestrial waters, come from precipitation waters that have markedly depleted delta18O and deltaD values.
In this link we see how isotopes distribute over the continents
http://wateriso.utah.edu/waterisotopes/pages/data_access/figure_pgs/global.html
for example this one shows the distribution of annual mean18O values.
Seasonal variation is significant.
http://wateriso.utah.edu/waterisotopes/media/IsoMaps/jpegs/o_Global/oma_global.jpg

According to this map we should expect significant isotope diferences depending on the source of Photosynthetic O2. Basically from higher latitudes of the Northern Hemisphere CO2 would acquire more depleted of negative d18O values. Which is not observed in the Scripps d18O figure above.
-
jlfqam at 19:00 PM on 29 November 2016CO2 increase is natural, not human-caused
Thanks Tom,
I will post the answer in the corresponding forum page. I am sorry I did not find it first.
http://www.skepticalscience.com/anthrocarbon-brief.html
-
jdeutsch at 12:07 PM on 29 November 2016Trump or NASA – who's really politicising climate science?
And lest we forget, LBJ in 1961...
http://www.skepticalscience.com/LBJ-climate-1965.html
Moderator Response:[PS] Fixed link
-
michael sweet at 12:01 PM on 29 November 20162016 SkS Weekly Climate Change & Global Warming News Roundup #48
This New York Times article describes loss of value in beach front property from sea level rise. If more articles like this one are published, it will start to draw attention from developers and their potential buyers. Perhaps if scientists emphasize damage to beach front properties it will become an important point faster.
Hit them in the wallet to get the most attention. Trump and his ilk do not care about poor people starving due to climate change. He will care a lot when the insurance on his Mar A Largo property goes up 200%.
-
Tom Curtis at 07:45 AM on 29 November 2016It's the sun
jflqam @1214, the correlation between the Central England Temperature Series and the Sun Spot Number using annual means from 1749 to 2015 is 0.122, with an R-squared of 0.015. That is, ignoring other correlated or anti-correlated causal factors, solar variation accounts for just 1.5% of annual variation in the Central England Temperture series. Given the weak correlation between SSN and CET series, the complete breakdown of correlation after 1990 (r=0.101; r^2 =0.01) hardly needs special explanation.
Prev 429 430 431 432 433 434 435 436 437 438 439 440 441 442 443 444 Next


