


 Arguments


Climate Change Cluedo: Anthropogenic CO2
Posted on 25 July 2012 by Tom Curtis
Anthropogenic CO2?
The human-caused origin (anthropogenic) of the measured increase in atmospheric concentrations of CO2 is a cornerstone of predictions of future temperature rises. As such, it has come under frequent attack by people who challenge the science of global warming. One thing noteworthy about those attacks is that the full range of evidence supporting the anthropogenic nature of the CO2 increase seems to slip from sight. So what is the full range of supporting evidence? There are ten main lines of evidence to be considered:
- The start of the growth in CO2 concentration coincides with the start of the industrial revolution, hence anthropogenic;
- Increase in CO2 concentration over the long term almost exactly correlates with cumulative anthropogenic emissions, hence anthropogenic;
- Annual CO2 concentration growth is less than Annual CO2 emissions, hence anthropogenic;
- Declining C14 ratio indicates the source is very old, hence fossil fuel or volcanic (ie, not oceanic outgassing or a recent biological source);
- Declining C13 ratio indicates a biological source, hence not volcanic;
- Declining O2 concentration indicate combustion, hence not volcanic;
- Partial pressure of CO2 in the ocean is increasing, hence not oceanic outgassing;
- Measured CO2 emissions from all (surface and beneath the sea) volcanoes are one-hundredth of anthropogenic CO2 emissions; hence not volcanic;
- Known changes in biomass too small by a factor of 10, hence not deforestation; and
- Known changes of CO2 concentration with temperature are too small by a factor of 10, hence not ocean outgassing.
Annual emissions of CO2 by human use of fossil fuels rose from 3 million tonnes of Carbon (11 million tonnes of CO2) in 1751 to 54 million tonnes of Carbon (198 million tonnes of CO2) in 1850. After that fossil fuel use rose sharply so that by 2008, annual emissions (including from cement manufacture) had risen to 8749 million tonnes of Carbon (32 billion tonnes of CO2). The rise in the atmospheric concentration of CO2 also began around 1750 and has followed the emissions up. This extraordinary coincidence strongly suggests that anthropogenic emissions are the cause of the rise in CO2 concentration.
The increase in CO2 concentration over the long term (1850-2005) almost exactly correlates (corr.: 0.997; R^2: 0.993) with cumulative anthropogenic emissions from all sources including Land Use Change (LUC). The close correlation has continued in recent times, with a correlation of 0.9995 when compared to the Mauna Loa record (r^2: 0.999). So exact a correlation would be extraordinary if anthropogenic emissions were not the cause of the increase in CO2 concentration.

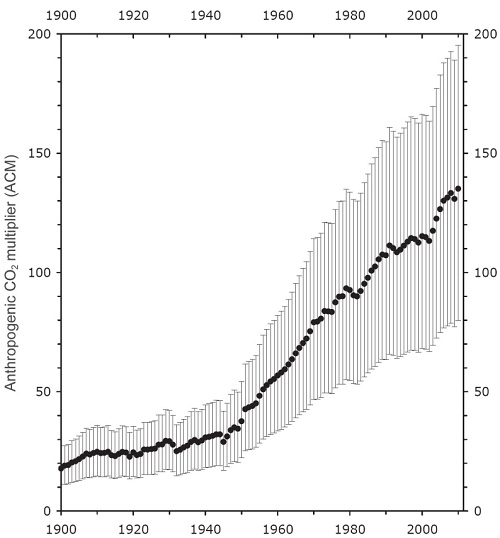
Over the course of the twentieth century, the increase in CO2 in the atmosphere measured in tonnes has been less than anthropogenic emissions in every year, and has averaged only 44% of anthropogenic emissions over the period from 1850-2005. Indeed, growth in atmospheric emissions probably has not exceeded anthropogenic emissions since the early 1880s, approximately the time anthropogenic emissions reached the equivalent of 0.45 ppmv of atmospheric concentration. It is interesting to note that the airbourne fraction, ie, the atmospheric increase divided by total emissions, has increased slightly in recent times. This means that natural carbon reservoirs have acted as a net sink over the course of the 20th century, and strongly indicates that the source of the increase in CO2 concentration is anthropogenic.
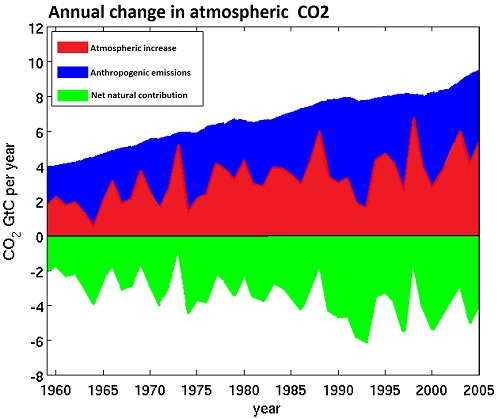
(Adapted from Cawley, 2011; data from CDIAC)
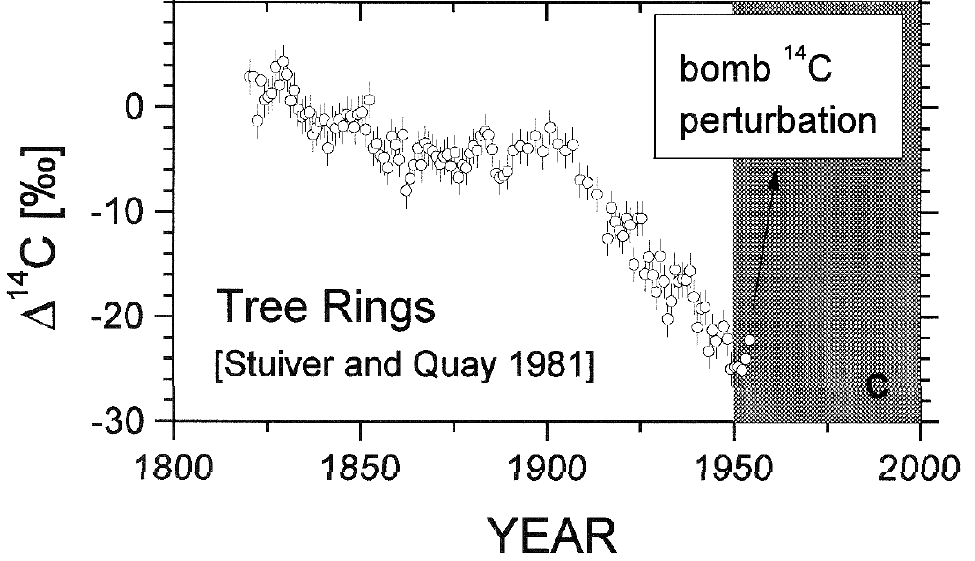
Carbon 14 is formed in the atmosphere by collisions between cosmic rays and Nitrogen. It has a very short half life (5,730 years), but atmospheric C14 is continuously replenished, maintaining a near constant concentration. Buried C14 is not replenished, however. As a result, whether from volcanoes or fossil fuels, CO2 from long-buried sources has effectively no C14. The addition of large quantities of CO2 from a long-buried source to the atmosphere will result in a significant decline in C14 concentration in the atmosphere, which is what we see. More recent, high precision measurements show the decline in C14 continued after the end of atmospheric nuclear testing.This is strong evidence that the source of the increased concentration of CO2 is fossil carbon, either from volcanoes or from fossil fuels.
Carbon has two stable varieties (isotopes), C12 an C13. Because C13 has an extra neutron, it is heavier. In photosynthesis, most plants find it easier to take up the lighter C12, and do so at a higher rate than they take up C13, with the result that carbon compounds formed from the products of photosynthesis, including plants, animals and fossil fuels have a lower C13 to C12 ratio than does the atmosphere. Introducing a large quantity of CO2 derived from photosynthesis would cause the C13/C12 ratio to decline. In contrast, CO2 introduced from volcanoes or from outgassing from the ocean would not significantly affect the C13/C12 ratio. In fact the global C13/C12 ratio has declined, which is very strong evidence the source of the CO2 increase has was C12 enriched, ie, derived from photosynthesis. Therefore it is very strong evidence that it comes from the biosphere or fossil fuels, rather than from volcanoes or oceanic outgassing.
6) Declining oxygen concentration
Because the change in solubility of O2 in water with change in temperature significantly differs from that of CO2, the change in O2 concentration is not affected by other possible CO2 sinks. That means the decline in CO2 concentration means any large unknown natural sources of CO2 must not come from a source of combustion but must come from a low C14 source generated by photosynthesis. These facts together almost completely preclude the existence of such putative natural sources. Because of the importance of the O2 decline, it is worthwhile looking at the chart below from the IPCC TAR which shows it:
(Source)
The observed decline in O2 is straightforward. The diagonal arrow from the start point marked "fossil fuel burning" represents the expected change in CO2 and O2 concentrations from known fossil fuel consumption. The arrow marked "ocean uptake" represents the uptake of CO2 by the ocean, which does not affect the O2 level. The arrow marked "land uptake" is the uptake of CO2 and release of O2 by photosynthesis, which also decreases the CO2 concentration and increases the O2 concentration. Finally, the small arrow marked "outgassing" represents outgassing of O2 from the ocean, which does not affect CO2 concentration. That outgassing is partly the result of a warming ocean, and partly a result of the very slight decrease in the partial pressure of oxygen in the atmosphere. These factors are reasonably, but not exactly known. It is important to note that because the fall in O2 concentration is significantly less than that predicted from known combustion of fossil fuels, the uptake of CO2 by photosynthesis must exceed the combustion or decay of modern organic material from either anthropogenic (Land Use Changes) or natural sources.
7) Increasing CO2 concentrations in the ocean
Simultaneously with the rise in the concentration of CO2 in the atmosphere, the concentration of CO2 (and its equilibrium products) in the ocean has been increasing. The rise in CO2 in the ocean is referred to as an increase in the "partial pressure" of CO2, and results in a simultaneous decline in the partial pressure of Hydrogen (pH), ie, an increase in the ocean's acidity. If the amount of CO2 in the ocean was falling, the partial pressure of CO2 would be falling, and the pH rising. This is very strong evidence that oceanic outgassing is not the cause of the rise in atmospheric CO2.
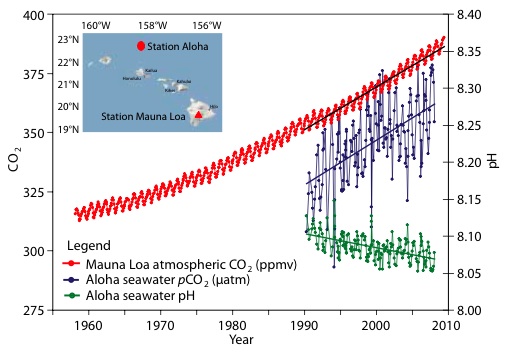
(Source )
8) Measured volcanic emissions
Scientists have used a variety of methods to determine the CO2 emissions from volcanoes. A common method is to use a tracer gas, ie, a gas emitted from volcanoes but which does not stay in the atmosphere for long. Determining the emissions rates of the tracer gas from volcanoes, together with the concentration of those gases in the atmosphere allows the overall level of volcanic activity to be measured. Once that is measured, measurements determining average rates of CO2 emissions for a given amount of activity can be used to determine the global CO2 emissions from volcanoes. Other techniques are used to measure CO2 emissions from volcanoes, mid-ocean ridges and subduction zones under the sea. The emissions, from all volcanoes, both on land and under sea, are about one hundredth of anthropogenic emissions. While there may be some error in the estimates, it is unlikely that the error would be large enough for volcanoes to be emitting a sizable fraction of anthropogenic emissions. That strongly suggests volcanic emissions are not the source of the increased CO2 concentration.
(Ratio of anthropogenic to volcanic CO2 emissions; source)
Anthropogenic Emissions from Land Use change and deforestation represent 10% of all human emissions (0.9 PgC of 10 PgC). Over the last century, human-caused deforestation and other land use changes have been by far the largest cause of change in land cover, and hence natural changes cannot be significantly larger than that.(Source) Indeed, as discussed regarding the declining oxygen concentration, that decline together with the land uptake shows that the biosphere is a net sink for CO2.
10) Past changes in CO2 concentration
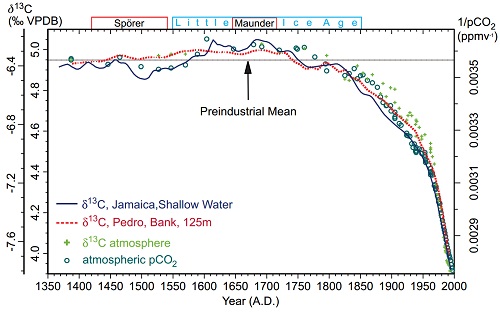
During past "ice ages" (glacials) CO2 concentrations have correlated with temperature, with approximately a 22 ppmv increase in CO2 for every 1 degree increase in temperature. In more recent historical times, there was an increase in CO2 concentration during the Medieval Warm Period (MWP) relative to the Little Ice Age (LIA) of about 10 ppmv for approximately a 1 degree C change in temperature. Given that global temperatures have increased by 0.7 C since 1850, we would expect an increase in CO2 concentration of between 7 and 15 ppmv based on historical precedents. That CO2 concentrations have increased by approximately 110 ppmv over that period is very strong evidence that the source of the increase was not outgassing from the ocean.

(Source)
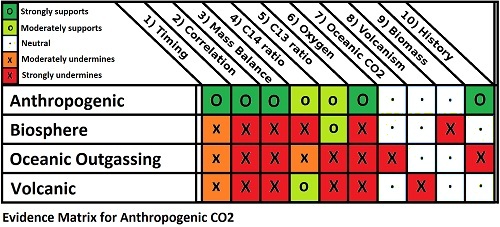
Playing Climate Change Cluedo
As a child I enjoyed playing Cluedo (Clue in the US market). I soon learned you discovered more from the questions people did not respond to than from those that they did, and developed a matrix from which to plot responses and non-responses. Filling in the matrix soon honed in on the correct answer, who killed whom, with what and where. Science is sometimes like that. The lines of evidence are the questions we put, and if we plot out our matrix, it quickly becomes clear that it is the humans who have caused the rise in CO2 levels, by burning fossil fuels in the twentieth century. Every other hypothesis makes a host of predictions that do not pass the test of the evidence.
Correction: The figures in section (2) have been corrected as of 12:45 PM, 29/07/2012. The nature and reason for the correction explained in my comment of 12:40 PM of that date.
The figure for the airborne fraction in section 3 was corrected at 8:54 AM, 18 th Feb, 2013.


Thanks for a very good summary of the topic. However, I think it takes a very geological mind to describe 14C as having a " very short half life (5,730 years)". Our perspectives are different in this matter.
Mattias Ö true, but a "very geological mind" is exactly the sort that is needed in working out how much 14C we should expect to see in fossil feuls (i.e. practically none). ;o)
Elsewhere gac73 has linked to some pseudoscientific drivel as an example of "common sense" science. An example of the author (Timothy Casey) of the drivel style is shown by his table of emmissions per annum from various volcanoes. Unfortunately for him, one of his sources (Shinohara, 2008) is available free online. Consulting that work we find that Shinohara lists total emissions for an erruption event, not emissions per annum (see table 3, and discussion in text). While erruptions typically take less than a year to occur, they do not represent ongoing emissions and presenting them as such distorts his source.
One further misrepresentation (among a host) is Casey's is in his discussion of C13 where he suggests volcanic CO2 could account for the the modern rise in CO2. In fact, volcanic CO2 is C13 depleted relative to the Vienna Pee Dee Belemnite Standard having a d13C of -4 in most cases, but up to -12 at convergent plate boundaries. For comparison, fossil fuels have a d13C of -27, and the atmosphere has a d13C of -8. That is right. The atmosphere is C13 depleted relative to the standard, and the vast majority of volcanoes are not depleted relative to the atmosphere, ie, volcanic eruptions typically enrich the atmosphere with C13. Casey creates the opposite impression by only noting the C13 depletion relative to the standard reference case, but leaving that technical detail unclear.
(Sources of data for the C13 discussion are noted at my Notes for the OP here, found on my blog.)
Hi,
let me please start a discussion on the source of CO2(atm) based on the 18O isotope composition. This reply comes from this posting
http://www.skepticalscience.com/argument.php?a=508#119448
Let me please continue, the 18O isotope composition in atm CO2 is key to understand the sources.
The lack of any significant trend in d18O reveals there's one main source of CO2 Oxygen atoms. The seasonal variation gives clues on the two alternating sources.
If the Oxygen comes from atmospheric O2 by combustion, there are two main sources of photosynthetic O2, terrestrial and marine organisms.
In this posting, I have already discussed with more detail the reactions involved.
http://www.skepticalscience.com/argument.php?a=508#119450
Photosynthetic O2, has the isotopic signature of the water the organisms use in their metabolism.
As convention, the 18O isotope composition of sea water is taken as zero, although, deep and surface ocean waters show important diferences.
Terrestrial waters, come from precipitation waters that have markedly depleted delta18O and deltaD values.
In this link we see how isotopes distribute over the continents
http://wateriso.utah.edu/waterisotopes/pages/data_access/figure_pgs/global.html
for example this one shows the distribution of annual mean18O values.
Seasonal variation is significant.
http://wateriso.utah.edu/waterisotopes/media/IsoMaps/jpegs/o_Global/oma_global.jpg
According to this map we should expect significant isotope diferences depending on the source of Photosynthetic O2. Basically from higher latitudes of the Northern Hemisphere CO2 would acquire more depleted of negative d18O values. Which is not observed in the Scripps d18O figure above.
Continuation of 59 jlfam,
Yes we can see slightly more negative values in the higher latitude d18O values from the figure above, but only during seasonal minima of CO2 production, notice how maximum seasonal CO2 values coincide with more positive or eriched 18O values. This discards mainland as the source or seasonal CO2 production peaks. Mainland CO2 18O are more depleted in the heavy isotope 18O due to isotope fractionation processes that carry water from the ocean surface to the land.
I have prepared a table comparing the seasonal variation of the different parameters measured in the Scripps Station at Mauna Loa, since it's the classic to compare atmospheric CO2 values.
CO2 concentration [{CO2], d8O, d13C, D14C and O2 concentration [O2].
The background value to which seasonal variations are added or subtracted is indicated by an equal sign (=).
A plus sign (+) means the value increases seasonally (either concentration [CO2] or [O2], or the isotope values become more enriched in the heavy isotope (for example d18O,+, increases 18O/16O ratio)
A minus sign (-) means the opposite, a seasonal decrease in concentration or an isotope depletion, the light isotope 12C, 16O becomes more abundant in the ratio 13C/12C, 18O/16O, or the D14C suggests older values, lower 14C/12C ratio values.
Question mark (?), means its open for discussion with specialists.
The Peclet effect is related to plant metabolism, its inclusion in the table has been suggested by a well known plant metabolism and isotope specialist.
The possible sources list is not complete, new suggestions are welcome.
For example, at mloa, an increase in CO2 concentration shows that the CO2 18O isotope ratio is simultaneously more enriched, delta13C takes more depleted values, D14C shows more negative or older values and the [O2] also decreases. This is seen by comparing one by one the plots and data available from here. About [O2], a decrease in concentration when the CO2 concentration increases fits perfectly with water upwelling from the deepest ocean regions which are obviously depleted in oxygen due to microbial respiration. Take a look at this figure from Scripps station.
http://scrippso2.ucsd.edu/sites/default/files/pdfs/plots/daily_avg_plots/mlo.pdf
Dole means, the d18O value depends on the Dole effect, that is the isotope fractionation of photosynthetic O2, which includes a background value from metabolic water.
http://scrippsco2.ucsd.edu/graphics_gallery/isotopic_data/
I prefer each one of the readers to do the work, to avoid any alledged manipulation of the data from this writer.
As you may see the only source that fulfills the same conditions shown by Mloa station is the ocean upwelling.
I will be glad to discuss any details and accept any correction.
To illustrate why the upwelling may be the main source of CO2 at mloa, please take a look at Takahashi's team arduous task represented in this map of CO2 sources from the ocean. Notice how close are the Hawaii Islands from the bicarbonate, CO2 rich waters of the Tropical Pacific.
http://www.ldeo.columbia.edu/res/pi/CO2/
On this page it's shown how the concentrations of ocean surface CO2 change seasonally, (figures can be expanded indiviually in separate browser tabs)
http://www.ldeo.columbia.edu/res/pi/CO2/carbondioxide/pages/pco2_maps.html
Thanks for letting me post this and comments and for the constructive replies.
Best
JLF
Sorry,
I forgot pasting the map of ocean surface CO2 concentration,
Notice how close is the Mauna Loa station (Hawaii, filled black Circle) to the ocean CO2 rich waters
http://www.ldeo.columbia.edu/res/pi/CO2/
And just one more plot, please take a look at the "good" correlation (I would say, one of the best I could find from independent measurements of natural phenomena) between the Mauna Loa CO2 18O isotope composition, right end plot in 59-jlfqam posting above, and the NINO3 ocean surface temperature series.
Data sources
http://www.esrl.noaa.gov/psd/data/correlation/nina3.data
LINK
My question is, how is it possible the surface ocean temperature over the equatorial pacific affects the isotopic composition of the CO2(atm) produced by independent sources such as fossil fuel burning anywhere on the Planet?
An alternative, and very simple explanation, could be the CO2 measured at Mauna Loa station emanates from the CO2-rich ocean waters of the tropical Pacific Ocean.
Thanks for your attention
Best
JLF
[PS] Perhaps see the article here . (and dont forget isotopic signature of atmospheric CO2 is consistent with FF not ocean). What is your "simple" explanation for where the FF we have burnt is gone if magically not increasing CO2 in atmosphere? You can use the "Arguments" menu item above to find responses to common myths. You seem to be engaged in a effort to find anything except CO2 (which is by the simplest explanation). Perhaps time to ask yourself where this bias comes from?
[RH] Shortened link.
61 jlfqam:
"An alternative, and very simple explanation, could be the CO2 measured at Mauna Loa station emanates from the CO2-rich ocean waters of the tropical Pacific Ocean."
Short answer: No!
If you are suggesting that much of the CO2 measured at Mauna Loa is a result of oceanic out gassing, then you are wrong. CO2 is measured all over the world, and once you get away from large local sources or sinks, the background concentrations and trends are almost identical.
This graph is based on direct measurements, with the seasonal variations removed. If you find it hard to distinguish the curves, it should be obvious that there isn’t anything special about the atmosphere around Mauna Loa. CO2 really is a well-mixed gas, far more so than gases like water vapour, ozone or even methane.
And BTW, your first map does not show ocean surface CO2 concentration, but the net CO2 exchange between the atmosphere and ocean. Red is oceanic uptake, while violet shows oceanic out gassing.
jlfqam @61, in addition to HK's fine response, I will note that at the location of Mauna Loa, the CO2 air-sea flux is slightly negative, according to the map you show. Further, it is no closer to the strong positive flux in the tropical east pacific than it is to the strong negative flux at about 40 degrees north in the west pacific. That directly contradicts your claim that "upwelling may be the main source of CO2 at mloa".
Answer to HK 62
the color scale in the ocean surface CO2 fluxes is related to the flux of CO2 from the ocean to the atmosphere.
This figure shows the pCO2, that is the pressure of dissolved CO2 in the ocean
http://www.ldeo.columbia.edu/res/pi/CO2/carbondioxide/global_ph_maps/pco2_maps.html
This paper shows clearly the pacific ocean being the largest source of CO2 of the planet
Gruber et al
Oceanic sources, sinks, and transport of atmospheric CO2
http://ocean.mit.edu/~stephd/gruber_gbc_09.pdf
Figure 2. Comparison of the ocean inversion estimate of the contemporary sea-to-air CO2 flux with that based on the pCO2 climatology of Takahashi et al. [2008] for each of the 23 regions resolved by the ocean inversion. The zero-line crossing of each flux estimate indicates the region that this flux belongs to. Small gray numbers indicate the region number (see Table S1 for the region name). Positive fluxes indicate outgassing.
Rgarding Tom Curtis 63,
If you take a look at the seasonal variations of pCO2
http://www.ldeo.columbia.edu/res/pi/CO2/carbondioxide/pages/pco2_maps.html
you may see how the Hawaii Islands are bathed by waters with variable CO2 concentrations, which I would say fits the seasonality of the CO2 curve.
Thanks for continuing the discussion, it helps me think about new ways to reinforce the arguments in favour of a natural source for atmospheric CO2.
jlfqam,
You need to read why Mauna Loa (SkS link)was chosen by experienced scientists to measure CO2. The volcano is so high that it touches the bottom of the upper atmosphere. The CO2 is well mixed from around the world and is only slightly affected by any outgassing of the ocean. Your claim that ocean outgassing affects their measurements is incorrect. Read more, conclude less. You are reviewig very well explored material.
The entire ocean is a CO2 sink. Every year the ocean absorbs more CO2 from the atmosphere than it releases to the atmosphere. Your claim that the ocean is a source of CO2 to the atmosphere is incorrect. Perhaps you mean that the ocean flux affects the isotopic composition of the CO2 in the atmosphere but you need to be more clear what you are claiming. Read your sources more carefully.
You would be much better off if you asked questios about what you do not understand. Instead you make incorrect claims based on your own reasoning. This material has been very closely studied by others with much more experiece. You are more likely to reach an incorrect conclusion (like the two above) because you do not know as much as the experienced scientists than you are to find a mistake that they have made. If you ask questions you will be better received here than if you make incorrect claims based on your own reasoning. People are happy to help you understand the science.
Good luck.
jlfqam @64, where you write, "This figure shows the pCO2, that is the pressure of dissolved CO2 in the ocean", you then provide the URL for a series of monthly maps of surface water partial pressure of CO2 such as this one:
I have chosen this example as it shows the highest monthly pCO2 at Mauna Loa's longitude and latitude. Never-the-less, at that longitude and latitude, the colour shown is green, verging on light blue indicating a pCO2 between 350 and 375 ppmv. In 2005, the atmospheric CO2 concentration was 380 ppmv. The lower pCO2 at Mauna Loa therefore implies a net atmosphere to ocean flux at that location, consistent with the map you showed @61 and on which I commented @63.
In your post @61, you introduced the map as indicating the waters around Mauna Loa were particularly CO2 rich. It is possible you consider the maps of pCO2 (which show highest values in the tropics), as substantiating that claim. That would be a mistake. Specifically, pCO2 is a function not only of the total amount of CO2 dissolved, but also of the temperature of the water. In fact, looking at actual dissolved CO2, we find that those regions with the highest pCO2 also have the lowest total CO2 dissolved; while the highest quantities of total CO2 are to be found in the Antarctic Ocean:
This paradoxical result is a consequence of the large temperature gradient in surface waters from poles to tropics.
In any event, not only are you trying to supplant the theories of climate scientists which they derived to explain the data they collected, and which you peruse; but you have shown a consistent pattern in misdescribing that data. It is hard enough to find a better theory for the data than that held by professional scientists, given their expertise, time, and the many person/years of cooperative research that has gone into any of those theories. Trying to do so without getting the data right is pointless.
Finally, yes there are seasonal variations in pCO2 and ocean/atmosphere CO2 flux at Mauna Loa, just as there is at Cape Grim (Tasmania) and in the waters surrounding the Antarctic (where the seasonal variations are exceptionally large). Yet seasonal variation in CO2 concentration is much reduced in the Southern Hemisphere, and virtually non-existent at the South Pole. If ocean/atmosphere flux was the cause of the measured seasonal variation at Mauna Loa, it would have the same effect at Cape Grim and the South Pole, resulting in an equally large seasonal variation at Cape Grim, and a larger one at the South Pole.
In contrast, the SH has far fewer deciduous plants than the NH, partly due to reduced land mass but also due to a greater preponderance of evergreens. The South Pole lacks deciduous plants entirely. That gives the true, primary cause of the seasonal variation on CO2 concentration - the seasonal cycle of deciduous plants.
jifqam,
I think it might be useful to to emphasis the point made by michael sweet @65 paragraph 2.
The graphic from Gruber et al (2009) 'Oceanic sources, sinks, and transport of atmospheric CO2' presented @64 shows various annual CO2 flux for various ocean regions. These are net fluxes per region. Add them up and they total to about 2.2Pg(C) flux into the ocean and 0.5Pg(C) out of the ocean. The paper tells us global net figure includes " an uptake flux of anthropogenic carbon of 2.2 ± 0.3 Pg C/y(inversion) and 1.9 ± 0.7 Pg C/y(pCO2-climatology)." This represents about a quarter of our anthropogenic CO2 emissions which today total about 10Pg(C)/year and so it is our anthropogenic emissions that are truly "the largest source of CO2 of the planet." Your interpretation of the Gruber et al graphic is based on a flux from the Pacific of just 0.3Pg(C)/year.
Yet the carbon cycle shows the gross fluxes to be far higher than the net fluxes. This is not controversial.
Annually, the gross flux is about 92Pg(C) flux into the ocean and 90Pg(C) out of the ocean. Any discussion of Δ18O must take account of these gross fluxes.
The link to the graphic at Item 6 in the OP is broken. I assume it is TAR Fig 3.1 that should be showing.
[DB] Link to IPCC TAR WG1 Fig 3.4 above updated.
What does Tom mean by "atmospheric emissions of CO2" ? Is he referring to the portioin returned to the sinks? Can anyone please explain better to me his mass balance and declining O2 concentration concepts in his items #3 and #6 ? Thanks!
Alonerock,
For #3: Each year humans release into the atmosphere about 24 billion tons of CO2. Those tons are the "atmospheric emissions of CO2". At the end of the 2018 there will be about 12 billion more tons of CO2 in the atmosphere than there was at the end of 2017.
That means that the amount of CO2 that remains in the atmosphere is less than the amount of CO2 that humans emitted. Since the amount of increase of CO2 in the atmosphere is less than the amount hmans emitted, all the increase in the atmosphere comes from the human emissions.
The ocean absorbs and emits a lot of CO2 each year, much more than 24 billion tons. That does not contribute to increasing atmpspheric concentration because we know all the increase comes from human emissions. If fact, the ocean absorbs more CO2 from the atmosphere than it emits every year so it is a sink of CO2 and not a source.
The mass balance is the accounting for all the CO2 emitted each year from every source and showing where it goes by the end of the year. The amount emitted and the amount at the end of the year must balance.
For #6, if the CO2 came from volcanoes no oxygen would be used up in generating the CO2 since the CO2 from volcanoes comes out of the volcanoes as CO2. We measure that O2 in the atmosphere is decreasing. This decrease of O2 is just the same amount that would be used to generate the 24 billion tons of CO2 that humans generate each year. That shows that the CO2 in the atmosphere comes from burning fossil fuels and does not come from volcanoes. Volcanoes only emit about 200 million tons of CO2 each year (1% of human emissions) source.
Does that address your questions?
Excellent! Thanks very much for your clearification. I was confused because I would consider atmospheric emmissions as anthropogenic emissions. My apologies. My expertise is biogeochemistry and Holocene forsest ecology dynamics of the Central New Hampshire Region and as such, the climate change issue is of grave concern to me concerining abundance and distribution of species- so much so, that I have about 200 pages addressing it in one chapter of my book I have been writing for the past 20 years based on document, field and parol evidence of in excess of 500 sites I am studying.
The massive inertia of the ocean appears to be a serious problem for which naysayers do not account, enabling a huge lagtime for consequences. They will someday learn, nature bats last.
This is some non-scholarly text that I recently wrote for our local paper concerning climate change that you might enjoy:
Real Eyes Realize Real Lies
The True Story of Climate Change, Part I
Historically, the natural changes in global climate have occurred at rates that enable species to either survive by adapting, evolving, or relocating, or in the case of extreme events, species perish. With extinction comes consequences of reduced biological diversity and many other ecological problems.
The biological species that live on Earth are able to do so largely in part due to many complex biogeochemical relationships which include the precarious balance of energy coming into Earth from the Sun with that of the heat radiated back out into space.
Irrefutable scientific evidence indicates that commencing with human activities associated with the the industrial revolution, there has been an anthropogenic induced trend of more energy coming in to Earth than is being radiated back out into space. Until this energy balance is restored, the planet will continue to warm, and will do so at a non-typically increased rate.
The major reason for present climate warming is the elevated level of atmospheric CO2, which has not existed at current levels for in excess of 600,000 years. Destructive events associated with continued increasing atmospheric CO2 concentrations will include continually increasing global temperatures, increased intensity and frequency of storms and wildfires, increasing drought and flood events, rise in sea level and if carrying on business as usual, a mass extinction of species.
The climate change issue is a grave inter-generational matter in which the present generation, through their current production of comparatively inexpensive fossil fuel emissions, benefit briefly, while burdening future generations with the long-term negative and perhaps irreversible destructive ecological effects resulting largely from an irresponsible, decadent behavior.
The climate change issue is clouded by misinformation. The confusion stems largely from ignorance or greed. Most non-scientists lack the time, desire or ability to acquire a collective in-depth knowledge of chemistry, biology, physics, geology, botany, mathematics, oceanography, thermodynamics and meteorology which form the basic foundation necessary for understanding climate change. In recent decades, due to ignorance or dishonesty, the issues have been in many cases, tragically corrupted into a political tool to promote many socio-ecological failures involving concepts of world government, denial of problems associated with over- population and destruction of entire terrestrial ecosystems along with a re-distribution of wealth, all the while exhibiting a blatant disregard of long-term environmental consequences involving the burning of fossil fuels. Much of the misinformation peddled by scientific impostors and those of morally questionable economic interests or dark political agendas is carelessly accepted by people, many of whom lack the understanding, are unwilling to sacrifice their perceived luxuries, find the truth too disturbing to accept or fail to acknowledge a planet of finite resources and limited resilience. Such people often become easy prey for self-appointed climate change “expert” skeptics. Additionally, it is often difficult to get a person to accept the truth when their livelihood depends on denying it. The “American Dream” is in fact, largely based on the erroneous concept of unlimited natural resources.
Furthermore, a great deal of confusion regarding the understanding of climate change results from comparing unrelated temporal or spatial scales of weather and climate or cherry-picking data to support a particular position as well as a general misunderstanding of terms or concepts. It is all about statistics/trends- not individual events. Make no mistake, the distribution of extreme events is swiftly shifting inward on the “bell-curve”. Additionally, the delayed response of the climate system in and of itself further clouds the grasping of the immediate, necessary concerns to be recognized by the present generation.
Past global and national governmental “attempts” to successfully address the climate change issue have shared similar fates of failing miserably. The Clinton and Obama administrations were complete failures regarding this issue, as were the Kyoto Protocol and the Paris Accord. Nothing but talk, half-measures, corruption or irrational concepts at various levels… Ironically, the Montreal Protocol, with its successful goal of reducing Freon emissions to save atmospheric ozone, likely did more to slow the problem of global warming than all other attempts combined.
Many conservatives appear to be worried about a failing economy and filling their coffers while most liberals are more interested in grabbing money for themselves, their friends and their favorite failed social agendas. This climate change issue is however not a political issue and in the absence of radical change in the near future, will devastate all, regardless of political aspirations. There is hope and there is still time to fix the problems, however the clock is ticking.
Suicidal policies of past executive and legislative branches of the United States are largely influenced by the fossil fuel industry and their influential lobbyists. Perhaps a wiser approach would be to address the matter through the U.S. Supreme Court based on language of the 5th Amendment of the United States Constitution of clearly challenging if not outright denying future generations of their “Life, liberty and pursuit of happiness”.
The United States has always been and will always be the greatest political experiment to exist in the history of the world due to its foundation of documents which embrace the concepts of the celebration of the human spirit, freedom, and accountability.
The United States, with many of the greatest minds in the world, has the ability to lead the world in a gradual shift toward cleaner energy which will lead to a stronger, stable economy and more importantly, a far improved environment. Anyone who thinks the economy is more important than the atmosphere should try counting their money while holding their breath.
. Wendell Berry once stated: “Nature is party to all our deals and decisions, and she has more votes, a longer memory and a sterner sense of justice than that of man.”
Anyone who thinks otherwise is gravely mistaken. Anthropogenically induced climate change is not a political issue. It is not a debate. It is a scientific fact. It is all about quality of life and leaving the place better than how we found it. We truly borrow the future from our children. Sometimes choices require sacrifice of perceived luxuries. We all have choices and those choices define us as a species.
As Edmund Burke once suggested, “…evil prevails only if good men sit back and do nothing…”
Similarly, Gene Brewer stated in his book, “K-Pax”; a purported “alien” warns humans of their accountability by stating, “...the Universe will expand and collapse on itself...repeating this process forever...and every mistake you will live through again and again forever, so my advice to you is get it right this time around, because this time, is all you have.”
Perhaps the greatest legacy that this generation can pass on to the next is the acknowledgement that we “got it right with climate change.
In conclusion, the Earth will survive regardless of what humans do to it. Its survival however, might not include humans.
Tick-tock, tick-tock….
alonerock @69,
It may be worth further clarifying what is meant in the OP Item 3 by:-
The early 1880s saw a period of volcanic activity which affected the natural carbon cycle for some years. Ice core data shows CO2 levels rising annually at rates above 0.5ppm(v)/year for half a decade and this cannot be attributed to mankind as the emissions from all anthropogenic sources were less than that level. Thus the high CO2 increase in the 1880s cannot be attributed wholly to anthropogenic sources & the argument of Item 3 only applies post-1880s.