


 Arguments


Recent Comments
Prev 431 432 433 434 435 436 437 438 439 440 441 442 443 444 445 446 Next
Comments 21901 to 21950:
-
Stephen Leahy at 06:07 AM on 3 December 2016Justin Trudeau approves two big oil sands pipeline expansions
Andy, you might want to weigh in on this piece by U of Calgary economist in Macleans today
Policy, not pipelines, will determine if we meet our goals
"...climate concerns around pipeline approvals should be off the table."
-
One Planet Only Forever at 03:48 AM on 3 December 2016Justin Trudeau approves two big oil sands pipeline expansions
It is clear that there is a long history of incorrect business and political decisions being made, if the advancement of humanity to a lasting better future for all is the desired result of human endeavours. These decisions are the result of the development of unjustified perceptions of prosperity and opportunity, “winning any way that can be gotten away with”.
And current leaders in democracies require popular support that is difficult to obtain by justifiably shattering the developed delusions of prosperity and opportunity. Defending unjustifiable perceptions is easier to do. Clearly, it is possible to get support through an unjustifiable excuse like 'the importance of balancing economic interests of a portion of current day humanity with consequences faced by others who will not benefit, particularly future generation'.
It is common sense that it is unacceptable for anyone to benefit in a way that creates potential negative consequences for another person, including future people. The root cause of that lack of common sense in developed and developing societies needs to be addressed. It is almost certain to be an expected consequence of systems that allow a person to get away with actions that are clearly contrary to the advancement of humanity.
And it is clear that an issue like climate change cannot be adequately addressed be 'those who choose to care' while those who deliberately try to get more benefit and any possible competitive advantage by caring less can get away with their deliberately less responsible behaviour.
There is an escalating global war on climate change. It is part of the bigger escalating global war against pursuits that are understandably not going to sustainable advance global humanity to a lasting better future for all. And an aspect of any war is the propaganda war waged by those who actually understand how unacceptable their desires and interests are, but know how to temporarily Trump-up support. And like all activities that have to rely on propaganda (because they actually are understandably unacceptable), they can be tragically disastrously successful for as long as they are able to be gotten away with.
-
Andy Skuce at 03:35 AM on 3 December 2016Justin Trudeau approves two big oil sands pipeline expansions
Economist Jeff Rubin makes arguments, similar to mine, against the economic case for the TMX project in a radio interview this morning on CBC
Part of the transcript:
One of the main selling points of the pipeline has been that it will give Canadian bitumen access to Asian markets. But according to Rubin, the economic advantage of selling oil to Asia has been over-stated.
"The reality is that Asian markets pay less, not more, for the bitumen that Canada wants to sell than U.S. refineries," he told Crowe.
Rubin pointed to Mexican Maya Crude, saying the product, which is similar to oil sands crude, sells for $8 per barrel less in Asian markets than American markets.
At such low prices, the revenue that Canadian oil sands companies would gain from selling their oil to Asia wouldn't be worth the cost of extraction, he said.
Not only is it economically unwise now, he added, but it never will be.
"There's even less of a business case in the future than there is today," he said. "Not if Canada and 170 other countries come even remotely close to living up to their pledge to hold global climate change to one-and-a-half to two degrees."
The notion of building an oil pipeline while trying to reduce greenhouse gas emissions, Rubin said, is "akin to having your foot on the brakes and the accelerator at the same time."
-
Andy Skuce at 03:22 AM on 3 December 2016Justin Trudeau approves two big oil sands pipeline expansions
Nanuk* refers indirectly ("sucking on the prairie teat") to equalisation payments. There is a myth in Alberta that the province props up the rest of Canada by transferring hard-earned cash to undeserving parasite provinces like Quebec. In fact, Albertans pay more federal income tax because they are richer. Wealthy Canadians in other provinces pay federal tax at exactly the same rates. There was a recent CBC radio segment that dealt with this myth.
All resource royalty and leasing payments stay within the province. This is one reason why Alberta has the luxury of being the only province in the nation that does not have a provincial sales tax.
Also, under the Trudeau carbon tax plan, all carbon taxes raised in a province will be retained in that province.
Albertans, it needs to be said, often exhibit an unjustified sense of victimhood, despite being (still) the wealthiest province in Canada. This is not to minimize the real economic suffering being experienced there as a result of the sudden crash in global oil prices.
*Nanuk''s comment was removed by the SkS moderator after I had written this response.
-
JohnSeers at 03:01 AM on 3 December 2016Trump and the GOP may be trying to kneecap climate research
free discussion of reasonable men to discover whatever truth emerges that we can agree upon.
I suggest that a free discussion of reasonable men to discover the truth starts with a presumption that the reasonable men have some respect for each other. Starting with accusations that the other reasonable men are lying will not lead to a free and reasonable discussion.
-
Sub-Boreal at 02:39 AM on 3 December 2016Justin Trudeau approves two big oil sands pipeline expansions
"the boom times have created a hangover, and the remedy for that should be moderation rather than more binge drinking"
Exactly. So the kindest, most responsible thing for a neighbour to do is to take away the keys, lest the serial drunk driver try to get behind the wheel again. Sorry, Alberta!
-
One Planet Only Forever at 02:39 AM on 3 December 2016Justin Trudeau approves two big oil sands pipeline expansions
Here is an interesting article referring to a report that directly addresses what needs to be done "responsibly" with potential wealth from any new or existing fossil fuel exploitation in Canada.
CBC News item "Canada's stagnant, slipping national wealth overly reliant on oil and gas: study"
It also highlights the tragedy of the failure of Canada's previous leaderhip to meanigfully advance Canada to a better future that actually has a future.
-
One Planet Only Forever at 02:34 AM on 3 December 2016Justin Trudeau approves two big oil sands pipeline expansions
nanuk@10,
Wow. I am very familiar with the history of Transfer Payments in Canada. Do some actual research regarding the history of transfer payments. Then come back and apologize for making a totally unsubstantiated claim.
-
Tom Curtis at 01:31 AM on 3 December 2016Climate Change Cluedo: Anthropogenic CO2
jlfqam @64, where you write, "This figure shows the pCO2, that is the pressure of dissolved CO2 in the ocean", you then provide the URL for a series of monthly maps of surface water partial pressure of CO2 such as this one:

I have chosen this example as it shows the highest monthly pCO2 at Mauna Loa's longitude and latitude. Never-the-less, at that longitude and latitude, the colour shown is green, verging on light blue indicating a pCO2 between 350 and 375 ppmv. In 2005, the atmospheric CO2 concentration was 380 ppmv. The lower pCO2 at Mauna Loa therefore implies a net atmosphere to ocean flux at that location, consistent with the map you showed @61 and on which I commented @63.
In your post @61, you introduced the map as indicating the waters around Mauna Loa were particularly CO2 rich. It is possible you consider the maps of pCO2 (which show highest values in the tropics), as substantiating that claim. That would be a mistake. Specifically, pCO2 is a function not only of the total amount of CO2 dissolved, but also of the temperature of the water. In fact, looking at actual dissolved CO2, we find that those regions with the highest pCO2 also have the lowest total CO2 dissolved; while the highest quantities of total CO2 are to be found in the Antarctic Ocean:
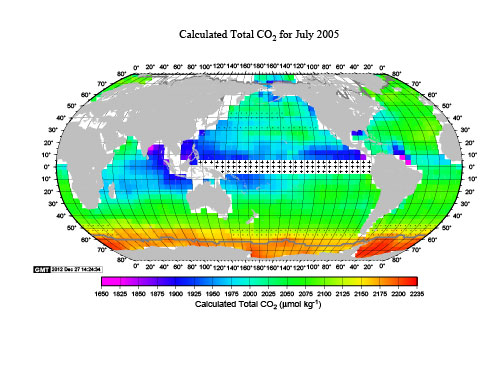
This paradoxical result is a consequence of the large temperature gradient in surface waters from poles to tropics.
In any event, not only are you trying to supplant the theories of climate scientists which they derived to explain the data they collected, and which you peruse; but you have shown a consistent pattern in misdescribing that data. It is hard enough to find a better theory for the data than that held by professional scientists, given their expertise, time, and the many person/years of cooperative research that has gone into any of those theories. Trying to do so without getting the data right is pointless.
Finally, yes there are seasonal variations in pCO2 and ocean/atmosphere CO2 flux at Mauna Loa, just as there is at Cape Grim (Tasmania) and in the waters surrounding the Antarctic (where the seasonal variations are exceptionally large). Yet seasonal variation in CO2 concentration is much reduced in the Southern Hemisphere, and virtually non-existent at the South Pole. If ocean/atmosphere flux was the cause of the measured seasonal variation at Mauna Loa, it would have the same effect at Cape Grim and the South Pole, resulting in an equally large seasonal variation at Cape Grim, and a larger one at the South Pole.
In contrast, the SH has far fewer deciduous plants than the NH, partly due to reduced land mass but also due to a greater preponderance of evergreens. The South Pole lacks deciduous plants entirely. That gives the true, primary cause of the seasonal variation on CO2 concentration - the seasonal cycle of deciduous plants.
-
michael sweet at 21:13 PM on 2 December 2016Climate Change Cluedo: Anthropogenic CO2
jlfqam,
You need to read why Mauna Loa (SkS link)was chosen by experienced scientists to measure CO2. The volcano is so high that it touches the bottom of the upper atmosphere. The CO2 is well mixed from around the world and is only slightly affected by any outgassing of the ocean. Your claim that ocean outgassing affects their measurements is incorrect. Read more, conclude less. You are reviewig very well explored material.
The entire ocean is a CO2 sink. Every year the ocean absorbs more CO2 from the atmosphere than it releases to the atmosphere. Your claim that the ocean is a source of CO2 to the atmosphere is incorrect. Perhaps you mean that the ocean flux affects the isotopic composition of the CO2 in the atmosphere but you need to be more clear what you are claiming. Read your sources more carefully.
You would be much better off if you asked questios about what you do not understand. Instead you make incorrect claims based on your own reasoning. This material has been very closely studied by others with much more experiece. You are more likely to reach an incorrect conclusion (like the two above) because you do not know as much as the experienced scientists than you are to find a mistake that they have made. If you ask questions you will be better received here than if you make incorrect claims based on your own reasoning. People are happy to help you understand the science.
Good luck.
-
ubrew12 at 21:06 PM on 2 December 2016Trump and the GOP may be trying to kneecap climate research
john warner@9 said: "Between July 2011 and April 2016... temperature went up 0.5 degrees" That 0.5 C increase is also indicated by the five surface temperature surveys graphed here:
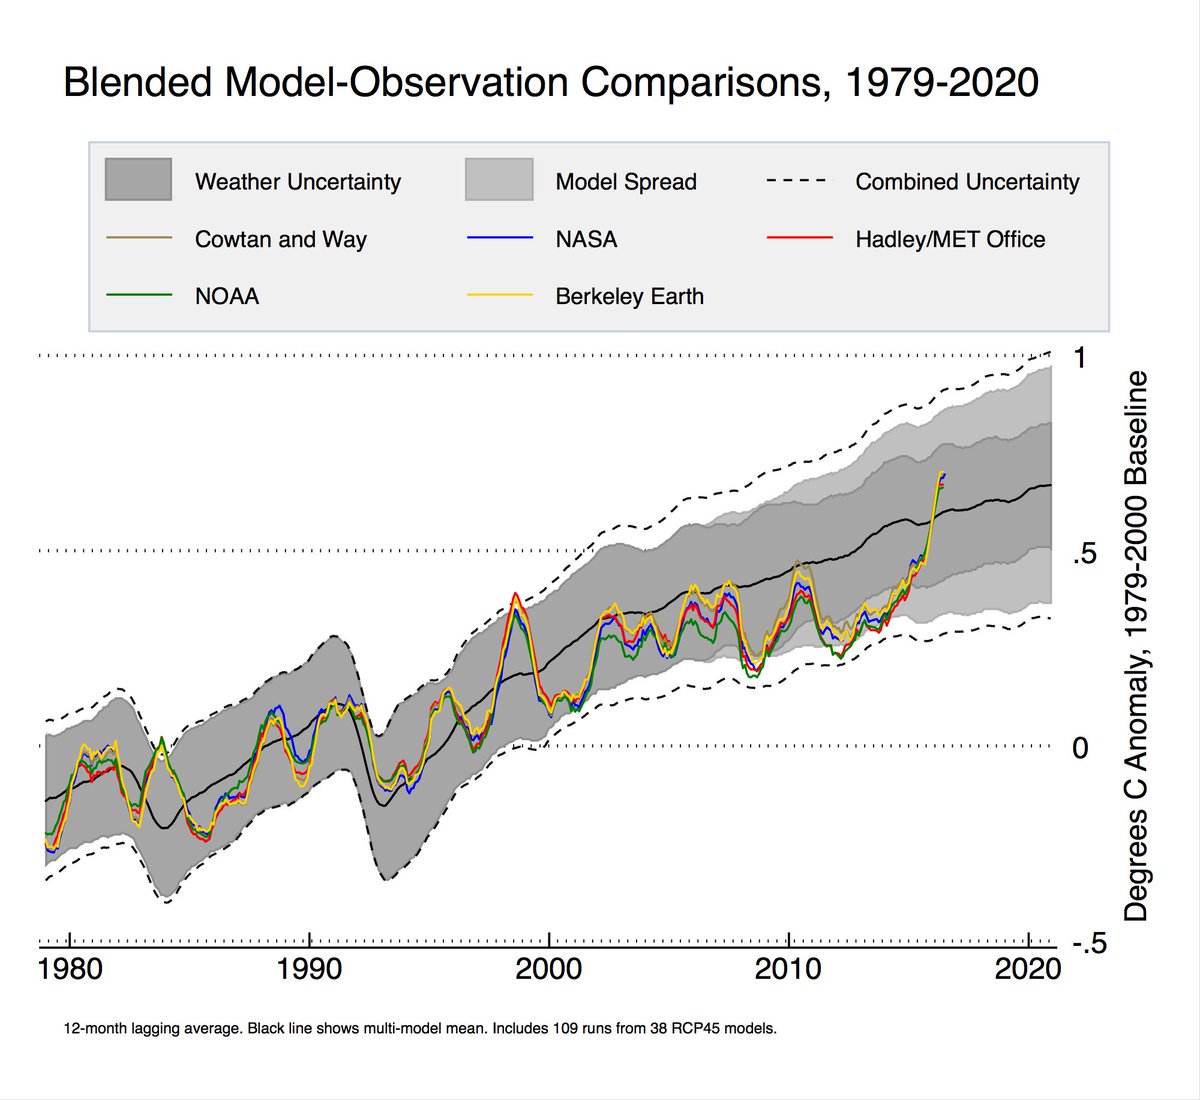
Also shown is the surface temperature from 1979 and the IPCC model predictions as well. The predictions do not match the record for the last 4.75 years, mostly because that's a ridiculously small interval of time upon which to make a climate comparison. But, more fundamentally, its because they can't. They are only models, approximations of nature, not the reality itself. This means we can't expect the models to 'beat' nature. Instead, their task is to beat you, and by 'you' I'm including the wealthiest economic sector in human history, entirely capable of producing its own climate models. But, more personally, you seem to have a well-thought-out analytical structure of how nature works to determine Earth's surface temperature, so why not extend that structure over a longer time period than the trivially inconsequential 4.75 years you've chosen? Work your math to include everything from 1979, and then see if it beats the standard models of climate science. Failing that, just pointing out that the standard models don't match the reality is moot. Those models aren't constructed to beat reality. They are constructed to beat you.
-
jlfqam at 20:31 PM on 2 December 2016Climate Change Cluedo: Anthropogenic CO2
Answer to HK 62
the color scale in the ocean surface CO2 fluxes is related to the flux of CO2 from the ocean to the atmosphere.
This figure shows the pCO2, that is the pressure of dissolved CO2 in the ocean
http://www.ldeo.columbia.edu/res/pi/CO2/carbondioxide/global_ph_maps/pco2_maps.html
This paper shows clearly the pacific ocean being the largest source of CO2 of the planet
Gruber et al
Oceanic sources, sinks, and transport of atmospheric CO2
http://ocean.mit.edu/~stephd/gruber_gbc_09.pdf

Figure 2. Comparison of the ocean inversion estimate of the contemporary sea-to-air CO2 flux with that based on the pCO2 climatology of Takahashi et al. [2008] for each of the 23 regions resolved by the ocean inversion. The zero-line crossing of each flux estimate indicates the region that this flux belongs to. Small gray numbers indicate the region number (see Table S1 for the region name). Positive fluxes indicate outgassing.
Rgarding Tom Curtis 63,
If you take a look at the seasonal variations of pCO2
http://www.ldeo.columbia.edu/res/pi/CO2/carbondioxide/pages/pco2_maps.html
you may see how the Hawaii Islands are bathed by waters with variable CO2 concentrations, which I would say fits the seasonality of the CO2 curve.
Thanks for continuing the discussion, it helps me think about new ways to reinforce the arguments in favour of a natural source for atmospheric CO2.
-
Glenn Tamblyn at 14:51 PM on 2 December 2016Dear Mr President-elect: a message from across the Pond
nijelJ
The key issue wrt the degree of permanancy is ice sheet melt. Greenland and West Antactica seem to have significantly melted and refrozen over the past glacial cycles. If the impact of anthropogenic warming doesn't exceed that magnitude then we would expect that the cycles would re-establish themselves. It may be that we defer or weaken the next expected cycle but that would be about the limit.
However, if we screw up completely and produce enough CO2 to yield sufficient warming to completely thaw all of Antarctica before CO2 levels drop, then it may take much longer for ice sheet nucleation to restart there. We well could flip into a hothouse climate for a time, maybe millions of years, and reverting back to an icehoiuse climate would be slow. Eventually that would probably happen - having a continent sitting over the south pole, isolated from everything else and surrounded by a huge ocean current is a strong driver towards an icehouse climate. -
john warner at 14:31 PM on 2 December 2016Trump and the GOP may be trying to kneecap climate research
The scientific explanation of carbon dioxide radiative forcing is easy to understand. With the analytic application of this understanding I can prove that the exaggerated claims of the global warming advocates fail the scrutiny of reason by the weight of their own silliness. The best way to access the IP addresses I am providing is to copy the address and paste it into the Browser IP address row and press enter. Then print the document for future reference. (snip) To return to the Moraleconomist Web Blog click x on the file folder you are viewing.
This is the IP address for the concentration of carbon dioxide in the atmosphere. [mod. - This is not an IP, it's a url.]
ftp://aftp.cmdl.noaa.gov/products/trends/co2/co2_annmean_mlo.txt
In 1979 NASA began using satellites to measure the earth’s average annual global air temperature. [mod. - Not exactly...] For the purpose of evaluating the validity of the global warming hypothesis [mod. - Needs a citation.] I prefer to use this period of the earth's air temperature record. The growth rate of carbon dioxide from 1979 to 2015 is 1.7892ppm per year. [mod. - Needs citation.]
This is the IP address [mod. - URL] for the Intergovernmental Panel on Climate Change, Third Assessment Report, Climate Change 2001: The Scientific Basis, Table of Contents.
http://www.grida.no/publications/other/ipcc_tar/?src=/climate/ipcc_tar/wg1/
Click on chapter 6 and scroll down to table 6.2. From the first equation C/Co, Co is 400.83 in 2015. Extrapolating the current growth rate [mod. - You can't do a straight linear projection.] to 2115 yields C equal to 579.75, (400.83+178.92= 579.75). (579.75/400.83=1.4463738) The natural log of this growth rate is 0.3690595. Multiplying the natural log times 5.35 yields 1.97wpsm. This is the most likely scientific prediction for a 100 year increase in carbon dioxide radiative forcing [mod. - No it's not. Pleaser refer to the Representative Concentration Pathways data for accurate figures.]. Before you thoughtlessly dismiss this go back to the TAR and go to table 6.1 and notice that between 1750 and 1998, 248 years, radiative forcing by carbon dioxide only increased 1.46wpsm. You can verify this with a scientific calculator by calculating the ratio of 365/278, taking the natural log and multiplying by 5.35. You can also calculate the 265 year increase in carbon dioxide radiative forcing, 1.96wpsm, by evaluating the ratio 400.83/278.
This is the IP address [mod. - URL] for NASA’s 2010 Earth Energy Budget based on the 10 year Climate and Earth Radiation System experiment.
http://science-edu.larc.nasa.gov/energy_budget/pdf/Energy_Budget_Litho_10year.pdf
The first thing to note is that there is no greenhouse gas radiative forcing quantity [mod. - Yes there is. Right there on the first page of your URL link.]. It is 17.9wpsm. This is a 33.4wpsm decrease from NASA’s 1998 Solar Energy Budget estimate of 51.3wpam. [mod. - citation needed.] The water vapor component was reduced 75%. [mod. - citation needed.] The well mixed greenhouse gases component was reduced 25%.[mod. - citation needed.] Therefore the most likely prediction is reduced to 1.48wpsm.
Notice also that the surface air temperature radiates 358.2wpsm. Google the Free Stefan-Boltzmann Law Calculator. Enter 1 for e and A. Enter 358.2 for P and x for T. Click calculate. T equals 281.93 degrees Kelvin. Adding 1.48wpsm to 358.2wpsm equals 359.68wpsm. Now enter 359.68 for P and x for T. T equals 282.22 degrees Kelvin. The difference, (282.22-281.93=0.29), is 0.29 degrees Kelvin per century. That is also 0.0029 degrees Kelvin per year.
This is the IP address [mod. - URL.] for Dr. Roy Spencer's Web Site. Click on Latest Global Temp. Anomalies.
http://www.drroyspencer.com/
This is the gold standard of temperature records [mod. - No, it's not.] for analytically evaluating the validity of the global warming hypothesis [mod. - Go chat with Roy, he'll tell you that you're wrong in your hypothesis here]. Notice the range of variability of the monthly data, 1.35 degrees Kelvin. Even more important for our purpose notice the 13 month running average temperature. Between July 2011 and April 2016 [mod. - why 13 months and not 12?.] this temperature went up 0.5 degrees Kelvin. Multiplying 4.75 years times 0.0029 degrees Kelvin per year yields 0.014 degrees Kelvin. The temperature went up 35 times more than the 4.75 years of carbon dioxide growth can explain [mod. - No one claims that CO2 and temperature are expected to operate in lockstep.]. Also notice every time the temperature goes down none of that variations is explained by carbon dioxide because [mod. - because, because, because....] annual average levels of carbon dioxide never go down [mod. - Technically wrong, but again, no one expects that CO2 and temperature will operate in lockstep.]. To credit carbon dioxide with average annual global air temperature changes is silly on its face compared to the other natural forces controlling earth’s air temperature. [mod. - Please quantify these other radiative forcings in relation to GHG forcing.]
From the IPCC Third Assessment Report [mod. - URL.] on Climate Change 2001 1st footnote from page 5 Summary for Policy Makers 1...
http://www.grida.no/publications/other/ipcc_tar/?src=/climate/ipcc_tar/wg1/fnspm.htm#1
"Climate change in IPCC usage refers to any change in climate over time, whether due to natural variability or as a result of human activity. This usage differs from that in the Framework Convention on Climate Change, where climate change refers to a change of climate that is attributed directly or indirectly to human activity that alters the composition of the global atmosphere and that is in addition to natural climate variability observed over comparable time periods.
The TAR could not prove that human activity [mod. - "proof" is a mathematical term and can't be applied to theories] caused global warming and they could not use the more ambiguous phrase, “climate change,” because of the definition adopted by the Framework Convention in 1992 [mod. - You've profoundly misinterpreted the passage you pasted above.]. In order to be semantically correct they had to redefine their definition of “climate change” to include naturally caused variability. Since the IPCC, the world’s leading scientific global warming authority[mod. - Weird claim.], secretly [mod. - Please read the terms of commenting on SkS again.] changed the definition in 2001 the global warming advocates believe they are not lying when they use, “climate change,” to refer to naturally caused climate change but the general public hears the lie that the changes are being caused by human activity. [mod. - Statements like these generally get commenters banned at SkS. You're on thin ice.]
The IP address [mod. - URL.] for the earth’s annual absolute temperature cycle [mod. - Really?.] is:
https://ghrc.nsstc.nasa.gov/amsutemps/amsutemps.pl
Scroll down until you see the colored years. Select near surface temperatures channel 4, degrees Kelvin, and year 2006. Notice that for January the temperature is 258 degrees Kelvin and for July the temperature is 261 degrees Kelvin. When the earth is closest to the sun the earth air is 3 degrees Kelvin colder.
The IP address [mod. - URL.] for Earth Orbit — Wikipedia is:
http://en.wikipedia.org/wiki/Earth%27s_orbit
Notice in the second paragraph under the heading Events in orbit the following sentence. “The changing Earth-Sun distance results in an increase of about 6.9% (footnote 8) in total solar energy reaching the Earth at perihelion relative to aphelion.” Next scroll down to the table labeled Orbital Characteristics. The earth’s aphelion is 94.51 million miles from the sun and the perihelion is 91.40 million miles from the sun. The ratio is 1.034. Because of the inverse square rule the solar radiation power per area at the perihelion is 1.069 times higher than at the aphelion. 1.034 squared equals 1.069. (0.069*340.4wpsm=23.5wpsm) The difference in solar radiative forcing between July and January is +23.5wpsm and the earth’s air is 3 degrees Kelvin colder.
The earth’s air mitigates a 23.5 watts per square meter annual solar radiative forcing cycle [mod. - citation needed.] but according to the global warming advocates theory, it can’t mitigate a 1.48 watts per square meter [mod. - citation needed.] increase in radiative forcing from a 100 year increase in carbon dioxide [mod. - citation needed.]. On January, fifth, the solar radiation on the earth is 353.75 watts per square meter. On July, fifth, the solar radiation is 330.25wpsm. When the sun’s radiation power per area is 23.5wpsm greater the earth’s air temperature is 3 degrees Kelvin colder. The global warming activists don’t care enough about science to realize that there are very powerful natural physical mechanisms that mitigate earth’s air temperature during its elliptical path around the sun [mod. - called the greenhouse effect.]. The annual increase in radiative forcing due to carbon dioxide growth is 1,588 times smaller [mod. - citation needed.] than the amplitude of the annual solar radiation power cycle, (23.5/0.0148=1,588) [mod. - citation needed.] Yet the global warming theory public policy advocates do not feel the necessity to explain why these same powerful natural physical mechanisms can’t also mitigate such a small determinant of the earth’s air temperature. These physical forces of nature are called: cloud albedo, radiating to space as a function of air temperature raised to the fourth power, reduction in conduction as the temperature difference between earth’s surface and surface air gets smaller and ocean sequestration of heat.
Another global warming lie we can expose here is that their public policy advocates say it takes 40 to 100 years for the earth’s air temperature to adjust to a change in radiative forcing due to carbon dioxide growth. But how long does it take to adjust to daily changes in solar radiative forcing. Notice that from NASA.s annual temperature cycle graph that as the earth begins to move away from the sun on January, Fifth, the earth’s air temperature begins to increase within two weeks. This means the earth’s air temperature regulating mechanisms are already increasing radiative forcing faster than the sun's radiative forcing is decreasing.
This is an invitation to a, Frank Knight type, free discussion of reasonable men to discover whatever truth emerges that we can agree upon.
[mod. - (sigh).]
Moderator Response:[RH] Skating verrry close to the edge of spam. Again, we're not here so you can advertise your climate denial blog. If we have to hit the spam button it will delete all your past and future posts. IF you are interested in a rational science based conversation on this issue you're going to have to (a) settle down, and (b) stick to the supportable science, and (c) don't spam this site ever again.
-
Magma at 14:23 PM on 2 December 2016Justin Trudeau approves two big oil sands pipeline expansions
I hope this is cynical or calculated political gamesmanship on the part of the Canadian government rather than overt hypocrisy.
In other words, it will issue permits for half or more of the pipeline projects applying for approval, let them be built with private capital if the companies behind them are willing to take the risk, and then let them sink or swim, unaided by any public funding or bail-outs, on the economics of the medium and long-term market for bitumen in a decarbonizing world economy. The effective outcome may be the same, but the expenditure of political capital less.
And while that is happening keep raising the carbon tax on all sources of GHGs, from individuals heating their homes to the largest oil sands producers.
-
ubrew12 at 13:34 PM on 2 December 2016Trump and the GOP may be trying to kneecap climate research
"Knight said the only truth he is interested in is what reasonable men can agree upon after a free discussion." If you are claiming a significant 'climate' conclusion from the last 4.75 years, you're not in the category of 'reasonable men'. 'Free' does not mean 'free' to dispense with fundamental definitions of the phenomena you are discussing. I'm not 'free' to fly off a cliff because I think gravity is a hoax; although I will admit after a 'free discussion' I might convince several 'reasonable men' to join me, by convincing them we'd arrived at 'the truth'.
-
Miguelito at 13:01 PM on 2 December 2016Justin Trudeau approves two big oil sands pipeline expansions
I'll also point out that the Ontario Liberal government is really nose diving in the polls, a lot of which is because of what's happening in electricity markets from government tinkering and micro-management. If there's a lesson in that, it might be that excessive regulation by governments could have the same high political hurdles that high carbon prices will. That may bode well for high carbon prices in the long term, especially if voters fear government mismanagement more than they worry about what a carbon tax will cost them.
-
chriskoz at 12:57 PM on 2 December 2016Dear Mr President-elect: a message from across the Pond
nigelj@19,
Given global warming will have a definite life span whether 3,000 or 100,000 years it cannot stop all future ice ages [...] . Maybe this was an off the wall thought. But clearly global warming cant stop all ice ages.
No, this is false. AGW has the potential to last longer than 100Ky and definitely stop several ice ages. Despite scaddenp request not to "dogpile", I have to respond to such false statements, that you're persitently making. Looks like my response @4 was inadequate so I elaborate in detail here.
Understand the processes of Carbon uptake from this post.
Visualise the timescale of these processes it by looking at a picture in this comment and/or by reading Archer 2007.
Note that the slug of 4000-5000Pg of C, as David points in table 4, results in the residual over 30% of that slug (coloured red in the picture) staying in atmosphere beyond 40Ky timeframe of that picture. The "reaction with igneous rocks" (also called "rock weathering") that would eventually remove that residual has 100Ky+ up to 500Ky timeframe. That's half a million years.Now, turn to Archer 2005 where David desrcibes the "trigger model" of the glaciation onsets, particularly Figure 3 therein. In the middle of it, you see the periodic signal of Milankovic forcing (i.e. summer insolation variations in the arctic) in -/+500Ky timeframe. According to the model, the onset of ice age happen when said signal falls below the horizontal green line (i.e. the Milankovic forcing is not strong enough to melt the accumulated snow resulting in ice accumulation around N Pole). You can eyeball that in the next 500Ky, the Earth could face potentially up to 10 ice ages (Milankovic signal crosses green horizontal line 10 times). The very first, in ca 60Ky is a weak one but the next one in ca 120Ky, and several next ones are a strong ones.
Now, addition of some CO2 to the atmosphere will last up to 500Ky and result in warming in the arctics, therefore the green line triggering the glatiation will be lowered (because in warmer arctic, colder Milankovic signal is required for the ice to start accumulating). Figure 3 shows two scenarios of 1000 & 5000Pg C slug added to the atmosphere. The corresponding two red lines lower the glaciation threshold of horizontal green line. You can eyeball that the red line corresponding to 1000Pg C slug (the amount we're committed to achieve and likely surpass, even with strong AGW mitigation action) just lowers the threashold to the boundary of first predicted weak glaciation. Which means, we may have already postponed the first impeding glaciation in ca 60Ky. The second red line corresponding to 5000Pg C slug, total FF reserves that we are able to add to the atmosphere, brings said threashold beyond the variability of Milankovic forcings on the figure. Which means, that such disturbance would deprive the Earth of any glacial cycles for the next 500Ky.
So, the above is the proof that your statement above is false. AGW can (and likely will with the policies boasted by the current president-elect implemented in the next 100-200y until the exhaustion of FF reserves) overturn the Pliocene glacial cycles. Homo sapiens are in charge of the Earth's climate, among other things, on such long geological timescale.I would like to add that David, like most mainstream climate scientists, prefers to err on the conservative site: e.g. his jumper & trigger models do not include feedbacks that cannot be quantified such as permafrost melting positive feedback). Given that more positive than negative such non-quatifiable feedbacks exists, the true influence of AGW on glacial cycles may be higher than stated in Archer 2005. But that's just my speculation.
Please post further questions about ice ages in the threads I linked above, I won't respond here anymore.
-
Miguelito at 12:35 PM on 2 December 2016Justin Trudeau approves two big oil sands pipeline expansions
Andy: I agree there probably needs to be a mix of carbon pricing and regulations. Carbon pricing doesn't work well to control fugitive emissions in gas production, so regulations will be needed if that share of Canada's emissions are to shrink over the long term (which we already have some commitments by Trudeau for). Renewable portfolio standards are good if done in a competetive and market savvy way.
But, I think we're going to learn that regulations and greater market intervention by governments to achieve lower emissions could end up being high hurdles to public acceptance too, because these do come with higher costs that will be evident elsewhere. All I can think of is Alberta's recent GHG commission and all the testimony that essentially said, if you do anything, don't do what Ontario did. I agree with that.
-
Andy Skuce at 12:06 PM on 2 December 2016Justin Trudeau approves two big oil sands pipeline expansions
Miguelito, Trevor Tombe has a good article on the inefficiency of blocking infrastructure to reduce emissions. I mostly agree with it, although he should have acknowledged more clearly that the carbon price required to produce the emissions cuts that the government has pledged would probably be in the range of $200/tonne CO2e. While this would be effective and efficient, I doubt that it would be politically feasible.
Mark Jaccard has a good piece on how, in practice, we will need both carbon pricing and regulations to get the mitigation job done.
-
john warner at 11:59 AM on 2 December 2016Trump and the GOP may be trying to kneecap climate research
Ubrew12 @ 4, nigelj @ 5, jdeutsch @ 6 thank you for the replies. Enthymeme is an argument where one of the premises is not stated. This is a debating trick to influence the audience. The audience has to supply the missing incorrect premise to get to the speakers false conclusion. This is emotionally gratifying to the audience because this reinforces their belief that they are functioning at the same high intellectual level as some publicly recognized authority. Now the audience has a stake in the lie because their own self esteem is involved. No conscientious CAGW critic disputes that the earth’s air temperature is rising during the last 4.75 years and is at near record high levels. But the incorrect unspoken premise is that science has proven man-made carbon dioxide is the cause. If you have statistically significant evidence for a rigorous scientific explanation that man-made carbon dioxide concentration has had a substantial effect on the earth’s average annual global air temperature show it to me now. If you can’t, I have posted a tutorial at my website. (snip) moraleconomist.wordpress.com/ I can use this argument to systematically expose the lies that the global warming advocates have used to deceive an unwary public. Frank Knight said the only truth he is interested in is what reasonable men can agree upon after a free discussion. If the moderator allows me to paste the tutorial into a comment I will be more than happy to do so.
Moderator Response:[PS] More sloganeering gone. "CAGW" is pure rhetoric with no reasonable definition. Tried reading the IPCC WG1? Use the "argument" button to find what you think is your strongest argument and comment on the thread. Offtopic gets deleted. The science position is that long term trend is mostly due to CO2, short term variations (sub decadal) are due to natural variability. If you dont agree that is the scientific consensus then show science report that say otherwise. No more strawmen.
The comments policy on site is designed to allow reasonable discussion of science without political sloganeering or rhetoric. If you are not prepared to abide this comments policy, then this is not the site for you. Read it and abide by it, or go elsewhere. It is not open for discussion.
[RH] Snipped URL. We're not your advertising firm, bubba.
-
Andy Skuce at 11:52 AM on 2 December 2016Justin Trudeau approves two big oil sands pipeline expansions
rdr95, when I argue that the country is split over these pipelines, I acknowledge that there is support as well as opposition. People who have a stake in the growth of the bitumen business, in AB/SK as well as the Atlantic provinces are certainly strongly in favour, mostly regardless of their political leanings. Perhaps I have a bias living on the BC coast, but the many people here opposed to the pipeline are very pissed off.
As I said, I know that the oil business is important to Canada and I disagree with the Leap Manifesto people who think we can quickly shut it down. However, I think that a sector that is responsible for less than 10% of GDP gets disproportionate attention.
I wish that the "conversation" could turn away from, on one hand, those who argue that a rapidly growing oil industry is essential to economic health and those who simplistically call for it to be shut down. We need to find a way to a sustainable business that gets better rather than ever bigger.
Currently, Alberta is producing more oil than ever in its history and projects under construction will add a few hundred thousand barrels more per day. An industry that is producing record volumes and that is still growing ought not to be in crisis. The problem is that the boom times have created a hangover, and the remedy for that should be moderation rather than more binge drinking.
I think it's far from certain that increased transportation will lead to more growth in today's market. To be sure, new pipeline transportation will save a few dollars per barrel over the rail transport that might have been necessary without the new infrastructure and that will help. Also, there will certainly be options for new markets, which should be worth something. Ultimately, though, the economics will be determined by world prices and nobody should expect the bitumen quality discount to vanish. Even Premier Notley said today that the new infrastructure will not lead to more production.
-
Miguelito at 10:50 AM on 2 December 2016Justin Trudeau approves two big oil sands pipeline expansions
It's worth noting that western Canadian bitumen is doubly discounted to Brent, not just because of its low quality, but because there's a lack of pipeline access to get that oil shipped outside western Canada, leaving rail as the only substitute, which is pretty pricy. This would only worsen without pipeline access to tidewater.
So, if climate-change was used as a reason to stop building pipelines to tidewater, western Canadian producers wouldn't only have to pay whatever carbon price is leveled on their upstream emissions ($30/ton, $50/ton, $100+/ton, or whatever it'll be), they'd have to pay an extra penalty based lack of pipeline capacity. This extra no-pipeline discount would be on the order of $10/barrel, which probably works out to more than $100/ton or more (rough guess, but it sounds like what I've heard).
In other words, Canadian oil and gas producers would get hit with a effective carbon price much higher than other Canadian sectors. From an economic perspective, it's not an efficient way to fix the climate. From an economic-fairness perspective, it's not really fair to pick on one sector while lowering the burden on other sectors. We all drive cars and should share the burden. Manufacturing and cement industries should share that burden too.
Another way of looking at it is that the Canadian oil and gas industry with its higher effective carbon price would subsidize other Canadian emitters like the transport sector, industry, cement, home heating, etc... We do need to transform the car and heavy truck sector so electric vehicles are widely adopted, but a lower effective carbon price on gasoline because of this subsidization will slow that. Same with reducing the emissions in cement, industry, home heating, and other things.
Also, government projections of CO2 emissions are useful, but often limited and neglect things like technological change and the impact of escalating carbon prices. Given that the oil and gas sector is already a large contributer to Canada's emissions, there are a lot of potential reductions if there's a price signal to encourage industry to do that. While, yes, escalating carbon prices would cause less production than without a price, there could also be significantly decreased emissions. Chances are, if companies can keep the costs of reducing emissions below whatever carbon tax there is, then they'll keep producing rather than not produce oil at all.
I guess I'm arguing that using climate-change as a reason to deny pipelines doesn't have much merit. Pipeline safety is a whole other issue and is much easier to make that argument on.
-
Tom Curtis at 08:31 AM on 2 December 2016Climate Change Cluedo: Anthropogenic CO2
jlfqam @61, in addition to HK's fine response, I will note that at the location of Mauna Loa, the CO2 air-sea flux is slightly negative, according to the map you show. Further, it is no closer to the strong positive flux in the tropical east pacific than it is to the strong negative flux at about 40 degrees north in the west pacific. That directly contradicts your claim that "upwelling may be the main source of CO2 at mloa".
-
jdeutsch at 07:03 AM on 2 December 2016Trump and the GOP may be trying to kneecap climate research
Climate deniers may be beyond convincing, but all the more reason to make sure we are consistent in our units (Gt of what? Carbon, CO2, or CO2 equivalents? Total energy accumulation in the earth system, or average air temperature, etc.). And lately all that talk of the North Pole being "hot".
-
jdeutsch at 06:56 AM on 2 December 2016Justin Trudeau approves two big oil sands pipeline expansions
Just as in the nuclear industry, there is difficulty accepting and responding to the reality of rising energy retention in the earth system. A big issue is loss of secure, well-paying jobs. There is immense need to build and repair infrastructure, insulate homes, shift agricultural practices, and gear up more health- and life-friendly alternatives to GHG-producing power generation and transportation. So many jobs to be created, but planning must include a living wage.
-
nigelj at 06:39 AM on 2 December 2016Trump and the GOP may be trying to kneecap climate research
John Warner @2 you claim your calculations discredit everything the IPCC claims then say you will provide the calculations"eventually". You appear to have let it slip that you havent actually done any calculations. Such is the obviously ridiculous component of your statements, I wonder if your post is satire/ sarcasm?
I'm also not aware of any temperatures decreasing since 1979. All data sets show an increase although some show a slightly slower rate since 1998. However this year is almost over and its clear it will set a huge temperature record.
-
ubrew12 at 06:30 AM on 2 December 2016Trump and the GOP may be trying to kneecap climate research
john warner@2 said: "If you don't have a 34 to 1 feedback to carbon dioxide forcing explanation what really caused this temperature increase [in the last 4.75 years]?" I think the switch from a La Nina dominated period to a massive El Nino can explain that. Nobody would use a 4.75 year period for a climate study, 1) too short to study Earth warming. The ocean alone delays sensible warming about 10-20 years, and 2) 4.75 years sounds suspiciously cherry-picked for a time interval.
-
nigelj at 06:12 AM on 2 December 2016Dear Mr President-elect: a message from across the Pond
Michael Sweet @18, fair comments. It was my understanding elevated temperatures would last about 3000 years, but I want to emphasise even that is a serious problem. Clearly it is also proceding at a rate that could be hard to adapt to. Last years temperatures would suggest the so called pause is over and that we are on track to lock in substantial sea level rise.
I have already read a long article on Ruddimans work that basically suggests farming and deforestation have caused some warming for the last 5,000 years or so and are an explanation for the unusually mild interglacial period we have experienced. It sounds distinctly plausible.
Given global warming will have a definite life span whether 3,000 or 100,000 years it cannot stop all future ice ages. I was just thinking long term that "if" global warming could permanently eradicate all ice ages it might be a good thing. Maybe this was an off the wall thought. But clearly global warming cant stop all ice ages. Ice ages are also slow phenomena so possible to adapt to one assumes.
I promise I will never mention ice ages again.
-
Climate Change Cluedo: Anthropogenic CO2
61 jlfqam:
"An alternative, and very simple explanation, could be the CO2 measured at Mauna Loa station emanates from the CO2-rich ocean waters of the tropical Pacific Ocean."Short answer: No!
If you are suggesting that much of the CO2 measured at Mauna Loa is a result of oceanic out gassing, then you are wrong. CO2 is measured all over the world, and once you get away from large local sources or sinks, the background concentrations and trends are almost identical.
This graph is based on direct measurements, with the seasonal variations removed. If you find it hard to distinguish the curves, it should be obvious that there isn’t anything special about the atmosphere around Mauna Loa. CO2 really is a well-mixed gas, far more so than gases like water vapour, ozone or even methane.
And BTW, your first map does not show ocean surface CO2 concentration, but the net CO2 exchange between the atmosphere and ocean. Red is oceanic uptake, while violet shows oceanic out gassing.
-
JWRebel at 03:55 AM on 2 December 2016Justin Trudeau approves two big oil sands pipeline expansions
"For the benefit of those who don't follow Canadian politics (and who could blame you for that)"
Canadians. Canadians are betting on the wrong horse in terms of future economic development and returns on investment. Sooner or later fossil fuel stores must be written down in value. Oil sands bitumen has a lot of disadvantages:
- Huge up front infrastructure required with risks to capital sinks
- High cost of production
- Huge amount of CO² emission as input requirement
- Inferior grade oil with higher CO² emissions.
Canadian oil can only be competive in a world short of oil. Once writing down of reserves starts (and CO² is taxed), Canadian oil will not be able to compete with cheaper sources (such as the Middle East, with huge stores of oil that is cheap to produce). Not to mention LNG from huge gas stores.
-
rdr95 at 03:08 AM on 2 December 2016Justin Trudeau approves two big oil sands pipeline expansions
That's a fair report - it has a certain amount of 'political' content, though, so can I make a 'political' comment?. I'm dubious about the claim that Trudeau will pay a large political price for trying to 'square the circle'. Support for pipelines is not restricted to Alberta, nor are the positive economic benefits of pipeline construction and oil sales restricted to Alberta. In Atlantic Canada where I live, for example, polls have shown support for pipelines and plenty of Atlantic Canadians work 'away' in Alberta. National polls are not that different, and, like it or not, there are clear national economic benefits from the oil industry. Given that the NDP currently is in power in Alberta, Trudeau might think he does have a shot at picking up a few seats there. And the BC govt is supportive of the pipelines - that suggests the 'bitterly divided country' you are referring to might be some other country. Insofar as the carbon tax is concerned, that tax is expected to increase over time is it not? That would further reduce emissions over those you enumerate in your story. You can argue that the approach here is imperfect, but if the carbon tax does get implemented we are moving in the right direction.
-
Dennis at 00:06 AM on 2 December 2016Trump and the GOP may be trying to kneecap climate research
People need to know who this Bob Walker is. It took a little digging, but it turns out he's the same former Republican Congressman Robert Walker who was closely aligned with Newt Gingrich during his time in Congress. He served on the House Science committee and in a recent opinion article described NASA climate science as “politically correct environmental monitoring."
source: LINK
Moderator Response:[RH] Shortened link.
-
jlfqam at 21:28 PM on 1 December 2016It's the sun
Message for Tom Curtis,
could you please help me testing if the correlation in the last figure of this posting is strong enough.
http://www.skepticalscience.com/news.php?p=2&t=61&&n=1534#119495
The data sources are
Data sources
http://www.esrl.noaa.gov/psd/data/correlation/nina3.data
(Note although the file name is ninA3.data it actually refers to ninO3)
http://www.esrl.noaa.gov/psd/data/climateindices/list/
list entry:
Nino 3* Eastern Tropical Pacific SST (5N-5S,150W-90W) From NOAA Climate Prediction Center (CPC): now uses the NOAA ERSST V4
Thanks
JLF
Moderator Response:[RH] Shortened link.
-
jlfqam at 21:19 PM on 1 December 2016Climate Change Cluedo: Anthropogenic CO2
Sorry,
I forgot pasting the map of ocean surface CO2 concentration,
Notice how close is the Mauna Loa station (Hawaii, filled black Circle) to the ocean CO2 rich waters
http://www.ldeo.columbia.edu/res/pi/CO2/

And just one more plot, please take a look at the "good" correlation (I would say, one of the best I could find from independent measurements of natural phenomena) between the Mauna Loa CO2 18O isotope composition, right end plot in 59-jlfqam posting above, and the NINO3 ocean surface temperature series.
Data sources
http://www.esrl.noaa.gov/psd/data/correlation/nina3.data

My question is, how is it possible the surface ocean temperature over the equatorial pacific affects the isotopic composition of the CO2(atm) produced by independent sources such as fossil fuel burning anywhere on the Planet?
An alternative, and very simple explanation, could be the CO2 measured at Mauna Loa station emanates from the CO2-rich ocean waters of the tropical Pacific Ocean.
Thanks for your attention
Best
JLF
Moderator Response:[PS] Perhaps see the article here . (and dont forget isotopic signature of atmospheric CO2 is consistent with FF not ocean). What is your "simple" explanation for where the FF we have burnt is gone if magically not increasing CO2 in atmosphere? You can use the "Arguments" menu item above to find responses to common myths. You seem to be engaged in a effort to find anything except CO2 (which is by the simplest explanation). Perhaps time to ask yourself where this bias comes from?
[RH] Shortened link.
-
michael sweet at 21:03 PM on 1 December 2016Dear Mr President-elect: a message from across the Pond
Ngelj,
It is my understanding that the changes in heat on the Earth from current emissions will last about 100,000 years. That is not the rest of the life of the Earth, but no-one currently alive will be around to see sea level what it is today. How long is forever for you? Already the climate will not be the same as it was in 2000 until long after everyone now living has passed on. If sea level rises 25 meters (in 1000 years) it will cover all the great deltas of the world which include a very large percentage of arable land. Several billion people would be displaced with no-where to go. It was pointed out above how much disruption is caused by one million refugees, imagine 300 million from 2 meters of sea level rise. That is in the range of what is expected by 2100.
Look at the linked videos from James Hansen above. He goes into more detail.
William Ruddiman suggests that humans have been affecting climate for 7,000 years. His view has gained a lot of support in the last few years, but has not yet reached consensus. According to this hypothesis we would currently be in the start of the next ice age without human intervention.
-
john warner at 20:51 PM on 1 December 2016Trump and the GOP may be trying to kneecap climate research
If you calculalte the theoretical scientific magnitude of carbon dioxide's effect on the earth's average annual global air temperature and divide this number into the lower troposphere temperature increase for the last 4.75 years the ratio is 35 to 1. If you can't do the calculations yourself I will provide them eventually. In addition you should inform you readers what the first footnote for policy makers says from the IPCC TAR Climate Change 2001: The Scientific Basis. These two facts alone discredit the whole CAGW fraud scheme. If you don't have a 34 to 1 feedback to carbon dioxide forcing explanation what really caused this temperature increase? In addition, since 1979 carbon dioxide never decreased, what explains all of the decreases in the earth's air temperature? This is why the IPCC scientists insisted on the disclaimer that human activity caused climate change and redefined climate change to include natural variability.
Moderator Response:[PS] Accusation of fraud and sloganneering. You must substantiate claims. If you want to show science wrong, you first quote the actual claim with source (because you are simply promoting a straw man at the moment), then you provide data/publications to support your alterrnative view. Note in particular: climate is defined as 30 year average since long before IPCC because of large internal variability. No climate scientist from FAR onward has ever claimed that temperatures would keep rising year after year. Even a cursory reading of report would explain why. Leave the rhetoric at the door.
Please note that posting comments here at SkS is a privilege, not a right. This privilege can be rescinded if the posting individual treats adherence to the Comments Policy as optional, rather than the mandatory condition of participating in this online forum.
Please take the time to review the policy and ensure future comments are in full compliance with it. Thanks for your understanding and compliance in this matter.
-
jlfqam at 19:17 PM on 1 December 2016It's the sun
Thanks for the comments. I temporarily stop posting in order to carefully read the comments.
Best
-
denisaf at 14:59 PM on 1 December 2016Trump or NASA – who's really politicising climate science?
This is an interesting discussion of the perception by a range of communities of the likelihood of climate change. But it is misleading as it focusses on the variation of perception rather than on the fact that the overwhelming view, especially amongst those knowledgeable of the scientific backing, is that rapid, irreversible climate change (and ocean acidification and warming) is under way. So the article adds to the confusion rather than fostering the mitgration and amelioration that the precautionary principle ordains
-
John Mason at 14:20 PM on 1 December 2016Dear Mr President-elect: a message from across the Pond
Nigelj - this argument is sometimes put forward, although it has a major flaw. It's not the end-state but the transition from here to there that is so deadly. Sea-level rise, as pointed out above, destroys the economic infrastructure of all countries to a large or massive degree. That can't be good. However, more serious again is the shifting of Earth's climate belts with respect to their current position. That variably but inevitably takes out a) habitability and b) agriculture. We have seen the desperate situation of folk fleeing the conflict in Syria - the boats, the mass-drownings, the political instability in parts of Europe. Maybe a million people are trying to find sanctuary. Let the climate run away with itself and you're looking at hundreds of millions.
Another assumption I've seen put forward is that defrosted permafrost country in the far north will compensate for such issues - however, the timeframe is too long. Soils do not develop overnight - they are the product of thousands of years of biochemistry. Soil is a lot more complex than most people realise, yet we take it for granted in the same way we expect to find tins of beans on the supermarket shelf.
It was a lot easier for our ancient predecessors to move south or north as the Quaternary ice-sheets waxed and waned. Small bands of hunter-gatherers, with no governments or nations and borders, had a fraction of our modern problems to address. I could live off the land - and from the sea - if I needed to. I do so to an extent already. But the fraction, in the West, that have such capabilities - or even the ability to learn them and put them into practice - is tiny.
-
nigelj at 13:57 PM on 1 December 2016Trump and the GOP may be trying to kneecap climate research
Perhaps Bob Walker doesn't realise NASA is involved in not just space research and climate change, but all sorts of remote sensing of earths systems. The things all just sit comfortably and work efficiently together.
Please don't try to fix what isn't broken Mr Walker. The history of humanity is littered with mistakes like that.
-
nigelj at 13:37 PM on 1 December 2016Dear Mr President-elect: a message from across the Pond
ubrew @12, yes thanks I get that. Global warming will cause serious sea level rise. We have had maps published in my country on the extent and it's not good.
I was really just asking if we continute to burn fossil fuels at current rates will this cause permanent global warming for billions of years, or temporary global waming of a few thousand years (or how much would we expect?) or dont we know?
So far I have received mostly conflicting and blunt or hostile answers.
-
denisaf at 12:36 PM on 1 December 2016Global weirding with Katharine Hayhoe: Episode 5
There is appreciable uncertainty about the temoral and regional impact of climate change, as noted here. But the impact of climate change is only one of the predicaments that society will have to try to deal with in coming decades. Declining availability of irreplaceable natural resources, including oil, over and aging population, the impact of ocean acification, pollution and warming on the marine ecosystem, the irrevocable aging of the vast infrastructure (from cities down to ipads) that provides society with the services they have become dependent on, together with the degradation of the environment and the consequences of flora and fauna species extinctions will provide a challenging mix of predicaments.
-
ubrew12 at 10:12 AM on 1 December 2016Dear Mr President-elect: a message from across the Pond
nigelj@13 said: "So I just struggle to see that we would be in a permanent warm... system for all eternity." No. We would be in a temporary warm system just long enough to erase most of our coastal cities, which conduct the vast majority of our trade. Jim Hansen on this (15' video).
-
johnthepainter at 08:57 AM on 1 December 2016Dear Mr President-elect: a message from across the Pond
We now can add a female scientist to the history of climate science as the first to prove that CO2 effectively traps the sun's heat. In 1856, she concluded on the basis of her experiment that, “An atmosphere of that gas would give to our earth a high temperature; and if as some suppose, at one period of its history the air had mixed with it a larger proportion than at present, an increased temperature [from its own action as well as from increased weight] must have necessarily resulted.” http://www.climatechangenews.com/2016/09/02/the-woman-who-identified-the-greenhouse-effect-years-before-tyndall/
Unfortunately, European scientists were unaware of her report, and she did not carry her research on the subject further.
-
nigelj at 06:27 AM on 1 December 2016Dear Mr President-elect: a message from across the Pond
John Mason @10, thanks but I am still mystified on a couple of points as follows.
First I want to point out I see global warming as a problem for humanity, and am on record on this website saying this.
However being devils advocate, isn't a warm / hot climate phase long term actually preferable to a warm / cold climate with periodic ice sheets over most of the northern hemisphere? Ice ages are a real killer and hard to adapt to. On that basis some might say global warming is a good thing.
And I dont see how earth would enter a permanent warm / hot phase. Wouldnt the excess atmospheric CO2 gradually be reabsorbed into the oceans? And given we have had a warm / hot climate in the distant past something caused it to change to a warm / cold system. So I just struggle to see that we would be in a permanent warm / hot system for all eternity.
-
jimspy at 05:01 AM on 1 December 2016Conservatives elected Trump; now they own climate change
@Red Baron: For the record, I'm a card-carrying liberal...and I wholeheartedly agree with your approach. Make it potentially wallet-fattening to support mitigation, and the stogie-chompers will come a-runnin. (No offense).
-
ubrew12 at 00:14 AM on 1 December 2016Dear Mr President-elect: a message from across the Pond
What will Trump really bring to the Climate Change discussion? Consider that yesterday Dr Jeff Masters, founder of The Weather Underground website, appealled for donations for the Climate Science Legal Defense Fund (CSLDF), to defend U.S. Climate Scientists from a tidal wave of McCarthyist witchhunts in Congress designed to chill their research. To quote: "[Lamar] Smith’s House Science committee issued more subpoenas in his first three years than the committee had for its entire 54-year history; many of these subpoenas demanded the records and communications of [climate] scientists who published papers that Smith disapproved of."
-
ubrew12 at 00:03 AM on 1 December 2016Dear Mr President-elect: a message from across the Pond
Trump says he has 'an open mind' about Climate Change. In the same interview, he says CC is 'a very complex subject', says on one hand 'they have science' and on the other hand 'there are those horrible [Climategate] emails... where they got caught, you know', says 'we've had storms always', and says 'the hottest day ever was in 1890-something'. Today we learn KellyAnne Conway, his campaign manager and likely press secretary, will travel to the Alberta tar sands in January, to highlight its importance to America. So, in this case, we're talking about an 'open mind' filled with Koch-propaganda.
-
jlfqam at 22:24 PM on 30 November 2016It's the sun
Hi,
I hope this time I got the accepted width for the posted figures.
Here I present the isotope composition of a speleothem from Mexico covering the last 2.4ka, but only plotted over the SSN measurments time.
data is available from NOAA
ftp://ftp.ncdc.noaa.gov/pub/data/paleo/speleothem/northamerica/mexico/juxtlahuaca2012.txt
in excel format
ftp://ftp.ncdc.noaa.gov/pub/data/paleo/speleothem/northamerica/mexico/juxtlahuaca2012.xls
Thanks to Tom Curtis 1221-2 for the demonstration, but unfortunately for me I am not good with numbers, I prefer visual correlations as this one,

Notice how the rainfall over the Cave Basin has abruptly decreased after Pinatubo eruption. In fact what I have found is that volcanoes accelerate the cooling caused by decrease in solar irradiance. But volcanoes have another interesting effect on climate.
Regarding MA Rodger 1220, I have a good idea on what is the cause of the lack of correlation after 1990, but since nobody I have already explained how can the global temperatures can increase while the solar irradiation is decrasing does accept the mechanism, I will not tell it here unless I found someone really interested in testing that in a model and willing to publish the results.
Please take a look at this one that shows how Pinatubo eruption of 1991 caused a change in trend on the CH4(atm). I am also trying to find what caused the the turn point after 2000 AD. Or the disturbance of 2 consecutive years after Pinatubo or one year after 2000, on the MLOA CO2 curve, or why methane recovered the production rate after 2006?

The legend

It's also interesting to note that atmospheric CO2 response is very rapid to the volcanic eruption derived cooling of ocean surfaces.
Rampino et al Nature 1992, suggested Toba (Indonesia) eruption around 74kaBP, which lasted 6years (ashes reached E Africa) caused the deepening and extension of an ongoing glaciation. The corresponding full deglaciation was delayed by 40ka, so now here we are as we are.

Here you may find how CO2 responded in a single plot. Notice how minor euptions had barely no effects at the Ka range. However Pinatubo, had only an effect of a couple of years on the CO2.

Frankly, I would not rely on the greenhouse effect of CO2
This picture from a recent paper data shows how WDC, an ice core from an Antarctic region on the Pacific Coast started to warm up a few ka before the CO2(atm) started to rise in concentration
http://www.nature.com/nature/journal/v514/n7524/full/nature13799.html

It's not a matter or refuting or rebuting, it's a matter finding new clues.
The decrease in precipitation over Mexico, it's scary, as it means less rain over many other regions of the Planet.
Take a look at the Great Lakes, I leave you the correlation with SSN.
http://www.tides.gc.ca/C&A/network_means-eng.html

It's time someone starts a global call on how to solve a global cooling situation, which is much worse than a global warming, just because there will be less precipitation, which means less food for the less developed regions.
Thanks again for your patience.
JLF
PS: If you are interested on a discussion on the sources of CO2(atm), I have posted some plots.
http://www.skepticalscience.com/news.php?p=2&t=60&&n=1534#119462
take care
Moderator Response:[DB] Off-topic, sloganeering and Gish Gallop snipped. At the bare minimum, you need to acknowledge where others have adequately disproved your position on various points. If you wish to break this into smaller chunks with a demonstrated understanding of the physics involved plus citations to credible literature that supports your position, then do so.
Until then, please refrain from the above or your posting rights in this venue may be rescinded. Please refresh yourself with this site's Comments Policy and ensure that all subsequent comments comport with it.
Prev 431 432 433 434 435 436 437 438 439 440 441 442 443 444 445 446 Next


