


 Arguments


Recent Comments
Prev 463 464 465 466 467 468 469 470 471 472 473 474 475 476 477 478 Next
Comments 23501 to 23550:
-
John Hartz at 11:30 AM on 11 November 2016Conservatives elected Trump; now they own climate change
@Synapsid #5: Recommended reading:
Five things that explain Donald Trump’s stunning presidential election victory by Anthony J. Gaughan, The Conversation US, Nov 9, 2016
-
nigelj at 10:15 AM on 11 November 2016Conservatives elected Trump; now they own climate change
Red Baron @ 6, nice thoughts, but hasn't Obama pushed clean energy partly on the basis it creates opportunities for profit? And it does. And Hilary Clinton has done the same.
Nothing seems to get through to the Republicans on climate change.
-
Greg13940 at 10:12 AM on 11 November 2016Conservatives elected Trump; now they own climate change
I understand the backlash against the defeatism of the article, but I understand the defeatism as well. Generally speaking, cap-and-trade and carbon taxes are the conservative, market-friendly solutions. Republicans, or at least the current Republican leadership, have rejected those as non-starters, and have made clear the only acceptable solution to them is denying the existence of a problem. It doesn't leave a lot of room to work with.
-
nigelj at 10:10 AM on 11 November 2016Conservatives elected Trump; now they own climate change
Scaddenp @4, I agree and would add this. I struggle to see how bringing back tariffs will help anyone. Tariffs will increase the price of consumer goods, and thus inflation and interest rates, and thus mortgage rates. Everyone suffers.
The Economist.com have calculated that 60% of manufacturing job losses in America are due to automation and robotics and only 30% to immigration and "free trade".
Even if you put back tariffs I think the only jobs they will create will be low pay production line jobs, and bringing back more automation to America from Asia obviously doesnt really create jobs.
I feel sorry for blue collar workers because they are the victim of things beyond their control, however the real answer is government help for people hurt and left behind, but this is on nobodies agenda!
I dont think it helps to politicise who voted for Trump, and their ideological leanings, but its fair to say they now bear considerable responsibility for the negative effects of climate change. I have been prepared to support government initiatives and their costs, and I feel let down.
-
scaddenp at 10:03 AM on 11 November 2016Conservatives elected Trump; now they own climate change
RB - you have agree that a problem exists before you can solve it. Good luck with that in Congress. Pigovian taxes, cap and trade, emission trading all give profits those who mitigate, all designed to appeal to right-wing, - and going nowhere. Basically all of those depend on government intervention. I wrote an article here, indeed looking for solutions that were acceptable to the political right, especially liberatarians. Reading the comments is depressing, -it would appear that if a cheap technological fix were possible, then that is okay but otherwise it is la la la - but mostly you cant get the right wing to even consider solutions because denial is so much easier. Ie if there isnt a solution to a problem that conforms to my ideology, then problem doesnt exist (as opposed to "my ideology needs to change"). I cant my head around the mindset at. I dont even get why people buy into an ideology in the first place.
-
Dcrickett at 09:24 AM on 11 November 2016Conservatives elected Trump; now they own climate change
What I find specially disturbing is that a knowledgeable, capable and respectable voice on the Climate issue writes such a misguided opinion piece. Blaming it all on conservatives is doubly inexcusable. First, because it is factually wrong (which the author weakly acknowledges). Also, because there are approaches of a more conservative orientation that need to be considered.
I continue to be an admirer of John Abraham's writing and climate work.
(My own political orientation, like my sexual orientation, is blatantly obvious to all who know me and utterly irrelevant to Skeptical Science.)
I was intellectually prepared for a Trump victory in my country’s presidential election. But emotionally I was utterly unprepared. On the day after the day after, I am still in a state of shock and unable to wrap my consciousness around it.
-
RedBaron at 09:15 AM on 11 November 2016Conservatives elected Trump; now they own climate change
John,
Conservatives own climate change.
Conservatives own the consequences of climate change.
They own the increased droughts, more severe storms, sea level rise, and floods.
They own the heat waves, the loss of habitat and the shifting climate zones.
They own the climate refugees, the resulting political strive, and climate conflicts.
They own it all.
OK, that's what happened and for at least 2 years they will also own congress. This is potentially the greatest opportunity ever actually, or the biggest disaster ever, depending on how it is handled. The mitigation plans must be carefully crafted in such a way as to be acceptable to a conservative business slanting government, maybe as a business stimulous package? Trump pledged to cut taxes, so maybe huge tax cuts for businesses with a negative carbon footprint? This way he does what he said and at the same time addresses mitigation. Maybe as I have stated many times, change the subsidies on the buffer stock schemes surrounding "king corn" along with a tax credit for verifiable increases in soil carbon on agricultural soils? That could actually lower taxes. Or approach it from Trumps promise to rebuild infrastructure? Infra structure could look very different according to what it is designed to support. It's possible some ways to address that, could also at the same time address CO2.
I did not vote for Trump by any means. Be sure. Not with his crazy conspiracy theory blaming AGW on the Chinese. But I have been a conservative my whole life, and I am certain that it is possible to come up with a conservative acceptable mitigation plan. So instead of crying from shock, and proclaiming the end of the world, why not sharpen your pencils and find a new approach to mitigation that is acceptable to conservatives? Since they own the presidency and both houses, any plan you come up with that really is acceptable to conservatives is bound to pass right through. We could potentially flip the script on climate change in a matter of months!
I'll even give you a hint, if the plan includes big profits for those mitigating AGW, it will be at least considered.
-
Synapsid at 09:12 AM on 11 November 2016Conservatives elected Trump; now they own climate change
I would not agree that consevatives elected Trump. What elected Trump was the repudiation of Clinton plus the conservative vote.
-
gws at 08:57 AM on 11 November 2016So fracking reduces carbon emissions, right?
ah, sorry. meant cogeneration. IIRC, cogen is the most efficient use of the fuel's primary energy content, especially when relatively small plants are used to provide district heating (neighborhood scale).
-
scaddenp at 08:53 AM on 11 November 2016Conservatives elected Trump; now they own climate change
But what the blue collar have been sold is that their jobs are going and wages stagnant because immigrants are taking their jobs and companies are shipping jobs offshore. Trump is gonna fix that (right). While that is partially true, it ignores much bigger job loss to automation and fact that people prefer cheap to homegrown. Trump isnt going to fix that.
Essentially same issues with getting people to understand climate issues - much more appealing voices telling stories to further their political aims.
-
calyptorhynchus at 08:49 AM on 11 November 2016Conservatives elected Trump; now they own climate change
I agree, but we also need to remember that many centerist or left of centre governments around the world did little on climate change during the period 2000 - now. They said many fine things about the need for action, but then did too little, or put it in the too-hard basket.
-
nigelj at 07:16 AM on 11 November 2016Conservatives elected Trump; now they own climate change
Some of us in countries on the other side of the world are in deep shock and despair as well. Trumps policies on climate change, social issues, and economics are all a giant leap backwards for America, but they have vast and negative global implications as well.
I want to pick up on one point in the article. I'm reasonably well off financially, so also insulated from the negatives. I feel sorry for blue collar people in America as they have been sucked in by economic "snake oil" and the policy platorm proposed can only hurt them badly financially. They will also be the least able to cope with climate change as money gives people flexibility.
But what is done is done. You cannot save people from their own stupidity. It's up to the rest of the world to see the way emotion and poor reasoning has clouded Americas political thinking, and not be influenced by the outcome. We have to go our own way and push ahead with climate change mitigation, and hope Trump only lasts 4 years.
-
scaddenp at 06:04 AM on 11 November 2016So fracking reduces carbon emissions, right?
gws - "power NG plants are rarely planned as combined cycle,"
I would stunned if there were gas power stations being built that werent CC. It doesnt make economic sense. Can you provide examples please?
-
Jonbo69 at 04:09 AM on 11 November 2016Conservatives elected Trump; now they own climate change
I'm doing my best here in the UK by contacting groups such as Greenpeace UK with a plan of activism. My simple idea and hope is, the moment Trump as president makes it clear he is not going to adhere to the pledges made in the Paris agreement, there should be a campaign aimed at the UK public asking them to boycott all goods and services manufactures or delivered by American owned companies.
Trump ran with the campaign slogan 'America first' so I'm suggesting there could be a campaign called 'Planet first'. If we could start it off here in the UK maybe it could spread to other countries. I know there will be many scientists, liberal politicians and environmental activists in the US protesting against the Trump plan. They are going to be subjected to demonization and misinformation campaigns and it won't be enough - Trump & the GOP will do nothing unless the majority of American public opinion is against them. International governments may make protestations about US policy, but ultimately will do nothing, that's why there has to be a campaign organised by the people for the people.
Here in the UK, as in many countries, we are not doing enough to meet our climate targets, but the path America has chosen takes things to a whole new level. In the UK in the 1980's we still had racism; that didn't mean that we didn't have the right to campaign against apartheid in South Africa - a campaign that was ultimately successful.
Everyday Americans who don't realise the scale of problem may only be drawn to it if they witness palpable large scale anger and resentment in other countries. If US corporations such as Coca Cola, Starbucks and McDonalds are taking a major hit in their international operations then they'll be on Trumps back.
Anyway, those are just my thoughts for the moment.
-
Rob Honeycutt at 01:24 AM on 11 November 2016President Trump would Make America Deplorable Again
Sorry, ABloke, but there is nothing about a Trump presidency that changes basic physics.
-
gws at 01:23 AM on 11 November 2016So fracking reduces carbon emissions, right?
jpbpawley
yes, a point not addressed in the article. The current issue is, however, AFAIK, that power NG plants are rarely planned as combined cycle, and also too large, undermining the flexibility and targeted role as renewables backup you are highlighting. So that harks back to the last sentence in the post ...
-
ABloke at 01:20 AM on 11 November 2016President Trump would Make America Deplorable Again
Well I must confess to being slighly bemused Mr or Ms Moderator, having read you comments policy. 'On Topic' well everyone seemed to be discussing the effects of Donald Trumps presidency on 'Climate change'. My comment were appropriate to the thread, not repetitive, No sloganeering, unless you count 'collapse like a deck of cards'?!!! No link, no picture, no accusations of deception, no attacks. Political rants? No, bearing in mind the whole thread is tiled the 'President Trump would make America deplorable again' (a bit political and ranty, no?). All caps? No. Profanity/inflammatory? No. Dogpiling? No. Multiple identities? Not even mild schizophrenia. Copy/pasting? No. Spamming? No. Valid email address? Yes. So dear moderator exactly where have I transgressed 'policy'? I was merely expressing an opinion, as are others in this thread, as to the future of AGW now Trump is in the white house.
Moderator Response:[RH] Moderation complaint.
[PS] Sloganeering is making statements/assertions, without providing evidence to back them up. Shooting the messenger will not make a problem disappear.
-
gws at 01:18 AM on 11 November 2016So fracking reduces carbon emissions, right?
william, I think this article may be helpful.
-
John Hartz at 00:43 AM on 11 November 2016President Trump would Make America Deplorable Again
ABloke #12: You would do well to read:
Physics Doesn’t Really Care Who Was Elected by Brian Kahn, Climate Central, Nov 9, 2016
-
John Hartz at 00:33 AM on 11 November 2016President Trump would Make America Deplorable Again
JonBo 69 @#1: You asked:
Are we likely to see climate scientists face prosecution?
If you mean criminal prosecution, I sincerely doubt that would occur in the US.
For a more detail explanation of what might actually happen, see:
What Trump's Surprise Victory Could Mean for Science by Ryan F. Mandelbaum, Scientific American, Nov 9, 2016
-
RedBaron at 00:26 AM on 11 November 2016President Trump would Make America Deplorable Again
@Haze,
What now as the questions about what Trump will do are clearly no longer "rendered moot"?
Sharpen your pencils and come up with a mitigation plan that is acceptable to conservatives. I highly recommend you don't use the word "tax" anywhere in the plan, but something similar could be in there somewhere.
-
John Hartz at 00:25 AM on 11 November 2016President Trump would Make America Deplorable Again
Haze @10: My new crystal ball has not yet arrived. My old one disintegrated as the election results came in..
Seriously, I am as concerned as you are about what a Trump Presidency means for international and national efforts to mitigate manmade climate change. In fact, I have been posting links to numerous articles about this topic on the SkS Facebook page over the past few days and will continue to do so.
Here are the ones I have posted to date:
US election: Climate scientists react to Donald Trump’s victory by Carbon Brief Staff, Carbon Brief, Nov 9, 2016
Trump Victory in Presidential Race Stuns Climate World by Zahra Hirji, InsideClimate News, Nov 9, 2016
The Paris Agreement will survive President Trump by Thomas Hale, Climate Home, Nov 9, 2016
What it would really mean if Trump pulls the U.S. out of the Paris climate agreement by Chris Mooney, Energy & Environment, Washington Post, Nov 8, 2016What Trump's Surprise Victory Could Mean for Science by Ryan F. Mandelbaum, Scientific American, Nov 9, 2016
-
ABloke at 22:46 PM on 10 November 2016President Trump would Make America Deplorable Again
The whole 'Climate Change' thing is over. Trump will pull the funding, funding to the UN, withdraw from the Paris agreement. The UK have already closed down the Dept of Energy and Climate Change, Malcolm Roberts is precipitating change in the Australian Government. The whole thing will collapse like a house of cards.
Moderator Response:[JH] Sloganeering is prohibited by the SkS Comments Policy.
Please note that posting comments here at SkS is a privilege, not a right. This privilege can be rescinded if the posting individual treats adherence to the Comments Policy as optional, rather than the mandatory condition of participating in this online forum.
Please take the time to review the policy and ensure future comments are in full compliance with it. Thanks for your understanding and compliance in this matter.
-
chriskoz at 17:46 PM on 10 November 2016President Trump would Make America Deplorable Again
Haze@10,
Do you really want to drill on the consequences of that sad morning of a new 9/11 (as 9th of Nov is written by the rest of the world)? What's the point?
Just re-read the OP replacing "would" with "will". As I mentioned somewhere else, climate mitigation will be the very first casualty under the new administration because there is not opposition in Congress to the raving of the irresponssible man, particularly in thsat area of policies. This is especially sad. The only good news is that Paris agreement signed by Obama administration thankfuly went into force Nov 4 for the next 4 years, so the irresponsible administration will not be able to withdraw US from it, at least not immediately...
-
Haze at 11:58 AM on 10 November 2016President Trump would Make America Deplorable Again
John Hartz@2 "I personally believe that your questions/concerns about what Trump will do as President on the climate change front will be rendered moot after the votes are tallied tomorrow and Hillary Clinton is declared to be the "President-elect."
What now as the questions about what Trump will do are clearly no longer "rendered moot"?
-
jbpawley at 11:42 AM on 10 November 2016So fracking reduces carbon emissions, right?
I hate to say anything to support fracked NG but:
It is really not just a matter of whether or not it replaces coal. NG can replace coal in 2 major ways: 1) as the fuel to a boiler that could otherwise use coal or 2) being burned in a gas turbine hooked to a generator with the hot exhaust then used to boil water into steam fed to a steam turbine/generator. The latter is called a combined-cycle setup and it is a very different animal. In particular, it can be turned off and on rapidly (Minutes?) and after warmup, it can provide a combined thermal efficiency close to 60% versus about 40% for a steam only plant.
This makes combined cycle a very useful method of filling gaps in renewables caused by changes in the weather.
So, the discussion of utility of NG isn't just about methane leaks and the fact that burning it produces relatively more heat for a given amount of CO2.
-
Rocketscientist at 09:31 AM on 10 November 2016No longer taken seriously, we're seeing the last gasp of climate denial groups
Your ‘congregation’ could do with a little more of a balanced assessment of the points raised by Ridely (and many others).
I have a degree in Physics and helped developed the first satellite communication satellite systems used around the world i.e. so while not an expert I can understand the science involved. I'm also a greenie, left winger by nature and was initially at least very concerned by Al Gore’s ‘famous’ work. After spending a LOT of time and effort looking into the issues involved I came away impressed by much of the science of global warming - particular the ice age reconstructions - but extremely disappointed by much of the work on 'climate modelling'. The CO2 modelling fails the most basic of tests in that it HAS CONTINUNALLY FAILED to predict current trends or more importantly replicate the past paleoclimatic cycle data. To match the short term recent temperature data the models have continually required after the fact hindsight tweaking to match the data or the data has required tweaking.
So, when 'sceptics' point this out give them a little credit and admit the science is far from perfect. I've quoted your own assessment of Christies report below to point out the problem. You should acknowledge and THANK him instead you denigrate!
'So, this recent paper did a few things. First, they took the contrarian argument that the mid-troposphere temperatures have been rising at only 1/3 the rate predicted by models. They found that Christy’s team neglected the contamination of the cooling in the upper stratosphere. When they applied this correction, they found that Christy’s claim was incorrect. Differences between modelled and observed warming rates were much smaller, and had known explanations'.
The abstract is also provided below
‘We use updated and improved satellite retrievals of the temperature of the mid- to upper troposphere (TMT) to address key questions about the size and significance of TMT trends, agreement with model-derived TMT values, and whether models and satellite data show similar vertical profiles of warming. A recent study claimed that TMT trends over 1979 and 2015 are three times larger in climate models than in satellite data, but did not correct for the contribution TMT trends receive from stratospheric cooling. Here we show that the average ratio of modeled and observed TMT trends is sensitive to both satellite data uncertainties and to model-data differences in stratospheric cooling. When the impact of lower stratospheric cooling on TMT is accounted for, and when the most recent versions of satellite datasets are used, the previously claimed ratio of three between simulated and observed near-global TMT trends is reduced to ≈ 1.7. Next, we assess the validity of the statement that satellite data show no significant tropospheric warming over the last 18 years. This claim is not supported by our analysis: in five out of six corrected satellite TMT records, significant global-scale tropospheric warming has occurred within the last 18 years. Finally, we address long-standing concerns regarding discrepancies in modeled and observed vertical profiles of warming in the tropical atmosphere. We show that amplification of tropical warming between the lower and mid- to upper troposphere is now in close agreement in the average of 37 climate models and in one updated satellite record.’
To get the models to match it was also necessary to mess with the basic satellite data itself as well - probably for good reason but none the less more after the fact hindsight fiddling - yet AGAIN. Now all this is fine - that's how science and the models advance but at least acknowledge the problem and the fact that the science is NOT OVER. (PS the factor of 3 error was reduced to 1.7 – WELL DONE)
The other major problem is that none of these, what I call CO2 forcing factor driven models have manage to replicate the past ice age cycle data. Especially if the CO2 levels allowed to 'free run' rather than being artificially forced to match the ice core data response. The problem with the later should be obvious – does CO2 drive temperature or does temperature drive CO2 – obviously, a combination of both but the two factors need to be isolated.
This is basic 101 stuff - you have to validate major model assumptions before they have any credibility. The ONLY work that managed to do this as far as I've been able to determine was a paper (peer reviewed) published in 2013 in Nature. ' Insolation-driven 100,000-year glacial cycles and hysteresis of ice-sheet volume.' This to me was a major piece of work which has largely been ignored. This group finally managed to replicate the past ice age cycle behaviour largely using insolation factors coupled with isostatic rebound of the continental plates. I'm sure you'll be aware of this work and its potential importance. Basically, they appear to have demonstrated that you do NOT need to assign an artificially high forcing factor to CO2 to replicate the cycles. As they noted from their sensitivity runs 'Carbon dioxide is involved, but is not determinative, in the evolution of the 100,000-year glacial cycles.'
FINALLY, you avoided the other incredibly important issue totally - which is to question whether a warmer, wetter planet with higher CO2 levels is a BAD outcome. The greening of the planet since the end of the last ice age has directly enabled us to develop agriculture and societies to the point that we now all enjoy. Past geological data also readily indicates the planet has been much warmer in the past and lush as a result. Plants have done an incredible job in terraforming the atmosphere reducing CO2 to TRACE levels. I noticed that there was no response to Ridley’s and other’s arguments in this respect.
These are important issues and as Ridley rightly points out the concern is that attention and resources are being diverted from much more important ecological and social concerns.
PS I wonder whether this post will survive your ‘peer’ review?Moderator Response:[RH] Multiple breeches of commenting policies. Please try again after reading policies.
-
Bruce Frykman at 08:50 AM on 10 November 2016Paris climate agreement enters into force: international experts respond
Its a good bet with James Inhofe Having president Trumps ear, funding for climate science will be reduced from a torrent to a trickle, maybe even zero as budgets compete for dwindling tax revenues.
In that this is a world crisis can we expect most of our climate experts to continue to work in this vital area of survival strictly as volunteers who will fund their own travels and expenses.
Perhaps they could show us how little money it takes and how small a carbon footprint climate science can make.
Would climate scientists object if their thousands of meetings were by teleconference?
-
william5331 at 05:11 AM on 10 November 2016So fracking reduces carbon emissions, right?
What is a little disquieting about all of this is that the world output of Carbon dioxide has apparently been decreasing over roughly the same period. Yet despite this, if you look at the Mana Loa site for Carbon dioxide increases from Jan2015 to Jan2016, Feb2015 to Feb 2016 etc, the jump is far greater than for similar intervals in the past years. What is happening here. Is it simply an effect of the severe El Nino we have just gone through or is something more sinister happening. Have one or more Carbon dioxide sinks started to shut down. We will have a better indication as the 2016-2017 figures start to come out next year as the effect of the El Nino fades away. If this is indeed a persistant trend, and continues at the same rate as it is doing now, it halves the time we have to reach whatever maximum allowable Carbon dioxide ceiling you subscribe to.
-
Haze at 18:18 PM on 9 November 2016President Trump would Make America Deplorable Again
Well it's all over bar the shocked horror of those so confidently predicting a Clinton victory, much like the shocked horror of those predicting the UK would remain in the EU. In reality though I suspect the rhetoric of Trump the campaigner may not be his language now he is President. This unexpected result does show however, that the world's journalists are not very good at predicting the future. Will this result have an impact on the world's actions on climate change especially as the Republicans now control the Senate and Congress `as well as the Presidency? Personally I think having so much control is not a good thing
-
Jonbo69 at 18:10 PM on 9 November 2016President Trump would Make America Deplorable Again
OK, so the American people have spoken; fair enough. It looks as if the US is going to go rogue on climate. Our politicians will do nothing so, for those of us living outside of the US, at some point in the near future there needs to be a call from the people to the people to boycott goods produced by American companies, incuding the ones we all love - coke, pepsi, perhaps even going as far as not watching movies made in Hollywood, and to not use American owned businesses - Starbucks, McDonalds etc. Simple as!
-
nigelj at 08:09 AM on 9 November 2016President Trump would Make America Deplorable Again
William @6, you are right when Obama was first elected he sought consensus, and probably alienated some of his supporters. But if he had taken a more combative approach at day one, he would have alienated the Republicans in congress and got even less legislation passed. So he was caught between a rock and a hard place.
Obama also doesn't decide between Hillary or Bernie Saunders.This is decided by the super delegates who clearly favour Hilary. I doubt if Obamas opinion would have persuaded them otherwise, so its probably unfair to blame Obama too much.
Remember The Democrats are not a left leaning party like Labour in Britain. The Democrats are liberals and would be seen as almost mildly centre right in many countries. They are mildly left leaning on some issues. So I assume Sanders would be a lot for them to support.
This is just my understanding of the situation. I'm personaly sympathetic to Sanders and he did have a good level of public support.
-
william5331 at 05:41 AM on 9 November 2016President Trump would Make America Deplorable Again
Sadly this whole debacle can be sheeted home to Obama. At the beginning of his presidency, because of a lack of experience he pursued the very laudable goal of getting the GOP on side to run America for the benefit of her citizens. He had a stary eyed view of his ability to create consenses as any reasonable man would. Arguably, as a result he lost his majority in the first mid terms because of his innefectiveness. He couldn't even shut down Guantanamo. Now, in his final major act he behaved as a politician instead of as a statesman and supported Hillary instead of Bernie. If Bernie had been the Dem candidate, Trump would have been history already and Bernie would have been on the way to the largest majority that any president has ever had. The only appeal that Trump has is his shared distain of the beltway with the American people. That is the total base of his success. Now Hillary will be president and that is not a pretty prospect. Whichever candidate wins today, America will have dodged a bullet.
-
RedBaron at 03:05 AM on 9 November 2016Watch: Before the Flood
Tom,
If my soils tests out at 8% soc and I lose it so that later my soil tests out at 4% SOC as I gradually destroy the topsoil or lose it to erosion. That is still arable gound. In fact with heavy fertilizer use I can probably still farm for a whileIn arable ground statistics you won't see it lost, only degraded. Further if I plow a former grassland or forest, (which starts the degradation process) it will actually show in statistics as arable ground increasing. This explains the apparent paradox you are seeing. Nor do I claim that the carbon vanished completely, some entered the atmosphering pool, some entered the ocean pool, some is redeposited only floodplains like the famous Nile Delta, etc... but sediments in rivers lakes and the ocean are a very large part.
However, the soil that has degraded down to as much as 1-2% SOC due to agriculture (basically farming on subsoil) can be managed in a different way to start increasing SOC. Is it too much of a stretch for you to believe that it might be capable of reaching that % SOC found historically? After all the subsoil is roughly the same parent material in roughly the same locations. It reached those higher SOC levels at one time. Why would you think it impossible to do it again with an agricultural system using biomimicry?
-
Jonbo69 at 02:33 AM on 9 November 2016President Trump would Make America Deplorable Again
@villabolo,
Hi,
I didn't mean European governments, they won't do jack; I meant a call from the people to the people to boycott American businesses and goods produced by American firms, and for climate activists to have ongoing campaigns outside American owned businesses. Anyway, we'll see what tomorrow brings.
-
Tom Curtis at 01:42 AM on 9 November 2016Watch: Before the Flood
RedBaron @25 and 27, by talking about the potential size of the Soil Organic Carbon (SOC) reservoir as a sink for carbon emissions, you have changed the topic. Your evidence for the existence of a reservoir of that size is the purported loss of SOC to that extent due to agricultural practises, but in that event SOC loss represents have cumulative emissions approximately 4 times those from all other anthropogenic emissions. Worse, it means you need to find an additional 1550 GtC in known surface carbon reservoirs, ie, more than twice the size of the Dissiolved Organic Carbon reserervoir. Apparently over (at least) 800 GtC, having left the soils has "softly and silently vanished away" without going into any reserservoir.
Asked to defend these figures you point to a peer reviewed article which only claims a 50% topsoil loss for Iowa, not globally. That article further asserts that "per capita food supply has been reduced over that last 10 years [ie, 1985-1994] and continues to fall", whereas modern data shows the opposite:
It also claims that arable land is being lost at a rapid rate, but if so it is being gained at an even faster rate, for total arable land increased at a rate of 2 million hectares per annum from 1961-2013, while total agricultural land has increased at a rate of 10.6 million hectares per annum (FAO data). Further, the article does not directly discuss loss of SOC, and while its claimed 75 billion tonnes per annum of top soil lost from agricultural lands represents a problem, that loss is mostly from the 10.5% of the land area under cultivation. Most of that top soil would be deposited as silt in flood plains, or over land (if wind blown) so it does not represent the global loss of soil, still less that of SOC. In short, the paper does not appear to be reliable, and is certainly not directed to the point of discussion; on top of which you overstate its claims.
-
RedBaron at 18:41 PM on 8 November 2016Watch: Before the Flood
Read up on it.
The numbers are 20 years old. It's even worse now.
-
Glenn Tamblyn at 17:20 PM on 8 November 2016Watch: Before the Flood
RedBaron
Your numbers don't seem to add up. If carbon lost from the soils is 10 times what we see in the atmosphere, given that known human emissions from fossil fuels are only about 1/2 of what we can see in the atmosphere, that means that 10.5 times the visible extra in the atmosphere has gone somewhere else. 150 years isn't long enough for significant transport to the deep ocean so where could all that carbon be?- Upper levels of the ocean?
- Surface vegetation?
- Where?
No way the ocean could have taken up that much carbon and not be noticed. Gas exchange balance with the atmosphere would mean that concentrations in the atmosphere should be significantly higher. Or if it was organic carbon in the oceans, it would be visible. The graph Tom highlighted doesn't suggest anything like that level. And there is a balance between dissolved organic carbon in the ocean and marine biota. More DOC would produce huge blooms that metabolise a lot of it, converting it to inorganic carbon, entering the carbonate system and being detectable.
Your argument seems to violate mass balance.
What I would question, though I don't know the details, is the claim of 50% loss of topsoil in the last 150 years. Is that 50% of area or volume? Loss of top soil is certainly an issue - an oft quoted figure is 1/3rd of farmland is losing soil faster than it is created. But 50% already lost? Sounds too high. That would suggest that a reasonable proportion of the planet is back to bedrock.
Do you have a source for that number? -
RedBaron at 15:42 PM on 8 November 2016Watch: Before the Flood
Scaddenp,
Right then basically the same yields per acre but with no inputs and better soil carbon sequestration.
Tom,
Sorry but not sure what you are missing, Of the ~2,700 Gt of C stored in soils worldwide, ~1550 GtC is organic, which is approximately double the current atmospheric C which is ~780 GtC.
This in not counting soil carbon held in peat and wetlands (150 GtC), inorganic C in soils (950GtC) and in plant litter at the soil surface (50 GtC).
~1550 GtC is the current levels but 1/2 of the topsoil on the planet has been lost in the last 150 years. So the size of the sink would be at least ~1550 GtC or greater before we need to worry about saturation, with all the carbon in the atmosphere only ~780 GtC and all we need to remove? What? Maybe 150-200 GtC. So the sink is approximately 10 times larger than it needs to be.
So at this point the main factor is rate of flux out of the atmosphere and into the soil. i am guessing maybe 40 years or so. However, emissions would thwart that time frame, melting cathrates could too. And I am no expert but I am told the ocean which is now a sink would turn into an emissions source should we start drawing down atmospheric carbon.
So maybe we will need all of that spare sink capacity?
Ultimately my statement was not false. We are missing 10 times more carbon from our soils as there is extra in the atmosphere.
-
scaddenp at 13:07 PM on 8 November 2016Watch: Before the Flood
Redbaron, our average was 2.9 cow/ha in 2013 with 1060 kg/ha of milk solids, much of it on podzols. I dont see anything in your resources that doesnt sound like common practise here - except that now they get stocking increase with inputs as well. Irrigators are taking dairy into areas with 18-25" rain pa.
-
Tom Curtis at 12:02 PM on 8 November 2016Watch: Before the Flood
RedBaron @19, I did not assume you meant that all SOC lost had gone into the atmosphere, but it must have gone somewhere. The industrial emissions in CO2 concentratin equivalent since 1870 accounts for 100% of atmospheric increase plus 100% of ocean increase plus 9% of the land sink. Given that, to a first approximation, Land Use Change emmissions, only part of which is SOC, cannot exceed 93% of the Land Sink (or 63% of the atmospheric increase). Given that much of the LUC comes from deforestation, the SOC loss accounts for appreciably less than that.
Strictly speaking, the Land Sink, Ocean DIC, and atmospheric CO2 are not the only sinks; and nor are anthropogenic sources the only sources. Allowing for these extra factors as per AR5 Fig 6.1, we can allow for 30 GtC being sequestered as ocean floor sediments and/or buried organic matter (ie, the raw material of future fossil fuels), but that is nowhere sufficient to make up the shortfall. Nor is the 3 GtC of Marine Biota (which is more likely to have declined than increased). The only other reservoir available is dissolved organic carbon, which the IPCC has as unchanged since the preindustrial, but which you require to have increased by 50% over that period for your claim to be true. Well, either that, or allow violations of conservation of mass.
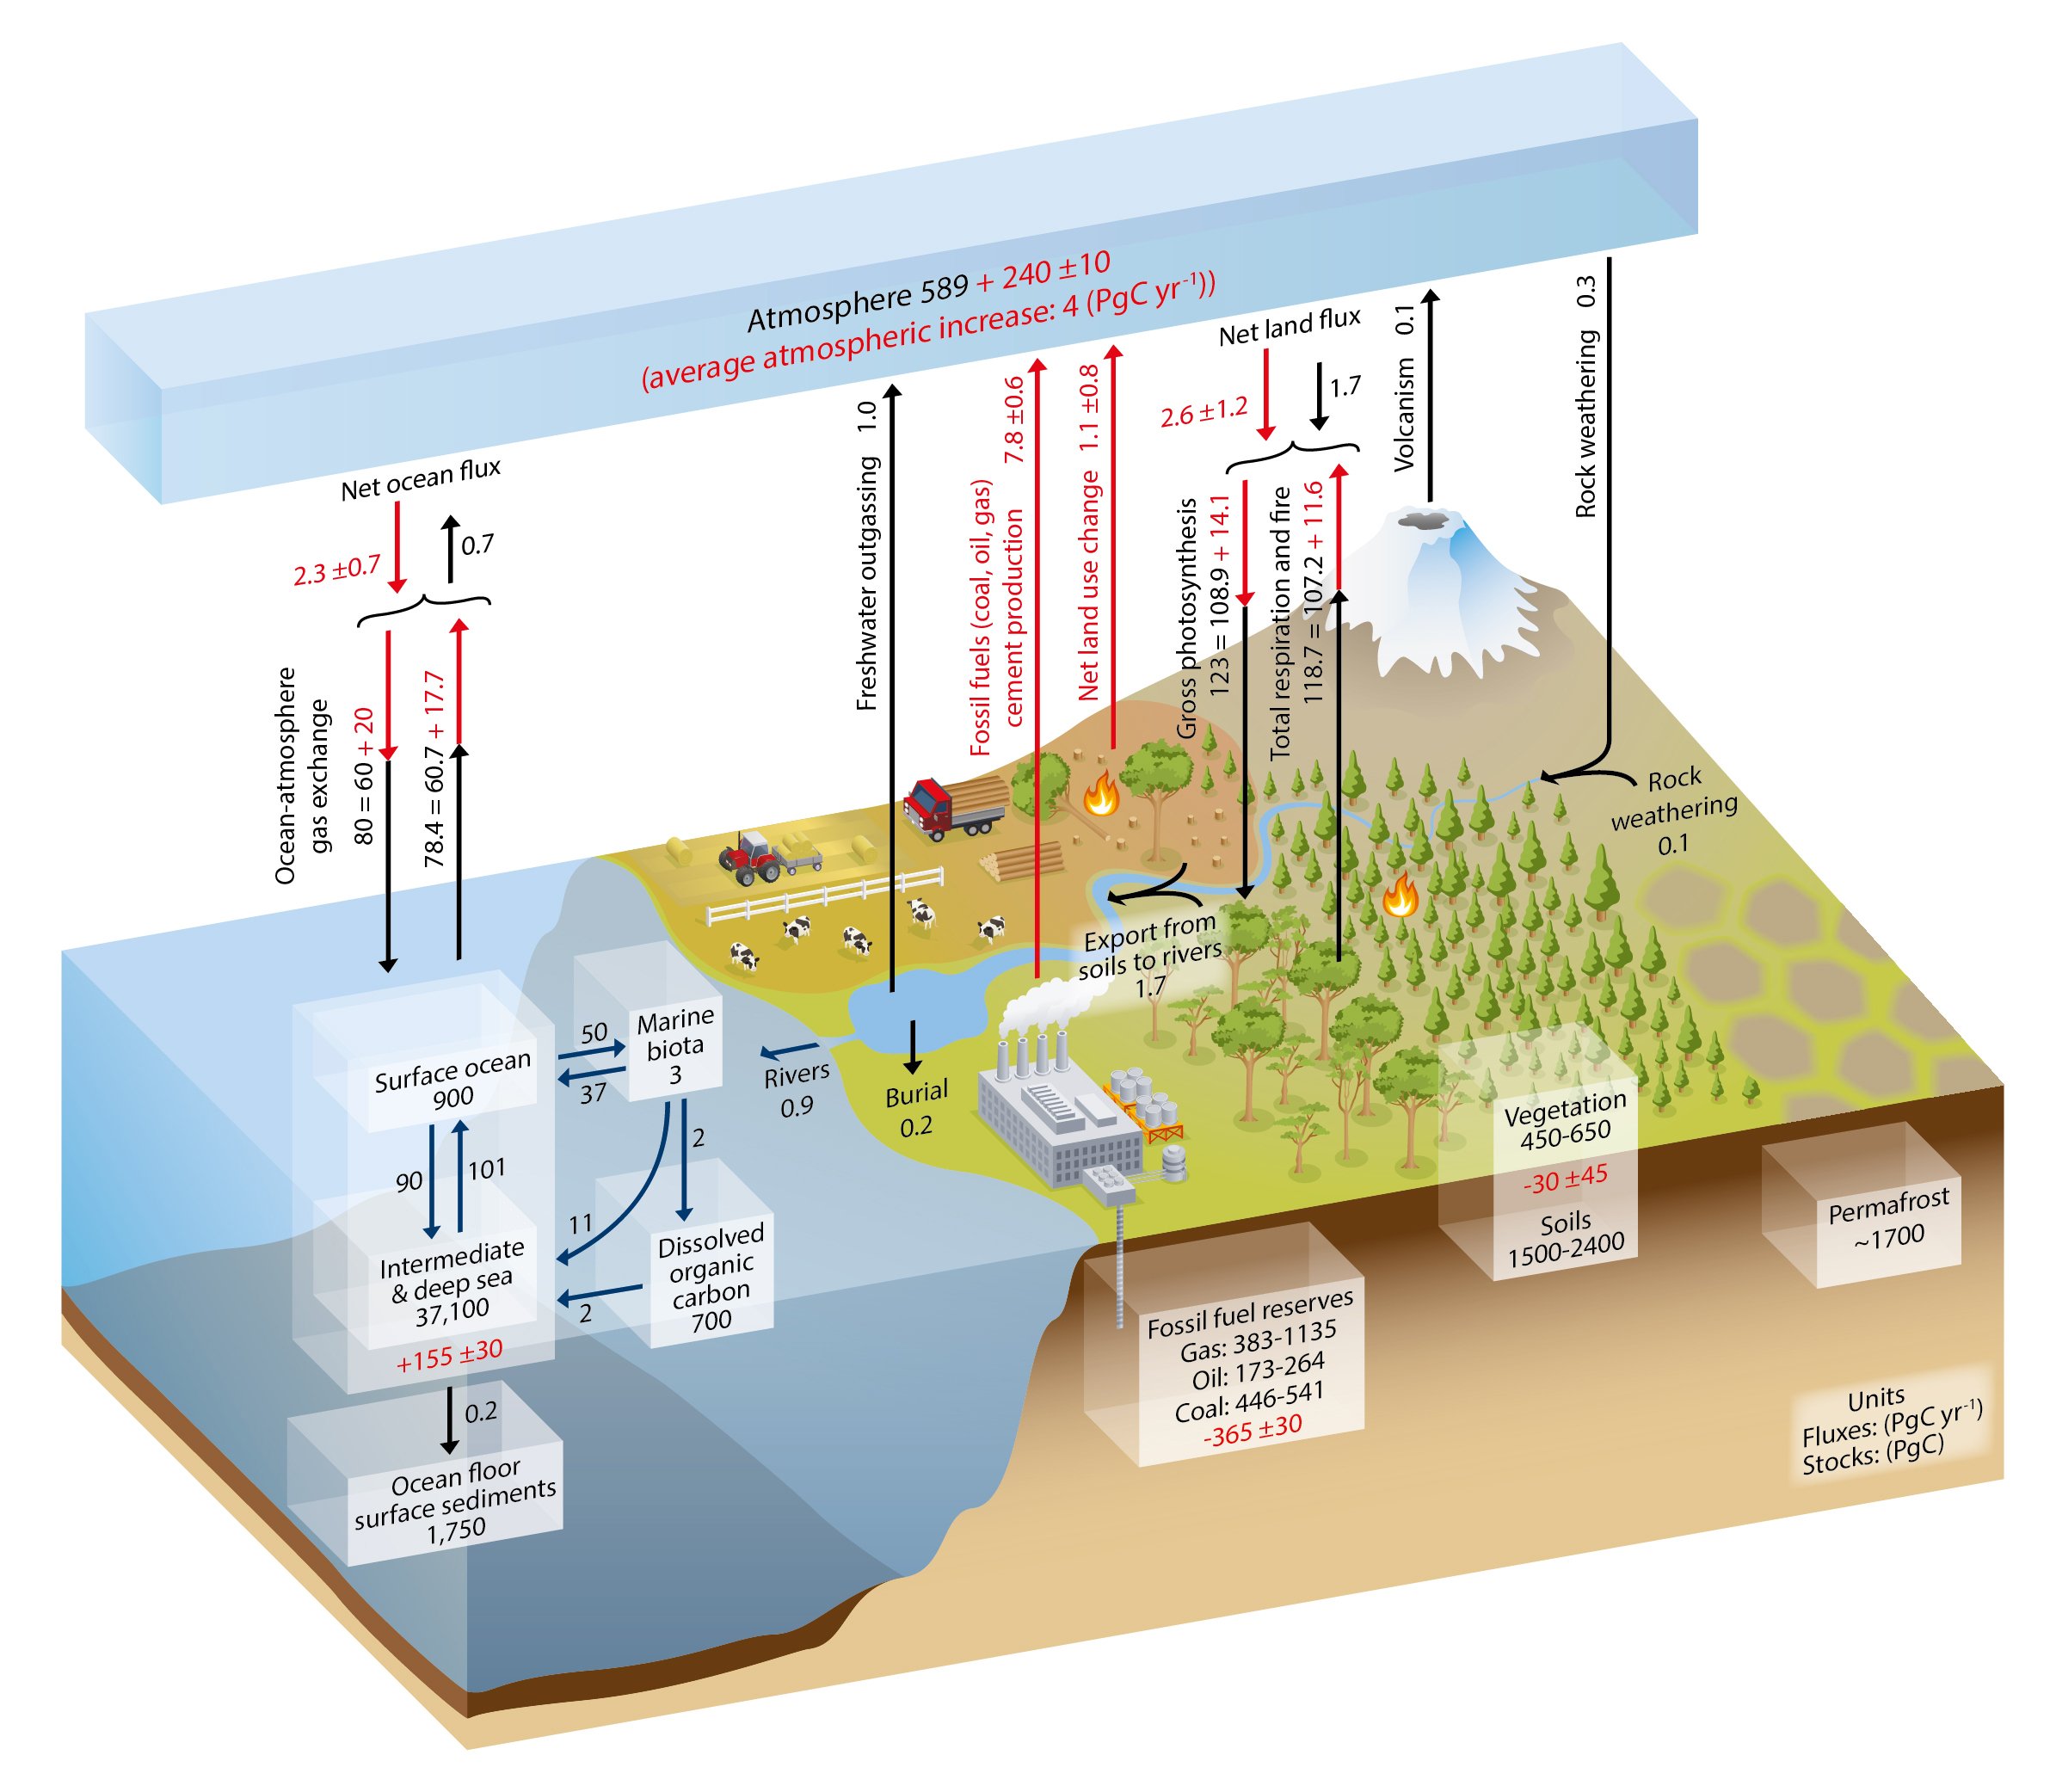
Further, a large influx of dissolved organic carbon (of the order of 100 GtC over 150 years or less) would result in a large increase in DIC, with both showing as a significant change in δ13C; which has been shown to not have occurred by the sponge data. Given this, and absent any paper showing a large increase in dissolved organic carbon, your claim is shown to be false.
-
RedBaron at 11:31 AM on 8 November 2016Watch: Before the Flood
@21 scaddenp,
We are getting about 5X the stocking density using MIRG, than set stock rates. ie 400 cow days per acre in areas that typically get 80 cow days per acre. That's over 2 cows per hectare, almost 3. If you add chickens you get even more cow days plus eggs too. (chickens greatly improve pasture by eating parasites, grasshoppers and spreading manure) They are the clean up squad that follows a few days after the cows are off to another paddock. All this without a drop of nitrogen or irrigation and 30" annual rain.
-
villabolo at 11:00 AM on 8 November 2016President Trump would Make America Deplorable Again
@JonBo69,
If Trump wins the presidencey we know he's going to srew up the climate, but additionally I am also wondering what will happen to the funding of climate science and also the independence of the main scientific institutions and organisations seeing as they are all supposed to be involved in some socialist conspiricy to get people to pay more tax? Are we likely to see climate scientists face prosecution? Any guesses?
It is Republican senators and house members who want to do that and they will be emboldened by Trump who would facilitate them in any way possible. They most definitely will defund as much as they can and continue persecuting climatologists.
Also, as a Uk citizen, I've already started to think about what can be done if Trump wins and goes about implemnenting his denialist policies. I think there should be a call to boycott all American owned businesses - McDonalds, Starbucks etc and to have ongoing demonstrations outside of these places in every town and city.
I don't believe that either the governments of the UK or Europe will have the desire or the will to do those things. They will simply view the horror show from afar and hope it doesn't come their way.
Deities help us all!
-
scaddenp at 10:48 AM on 8 November 2016Watch: Before the Flood
"Do you have a case study where low input intensive was case studied but failed to work?"
I have case studies of low input intensive (and heavily managed grassland) that have been shown to "work" (maintain SOC), but not at the stocking intensities common in dairying here. It seems that in US land values are lower and stocking rates much lower and more emphasis on output per animal. SOC is regularly monitored all over the country in numerous farm management systems. However, increasing SOC is not a priority. Would only become one if it was somehow involved in increasing net$$ per ha beyond what is achieved with high input. With more protection being ordered for groundwater and rivers, that may happen, but present government will not act in way that would reduce farm incomes, particularly when milk prices relatively depressed.
-
RedBaron at 09:26 AM on 8 November 2016Watch: Before the Flood
Ps Addition to post #18
That should read,
I don't even know that this particular strategy of intensification has even been tried on your particular podzol. As far as I know, only extensive and high input intensive have been trialed side by side on your particular podzol. Do you have a case study where low input management intensive was case studied but failed to work on your particular podzol?
-
RedBaron at 09:06 AM on 8 November 2016Watch: Before the Flood
@17 Tom,
I think maybe you read that wrong Tom. I am not claiming that all the soil carbon lost can be found in the atmosphere. It has gone many places, mostly wind and water erosion...and some into the atmosphere as well. The point is to address saturation, not to deny the major influence of fossil fuel emissions. Even though BCCS in the soil doesn't have the same saturation level as industrial ag or biomass sequestration in forests. There would have to be some finite saturation point somewhere. We know that point has to be at least as high or higher than soils' SOC were prior to degradation due to agriculture. So taking those figures we know that before we fill up the soil sink "bucket", we will run out of extra CO2 in the atmosphere "bucket". So far the soil sink is still large enough. But if we keep burning fossil fuels at these ridiculously high rates, eventually even as large as the soil sink, it would no longer be large enough.
-
RedBaron at 08:50 AM on 8 November 2016Watch: Before the Flood
@15 Scaddenp
You said, "Intensification on traditional dairy areas by adding more fertilizer is also bad for SOC."
Exactly my point. There is intensification due to management changes using biomimicry as a model, and intensification with increased inputs of fertilizers. The first should theoretically be able to push through the SOC barrier you describe. The second never can and never will. Goes back to what I was describing above in post #7 where we have two sets of numbers. But to actually give you a case study to prove that? Not sure we have a case study on your type of podzol on the books as of yet, since although common where you are located, it is rare overall, as this is a relatively rare forest soil to find in dairy operations elsewhere in the world. I personally would contact Dr. Christine Jones from Australia, to see if she might know of one.
I know the strategy I would try. I could even set up a side by side case study by splitting your dairy farm into two and try one beside the other. Or even 3. But I simply don't have access to a case study good or bad under the narrowly defined criteria you require. I don't even know that this particular strategy of intensification has even been tried. As far as I know, only extensive and high input intensive have been trialed side by side. Do you have a case study where low input intensive was case studied but failed to work?
-
Tom Curtis at 08:48 AM on 8 November 2016Watch: Before the Flood
Red Baron @4, claims that:
"There is more carbon missing from the soil than extra in the atmosphere."
That claim, however, is inconsistent with actual records of changes in CO2 concentration, as, for example, those documented in the Global Carbon Budget 2015:

As can be seen, combined fossil fuel and cement manufacture contributions(189 ppmv equivalent) exceed the combined increase in ocean Dissolved Inorganic Carbon (DIC) and atmospheric CO2 (182 ppmv equivalent). The land use contribution, including that from plant matter and Soil Organic Carbon is less than the reduction due to reforestation in the northen hemisphere and the greenhouse fertilization effect. Extending the data back to 1850 shows cumulative land use change emissions to be just 68% of the increase in atmospheric CO2, with industrial emissions representing 174% of the atmospheric increase.
Further, measurements of C13 in sponges show there to have been no large influx of carbon into the atmosphere or ocean since 1350, other than that coincident with the rise of industrial emissions:

To clarrify what you are seeing, the atmospheric pCO2 show measurements from icecores and and mauna loa. The Jamaica, Shallow Water show measurements from sponges at a depth of approximately 25 meters, which being in the mixed layer are expected to track atmospheric levels fairly closely. Those from Pedro Bank (approximate depth of 125 meters) are below the mixed layer, and so should track ocean levels of DIC. None show a large perturbation prior to 1850, after which records of fossil fuel use show them conclusively to have been the largest contributor to the increase in atmospheric CO2.
In short, Red Baron's claim is simply inconsistent with what is known about the carbon cycle in recent times.
-
RedBaron at 08:23 AM on 8 November 2016Watch: Before the Flood
@12 John,
Nope I am not familiar with them. I did a quick skim. Seems pretty legit to me. I don't see any red flags.
-
scaddenp at 08:05 AM on 8 November 2016Watch: Before the Flood
Intensive RG has been backbone farm practise here since 1950s (Gallagher electric fence invented here in late 1930s with massive improvement by the Phillips fence in early 1960s), but latterly, world milk prices have given rise to dairy conversion from both crop and lowland sheep, using large-scale irrigation systems on what was dryland agriculture with lots of nitrate as well as RG. We manage very high productivity per ha with low costs (eg see comparison of US with NZ done by Wisconsin here) with these systems. Since yield per ha seems to be driving force, it is going to be hard to get better soil management established, except that this dairying does increase SOC significantly on places that used to be dryland cropping, but not elsewhere. Intensification on traditional dairy areas by adding more fertilizer is also bad for SOC.
Prev 463 464 465 466 467 468 469 470 471 472 473 474 475 476 477 478 Next


