


 Arguments


Recent Comments
Prev 492 493 494 495 496 497 498 499 500 501 502 503 504 505 506 507 Next
Comments 24951 to 25000:
-
chriskoz at 10:17 AM on 4 August 20162016 SkS Weekly Digest #31
Big news about CSIRO this week:
Turnbull government [Greg Hunt] orders CSIRO U-turn towards climate science
Remember Greg Hunt is the same guy, who, as env minister couple years back, were famously learning about the science of AGW from Wikipedia, only those fragments that suited his denying narrative. He has also approved Adani’s Carmichael coal mine and dredging of Abbott Point (is it just a coincidence or a meaningful name after a person to take most shame) to export that coal thus maximise the "good for humanity" business. Certainly Greg did not undone damage his ignorance has done back them (will never undo) but he's trying in his new role as science minister to rebrand himself as climate science accepting guy.
-
Tom Curtis at 09:25 AM on 4 August 2016Climate Bet for Charity, 2016 Update
Rob Honeycutt @9, the data used is the average of the RSS TLT (anomaly interval of 1979-1998) and UAH TLT (anomaly interval of 1981-2010). Because of the recent anomaly intervals, negative values are still possible with a strong enough La Nina (as happened in 2008) or volcano. Moreover, it is not clear that KT is projecting negative values, as five to six months of near zero values would bring about a cross over with the red line.
I think it is fairer to say that his comment is likely to be optimistic because it is consistent with his global warming skepticism. A La Nina as strong as that in 2008 would now result in a slowly rising trend rather than a flat or negative trend due to the increased underlying temperature in the interval.
On a side note, I presume the use of the most recent version of UAH (v6 Beta) is consistent with the terms of the bet. In that case the likely update of the RSS TLT inline with current update of the TTT and TMT products to version 4 will also be required by the terms of the bet before the bet is due. As that update resulted in a significant increase in the warming trend in the TTT and TMT products, it is also likely to do so in the TLT product, thereby increasing the overall trend (just as the update to UAH v6 will have decreased it). Given that, and given the decrease in the 2001-2010 cumulative sum in 2008 makes the "skeptic" side of the bet a poor one from the current outlook.
-
Rob Honeycutt at 04:25 AM on 4 August 2016Climate Bet for Charity, 2016 Update
KT is a little overly optimistic for his position, stating, "I’m guessing the green line will cross back under the red in five or six months as El Nino fades out and La Nina arrives."
He fails to grasp his own data. A La Nina will act to flatten the trajectory, not cause it to fall back below that trajectory. Meanwhile, models are actually projecting the La Nina to be a mild one.
-
barry1487 at 11:06 AM on 3 August 2016Climate Bet for Charity, 2016 Update
Couldn't find the widget for the bet on the right-hand side bar.
The "warmists" line has topped the "coolists" in recent months on Kiwi Thinker's chart.
http://www.kiwithinker.com/climate-bet/
(This is an updated link, so things may be different than today if you click on it later in time)
Moderator Response:[PS] Fixed link. Please use the link tool in the comment editor in future.
-
Tom Curtis at 21:45 PM on 2 August 2016CERN CLOUD experiment proved cosmic rays are causing global warming
Aaron S @12:
1)
"I fail to see the connection between Earth's magnetic field, and the Sun's magnetic field. Are we are discussing climate relative to the sun's magnetic field deflecting Galactic Cosmic Rays? The Earth is something like a millionth the volume of the sun, and its magnetic field is weak regarding our solar system deflecticing Galactic Cosmic Rays."
From Scherer et al (2006):
"The Earth’s magnetic field shields us partly against galactic cosmic rays and solar
particles. The lower energy limit needed for a charged particle to cross the Earth’s
magnetosphere and access a specific position at the top of the atmosphere decreases
with the geomagnetic latitude of the observer, resulting in a cosmic ray flux on Earth
increasing poleward. The cosmic ray flux dependence on the geomagnetic latitude
was already observed shortly after World War II. Figure 28 represents the variation
of the flux of fast neutrons in the atmosphere with geomagnetic latitude measured
by Simpson (1951, 2000)."(My emphasis)
Fig 28:

Fairly obviously, if galactic cosmic rays where unaffected by the Earth's magnetic field, the variation of cosmic ray flux with geomagnetic latittude would be inexplicable. However, it is more interesting than that. To start with, according to Dunai (2010):
"Primary cosmic-ray particles with energies <10 GeV are modulated by the solar wind and by the Sun's 11-year solar activity cycle (Lal and Peters 1967, Eidelman et al. 2004). As a consequence of this modulation, galactic cosmic-ray particles with rigidities (see text box) smaller than 0.6 GV on average (Michel et al. 1996) cannot approach the Earth (at present the solar modulation potential parameter φ ranges from 0.3–1.2 GV, depending on solar activity; Michel et al. 1996, Masarik and Beer 1999, Usoskin et al. 2005, Wiedenbeck et al. 2005; see also Fig. 1.1).
Near-vertically incident particles dominate the primary cosmic-ray flux near the Earth's surface (Dorman et al. 1999; see also Section 1.3). Consequently, primary particles approaching the Earth's geomagnetic equator travel perpendicular to the geomagnetic field, whereas near the poles they travel essentially parallel to the magnetic field lines. Virtually all rigidities are permitted at the poles, while near the equator, rigidities well in excess of 10 GV are required to approach the Earth. The solar modulation limits the lowest energies at the poles to > 0.6 GV, having a consequence that the cosmic-ray flux does not increase monotonously approaching the poles, but levels off at rigidities close to the solar modulation potential (Fig. 1.4). Furthermore primary particles with energies close to the solar modulation potential are not energetic enough to generate a secondary particle cascade that can reach the surface. The resulting break in trend at high latitudes is referred to as the ‘latitude knee’. The decrease of the cosmic-ray flux with decreasing latitude below the latitude knee is sometimes referred to as the ‘latitude effect’."
(My emphasis)
In short, the rigidity induced by the Earth's magnetic field at the equator is approximatly 17 times that induced by the Sun, but while that induced by the Sun filters particles based on momentum equally regardless of terrestial location, the much larger terrestial rigidity at the equator falls to zero at the poles. That means in turn that the Laschamp event resulted in a large increase in bombardment of the Earth by galactic cosmic rays at the equator, but virtually zero effect at the poles. It also follows that the lack of climate perturbation at the Laschamp event represents a serious problem for the GCR/climate connection.
This point is proven by the close correlation between inverted Be10 production, and the strength of the Earth's geomagnetic field:

(Source)
2) Pursuing the effect of the Earth's magnetic field further, it means that if GCR do impact cloud albedo they will do so most strongly were the cut off rigidity is smallest. In fact, a map of the cut off rigidity should also be an inverse map of the strength of the effect:
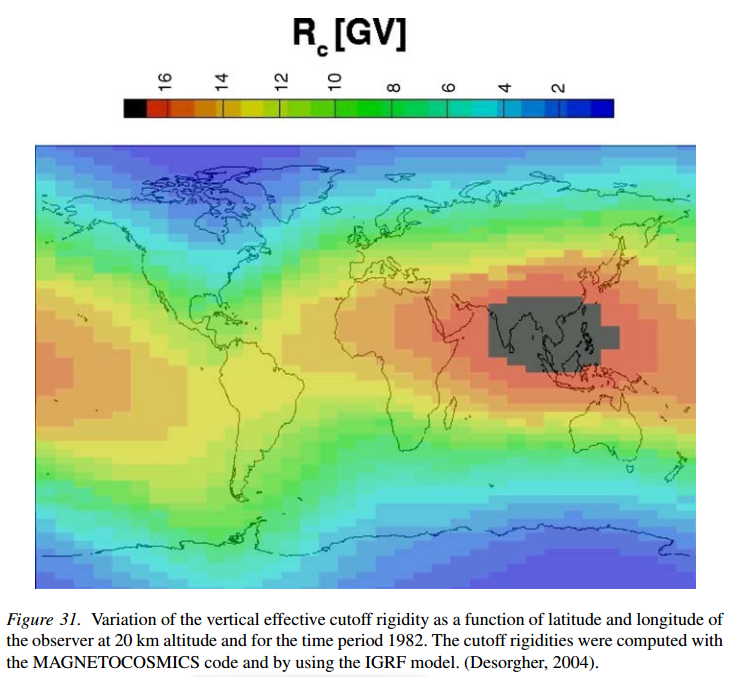
That creates further problems for the theory. First, it means the strongest effect is at the poles, ie, where clouds overly ice and snow so that any change of albedo in the clouds will have limited effect on the albedo fo the Earth. Second, because of the angle of incidence, insolation per square meter at the surface (or cloud top) varies approximately with the cosine of latitude - approaching zero at the poles. So, the strongest impact of GCR on cloud albedo (if there is one) will be located where it has minimal impact on the energy budget.
3) I passed without note above that the cut off rigidity due to solar effects varies from 0.3 to 1.2 GV over the solar cycle, ie, by a factor of 4. In contrast, TSI varied by 0.12% between the solar maximum of 1958 (the strongest on record) and the solar minimum of 2008 (the weakes recent minimum). That difference in effect means it is not reasonable to assume that the GCR effect on climate (if there is one) is a linear function of TSI. Unfortunately I know of no formulation be advocates of the theory of what the relationship will actuall by (other than an assumed linear relationship). If somebody does know of such a formulation, I would welcome a link to it. Absent a formulation, however, the 'theory' that GCR effect climate is no sufficiently advanced as to even quantify the forcing effect. Indeed, given that the strongest effect will be at the poles where the greenhouse effect of clouds is far more significant than their albedo (because of the albedo of the underlying snow and ice), it cannot even securely determine the sign of the effect. That means in scientific terms it is not yet a theory, but at best a hint as to how a theory might be developed.
4) Despite (3) above, I will follow standard practise in this case and use TSI as a proxy for TSI plus GCR forcing. I will justify this base on the fact that if TSI plus GCR forcing increases at less than a linear rate with respect to increases of TSI, any GCR effect will be minimal and largely irrelevant. If it increases at greater than a linear rate, that should exagerate the apparent effect of TSI on climate even more than is shown by the linear assumption. Failure of a significant correlation between TSI and temperature will therefore show that the GCR effect is either very weak, or rises at a less than linear rate with rising TSI (and therefore is self damping).
Given the above, here is the normalized running eleven year means of TSI and Global Means Surface Temperature (BEST LOTI) from 1850-2008:
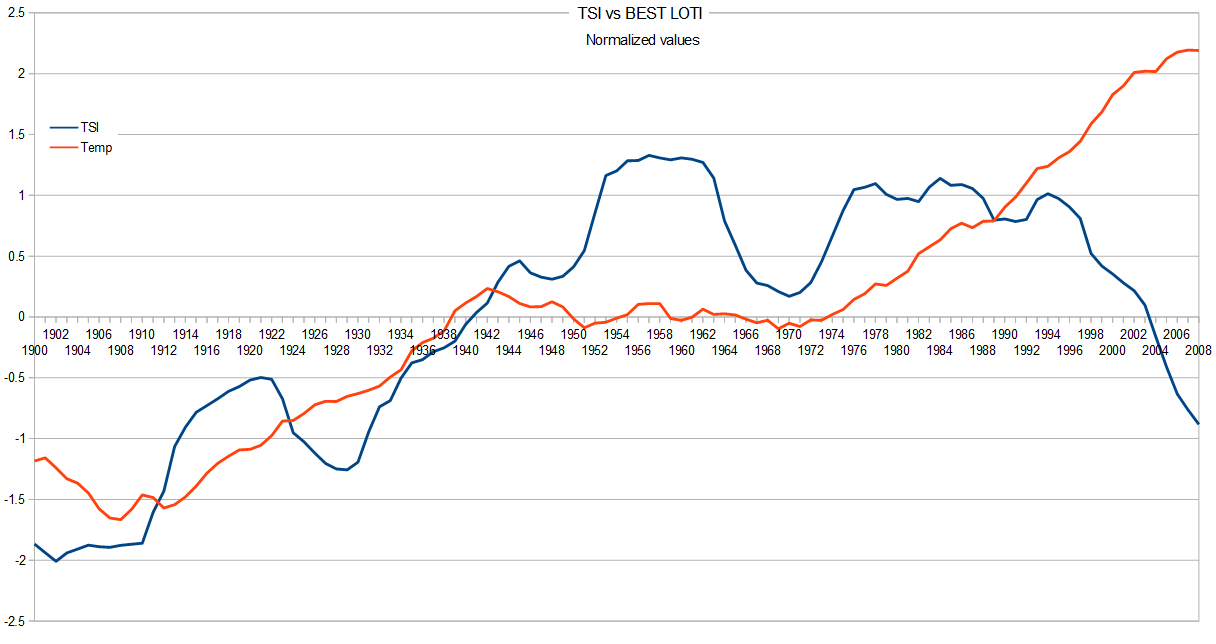
It is very clear that there is a poor correlation between the two. Indeed, the correlation between the unnormalized, annual values is just 0.416, with an r^2 of 0.173. Intuitively that means TSI explains 17.3% of the variation in temperature at most. Likely it explains much less once we allow for coincidental events and independence effects. For comparison, the correlation between CO2 concentration and the BEST LOTI (1850-2013) is 0.902, with an r^2 of 0.814.
-
MA Rodger at 21:14 PM on 2 August 2016CERN CLOUD experiment proved cosmic rays are causing global warming
ArronS @12.
Do you not feel it is exceedingly presumptive of you to ask me, while examining your "abundant literature" on this subject of Svensmark's cosmic-ray conjecture, whether I have "addressed the new Nature paper"? Do you not realise that you had until now entirely failed to include this paper in your listing of "abundant literature"? And am I not disputing the existance of such an "abundant literature" and disputing your inclusion of papers you have so far listed? I am thus hardily the one who would know what you would or would not choose to include in your "abundant literature"!!
This particular paper Kirkby et al (2016) 'Ion-induced nucleation of pure biogenic particles' does follow on from papers addressed in the Original Post so comment on this new paper's relevance could be requested from the OP authors.
And if you do wish to include it in your list of "abundant literature", I would not go jumping to conclusions. In a Nature News item you will note Kirkby tells us of the results:-
"The latest experiments suggest that it may have been cloudier in pre-industrial times than previously thought. If this is so, then the masking effect, and in turn the warming effects of carbon dioxide, might have been overestimated, ... (but) ... itis too early to say whether this is true in practice, or by how much, because there are so many factors that play into such projections,"
And that comment is from one who in the past was supportive of Svensmark's conjecture. (The apperance in the paper's references of Kirkby (2007) 'Cosmic-rays & climate.' is indicative that the situation continues.) The other comment in the same Nature News item (from Knutti) says that the results will probably not affect the most likely projections of warming, as laid out by the Intergovernmental Panel on Climate Change. "Our best estimate is probably still the same," he says.
Regarding your various confusions w.r.t. Steinhilber et al (2012), you first confusion concerns quotes from the conclusions of their paper. Identifying how they reach such conclusions may be worth your consideration. Note that the word "significant" is used in a statistical sense & the word "remarkable" may be used more in its original less-sensational sense, meaning 'something worthy of remark'. Your second confusion appears to show you do not truly understand the first sentence of the Steinhilber et al (2012) abstract (You helpfully quote it @13.) which is perhaps clearer than my chosen quote from the paper. And just to be totally clear, the concensus view is that cosmic rays do not impact greatly on climate. The Steinhilber et al. position is that cosmic radiation proxies can be used also as proxies for solar magnetism and so in turn as proxies for TSI. Note this is the first three items in your causal chain @9 but backwards. Increase in solar activity-> stronger magnetic field -> less CR -> Less high albedo clouds -> more irradiance and warmer earth. The final two items are entirely absent (even by implication) from Steinhilber et al (2012) and thus their position represents a concensus position. The position presented by Tsonis et al (2015) is different: that a cosmic ray effect does exist which isn't yet addressed by climate modelling but that it is importantly not responsible for the recent global warming. A third position which is the one you appear presently signed-up to is the Svensmark conjecture that asserts that a major portion of the recent global warming results from cosmic-ray variations.
Concerning Tsonis et al (2015), the links @10 are presented for completeness & are in themselves of no great importance. Regarding Tsonis & Swanson, their seemingly-never-ending publications on what developed into their 'synchronised coupling' model of climate perhaps has apparently and thankfully ended with Tsonis & Swanson (2012). I feel that "dodgy" a reasonable description of it. If I address "character" it is the character of their writings not their persons so you high horse has no place here.
Concerning TSI since 1900, you wrote @9:-
"the last century stands out as one of 2 major increases in solar activity based on the isotope data, and is exceptional in the AA index, and SSN. You are probably confused about the duration of the trend becasue it is true that the last decade the sun's activity has dropped."
Unless you want to revise it, this statement very clearly implies you see a "trend" which is "one of 2 major increases in solar activity" lasting a century. You may not feel a century-long rise is much different to six decades of rise & four decades of slight decline, but the arbitor in this is the global climate and for the climate, the difference would be stark indeed.
-
chriskoz at 12:58 PM on 2 August 2016A climate scientist and economist made big bucks betting on global warming
Hope is just a calculated money-maker: he did not risk anything. Annan risked quite a bit by betting 4:1, i.e. his winning return was only 1.25. As the scientists he knew the actual odds of strong LaNina year being a local maximum along the warming signal were much smaller than that, so he could affford it.
Having denialist "put their money where their mouth is", does not teach them anything because the amounts involved (e.g. £1000 in Hope case) are too small. The problem is that the rewards from FF market are far surpassing (in the order of millions $) the losses from foolish and ignorant bets, like this by Plimer and Rudge. They happily pay it, meanwhile collecting cheques hundred times that much of perhaps laundered money, remunerating them for their service to GWPF.
-
michael sweet at 12:00 PM on 2 August 2016Sizzling Midwest Previews a Hotter Future Climate
Eksommer,
As I understand it, the Midwest has warmed more in the Fall, Winter and Spring than it has warmed in the Summer. Since they have not warmed much in the summer yet, they have not seen an increase in summer heat waves. The lack of increase in summer heat spills over into a lack of summer heat waves. Several years ago in spring there was a midwest heat wave where in several locations the minimum temperature at night was higher than the previous highest temperature measured during the day had been. That "heat" wave was not noticed by the general public much because the absolute temperature was not as hot as it gets in summer.
Thermal pollution is heat released into the enviroment. For example a central power plant heats up the cooling water that it returns to the environment. Black streets contribute thermal pollution to urban centers and cars release a lot of heat from the tailpipe. This heat is much less than global warming from carbon dioxide but can have severe local effects (for example if a river is increased in temperature by several degrees that affects the local fish). Occasionally the effects are positive. In Florida manatees like the warm water outflows from power plants in the winter.
-
Eclectic at 11:59 AM on 2 August 2016These are the best arguments from the 3% of climate scientist 'skeptics.' Really.
Aaron S @10 . . . as an extra note for readers :- Aaron, in the "CERN CLOUD experiment" thread you had also mentioned (in more detail) some hypothesized effect on climate by Galactic Cosmic Rays.
In the same CERN thread, other posters refuted that hypothesis, also in more detail.
It seems evident that Cosmic Rays have little or no effect on climate changes.
-
wili at 11:20 AM on 2 August 20162016 SkS Weekly News Roundup #31
Thanks as always for this service. For July 24 you have this title twice:
Nuclear Subsidies Are Key Part of New York’s Clean-Energy Plan by Vivian Yee, New York Times, July 20, 2016
-
nigelj at 10:02 AM on 2 August 2016These are the best arguments from the 3% of climate scientist 'skeptics.' Really.
Aaron @ 10.
We have a consensus on climate change at this point at time and its quite a strong consensus, like the consensus on evolution or basic theories of physics. These things could of course change, but it's unlikely.
Regarding cosmic rays. Science requires causation and correlation and currently causation is unproven, and over the last 50 years theres no increasing cosmic ray trend so no correlation. You must have both causation and correlation. If cosmic rays are contributing to recent warming, it looks at very low level to me at best.
Regarding solar irradiance and sunspots. We have various different cycles, and the 11 year sunspot cycles are too short to be a factor in the longer warming trend.
The longer sunspot / solar irradiance cycle shows a slightly falling tend over the last 50 years, so theres just no correlation. The affect of solar irradiance on temperatures is pretty instantaneous, so its hard to see how current temperatures would relate to increases in solar irradience over the early part of last century. The main potential feedback mechanism would be release of CO2 from the oceans, however the oceans have basically been acidifying from early last century so any feedback would probably be quite small.
So it's hardly surprising that most published science says all or nearly all recent warming is from CO2. Obviously there are also certain atmospheric changes which implicate CO2, such as nights warming faster than days, etc.
-
Aaron S at 02:30 AM on 2 August 2016These are the best arguments from the 3% of climate scientist 'skeptics.' Really.
Not all skeptics of climate models deny that the trace gas CO2 is a significant GHG and directly capable of about 1.1deg C warming. Rather some debate the sensitivity of Earth's climate to changing the abundance of CO2 and other GHG because of uncertainties about the feedbacks that define most of the IPCC anticipated global warming (Base Case- say A2 scenario). Your consensus argument is problematic to me. Science is dynamic and so are scientists views (hopefully), and thus the claim of certainty in climate science is also dynamic. Even if there is certainty now, new data could introduce uncertainty as it guids us towards reality.
Currently, climate sensitivity is being challenged by data because Galactic Cosmic Rays (GCR) seem to keep emerging as a valid mechanism for forcing climate (3 recent papers below). This is significant because the sun spot number (SSN) is a valid proxy for solar activity (2), which includes TSI and magnetic field strength. The sun's pattern as observed in an 11 year running average of SSN shows that the sun's activity more than doubled from 1900 to 2000, and the absolute value of the slope of the trend was just under 3x as great from 1900 to 1950 as the negative trend was from 1950 to 2000. Currently, we are decending from the sustained solar maximum into a solar minimum. Your list above avoids this, and seems more a strawman argument by suggesting one man's opinion represents that of skeptics (Mann's link to an article about natural climate change says little about data and nothing about new insights into GCR). This page seems to also ignore the potential for the same sort of lags for solar activity that science envokes for the hiatus in explaining less antartic warming than anticipated or the hiatus.
I have almost no doubt that humans are causing significant global warming from GHG plus the feedbacks (as indicated in the papers below). In my own unpublished (for fun) models, I can not recreate global temperature data (HadCrut4) without significant AGW. For me, it is an invalid position to deny this. However, the body of literature for GCR forcing climate indicates to me they are 'likely' a climate forcing mechanism despite what the IPCC suggests, and to be fair several key papers have been published about GCR and solar activity's role in climate since the last IPCC publication. Also, there remains significant uncertainty about how much influence GCR and solar activity play in climate, there remains uncertainty if they play a role at all. However, there are valid questions lurking in the data:
What is the threshold for literature about GCR to actually be considered in an IPCC climate model? Do you really think the current assemblage of climate models has the low case confidently in its range? What happens to the IPCC and climate researcher credibility if we enter a significant Maunder like solar minimum and realize the sun is a stronger driver than in any model?
http://www.nature.com/nature/journal/v533/n7604/full/nature17953.html
http://m.pnas.org/content/109/16/5967.full
http://m.pnas.org/content/112/11/3253.full -
CERN CLOUD experiment proved cosmic rays are causing global warming
Aaron S:
The Sun’s magnetic field doesn’t stop all the cosmic rays from entering the inner parts of the solar system. The Earth’s own magnetic field stops much of the remaining from entering the atmosphere. A weakening of the Earth’s magnetic field – as happened during the Laschamp event – will thus have the same impact as the weakening of the Sun’s magnetic field during low solar activity.
As the chart in my last post shows, the flux of beryllium-10 (a proxy for cosmic rays hitting the atmosphere) nearly doubled. That change is comparable to the typical changes from solar maximums to solar minimums, but it lasted several hundred years. That should make any significant climate impact measurable in the climate proxies, but there is none.
In Alleys own words:
"We had a big cosmic ray signal, and the climate ignores it. And it is just about that simple! These cosmic rays didn’t do enough that you can see it, so it’s a fine-tuning knob at best."Like I said in my last post: Richard Alley pretty much killed the cosmic ray hypothesis!
-
eksommer at 22:35 PM on 1 August 2016Sizzling Midwest Previews a Hotter Future Climate
I don't understand this quote: The Midwest has not experienced any substantial summer warming and this spills over into heat waves," he said. What spills over into heat waves? The lack of experience?
Also, can someone explain "thermal pollution"?
Thank you!
-
chriskoz at 18:19 PM on 1 August 20162016 SkS Weekly Digest #31
@1 is a dangerous spam. Do not open the link therein. Better be deleted by a mod ASAP.
Moderator Response:[BW] Thanks for the heads-up, chriskoz. Spam deleted.
-
Aaron S at 13:12 PM on 1 August 2016CERN CLOUD experiment proved cosmic rays are causing global warming
HK:
I fail to see the connection between Earth's magnetic field, and the Sun's magnetic field. Are we are discussing climate relative to the sun's magnetic field deflecting Galactic Cosmic Rays? The Earth is something like a millionth the volume of the sun, and its magnetic field is weak regarding our solar system deflecticing Galactic Cosmic Rays. The Sun is the player in our solar system. I need to watch the video- perhaps I am missing something, but no way does Alley imply we are talking solar cosmic rays. Then I can Revert.
MA Roger:
Did you address the new Nature paper that states:
"This could raise the baseline aerosol state of the pristine pre-industrial atmosphere and so could reduce the estimated anthropogenic radiative forcing from increased aerosol-cloud albedo over the industrial period."
http://www.nature.com/nature/journal/v533/n7604/full/nature17953.html
I am confused about a few of your points:
MA states:
"his comparison is not used to demonstrate some grand sun-effect on climate but rather to show the wobbles in their 9,200-year record can be found in climate data."
Steinhilber et al (2012) Concludes:
" A comparison of the derived solar activity with a record of Asian climate derived from δ18O in a Chinese stalagmite reveals a significant correlation. The correlation is remarkable because the Earth’s climate has not been driven by the Sun alone."
MA states:
"Your first citation Steinhilber et al (2012) is certainly not part of such a literature as it tells us "TSI is taken as a proxy of solar activity" which is the particular position that Svensmark (& apparently you also) argue against."
Aaron S:
I don't understand what you mean. TSI is used for a proxy of solar activity. Solar Activity includes TSI, as well as magnetic field strength. Solar Forcing is the combination of both (perhaps even additional contributions from the exagerated flux of the UV spectrum of TSI).
Steinhilber et al (2012) (in Abstract):
"The new cosmic radiation record enables us to derive total solar irradiance, which is then used as a proxy of solar activity to identify the solar imprint in an Asian climate record. Though generally the agreement between solar forcing and Asian climate is good, there are also periods without any coherence, pointing to other forcings like volcanoes and greenhouse gases and their corresponding feedbacks. The newly derived records have the potential to improve our understanding of the solar dynamics and to quantify the solar influence on climate."
I think I am picking something up here: Are you guys thinking cosmic rays are from the sun- ie random solar storms that may interact with Earth? Just to be clear, the Svensmark theory are talking about Galactic cosmic rays from super nova explosions across the universe. These are relatively constant and originate from many different directions. The sun's magnetic field deflects these depending on strenght of solar activity, and then cloud cover is impacted by the amound of Galactic Cosmic Rays reaching the Earth. Yes the Earth's field plays a minor role to but clearly minimal compared to the sun. Yes our sun's cosmic rays can play a role in short term cloud cover and "weather" not climate, but again this is not what the Cosmic Ray theory is implying.
Regarding:
Tsonis et al (2015)- Please don't bring character into a data debate- not professional. I need to read your links to understand the problems. Have to revert back later.
MA issue with Solar Trend:
Really in fig 3D of the Steinhilber et al (2012) you don't see in 1910 we were in a solar minimum, characterized by increased CR intensity (weaker solar mag field, more cosmic rays, more nuclei, more clouds, more albedio, less sunlight), then by 1950 to 2000 we were in a very large and sustained solar max. Basically you have a very steep slope 1910 to 1950, then a very minor slope 1960 to 2010. This is difficult for me to understand how you say: "specifically that over the last century it has been a rising one." Furthermore, it is ironic to me when lags are accepted for things like the hiatus, but the role of the sun is considered invalid if there is a lag from say ocean circulation or whatever. It is bad logic.
-
CERN CLOUD experiment proved cosmic rays are causing global warming
I think Richard Alley pretty much killed the cosmic ray hypothesis here. The relevant part of the lecture starts at 42:00 if you don’t have the time to listen to all of it.
Below is the chart he’s referring to, showing how the flux of beryllium-10 produced by cosmic rays greatly increased as the Earth’s magnetic field weakened by 90 % about 40,000 years ago. The climate ignored it and that should be the end of the story.

-
MA Rodger at 23:23 PM on 31 July 2016CERN CLOUD experiment proved cosmic rays are causing global warming
Aaron S @7&9.
I fail to see that there is any "abundant literature that does exist supporting the influence of Cosmic Rays on Earth's climate." You certainly provide no evidence for such literature.
Your first citation Steinhilber et al (2012) is certainly not part of such a literature as it tells us "TSI is taken as a proxy of solar activity" which is the particular position that Svensmark (& apparently you also) argue against.
Perhaps you misinterpret the Steinhilber et al. comparison of their 9,200-year TSI record with the Dongge Cave δ18O record. This comparison is not used to demonstrate some grand sun-effect on climate but rather to show the wobbles in their 9,200-year record can be found in climate data.
(Note also that both sets of data are detrended as the "climate record has a large long-term trend due to orbital forcing." And further, even detrended, "this correlation, however, can only explain 10% in the total decadal to centennial variance in the AM (ie Dongge Cave) record." There is thus no grand Svensmark-type climate effect lurking in the Dongge Cave.)
Your second citation Tsonis et al (2015) is the work of a bunch which includes Tsonis and Swanson, a pair well know for publishing dodgy climate work. (Indeed, Tsonis et al (2015) is challenged here & reply here). Yet here Tsonis & Swanson let down denialism, their paper stressing that they agree here with the IPCC, saying:-
"it is important to stress that they (ie the findings) do not suggest that CR (cosmic ray) influences can explain global warming and should not be misinterpreted as being in conflict with the IPCC. Indeed, the opposite is true: we show specifically that CR cannot explain secular warming."
I thus fail to see any coherent representation of an "abundant literature" supporting your position on the effects of cosmic rays on climate or your assertion that there is some sort of denial required to enable the IPCC's conclusions.
I also find fault in your description of the trend in solar output, specifically that over the last century it has been a rising one. Solar output did rise strongly 1900-60 but has since been on a declining trend. There has been decline not rise for the last 60 years.
Note that my position on all this is not anywhere greatly different to the comment by KR @8.
-
denisaf at 21:46 PM on 31 July 2016Sizzling Midwest Previews a Hotter Future Climate
This discussion of inevitable increase in heat waves and how they affect people provides some insight into a predicament that is bound to get worse in many global regions. However, there is a factor that will make the situation much more serious than depicted n this article. Society is very dependent on the services (such as air conditioning, the water supply, etc) provided by the existing infrastructure. This aging infrastructure uses irreplaceable materials for its operation and maintenance so the ineviable decline in the services it provides will make it harder for society to cope with the increase in heat waves and other manifestations of climate change (such as sea level rise).
-
Wol at 15:40 PM on 31 July 2016Sizzling Midwest Previews a Hotter Future Climate
@ nigelj : >>The largest problem is very high temperatures combined with humidity, as its harder to cool down because sweating is reduced. <<
I know where you are coming from, but sweating is not reduced - it increases greatly. Evaporation, cooling, is what is reduced.
-
Aaron S at 15:34 PM on 31 July 2016CERN CLOUD experiment proved cosmic rays are causing global warming
KR. Did you read the papers? Perhaps a reread is in order based on the consistent inconsistencies between your reply and the papers.
The first reference ( http://m.pnas.org/content/109/16/5967.full) correlates the 9400 yr record to the equivalent Asian Monsoon proxy, which is not a global climate proxy, but represents a major regional data set. The authors conclude:
" A comparison of the derived solar activity with a record of Asian climate derived from δ18O in a Chinese stalagmite reveals a significant correlation. The correlation is remarkable because the Earth’s climate has not been driven by the Sun alone."
So I am unclear what you mean by "not climate change"? It seems you missed a major part.
Second paper your quote is correct- the "Causation" was only found between CR and HadCrut3 after removing the warming trend. That is huge by itself and basically shows CR force climate, and yes the majority of modelers don't like this result- but I consider that as invalid reasoning for the validity of the conclusion. Also, please note that paper finds significant correlation between CR (AA) and the longer term (century scale) Gobal Temp trend (HC3), but not causation. The correlation is still significant and itself greatly strenghtens the case that CR play a role in climate change. It says little that it didn't pass the causation test becasue the Signal Noise Ratio was short given the data evaluated. I would be surprised to get a positive outcome for a centruy trend in a century and half of data. It would be a facinating study to use the 9400 yr data from the first paper and evaluate for causation as SNR increases with N.
Third. You say "CR trends over the last century would by those supposed mechanisms be a _cooling_ influence". Now I am really starting to question if you even read the papers as there is a significant increase in solar activity over the last century-> stronger magnetic field -> less CR -> Less high albedo clouds -> more irradiance and warmer earth, and the last century stands out as one of 2 major increases in solar activity based on the isotope data, and is exceptional in the AA index, and SSN. You are probably confused about the duration of the trend becasue it is true that the last decade the sun's activity has dropped. Of course, this is when the models start to run cool compared to the measured global temperatures of the satellite and Had Crut data sets, and given lags are a reality- we don't know the role of the decrease in solar activity yet.
Final point- Yes the IPCC discusses this in the text, but which model itteration has a stronger sun that considers CR? The text concludes not to use for models, models are used for predictions, predictions are used by society.
I hope this helps
Cheers,
Aaron S
-
KR at 13:19 PM on 31 July 2016CERN CLOUD experiment proved cosmic rays are causing global warming
Aaron S - Your first reference details isotope proxy issues for cosmic ray and solar activity, not climate change, your second states "..although CR clearly do not contribute measurably to the 20th-century global warming trend, they do appear as a nontraditional forcing in the climate system on short interannual timescales, providing another interesting piece of the puzzle in our understanding of factors influencing climate variability"; and even that influence is only supported by a minority opinion.
Add to that the facts that even the most generous estimates of CR influence are very very small, and that CR trends over the last century would by those supposed mechanisms be a _cooling_ influence, and it's no surprise that CR influences aren't considered a smoking gun in recent warming.
But not ignored; there is considerable discussion of CRs in IPCC AR5 WG1, Chapter 7, Clouds and Aerosols. You might want to look there before claiming that some significant issue is being overlooked.
-
Aaron S at 11:37 AM on 31 July 2016CERN CLOUD experiment proved cosmic rays are causing global warming
Based on the abundant literature that does exist supporting the influence of Cosmic Rays on Earth's climate, how can anyone justify the IPCC ignoring cosmic rays and scenarios for stronger solar forcing in some of their global climate model iterations? The sun's activity significantly increased coeval with industrialization into a sustained solar max (see first link below), and it seems critical to understand the role of both solar activity and AGW to attempt to model Earth's climate.
Recent examples of the abundant literature that Cosmic Rays do influence Earth's climate (beyond the CERN nature paper above) include:
Pnas 9400 yr cosmic ray record correlated with asian monsoon.
http://m.pnas.org/content/109/16/5967.fullPnas paper showing causation that cosmic rays force global climate in multi year time intervals and also a century of strong correlation
http://m.pnas.org/content/112/11/3253.fullVideo of Cern Paper (simple 5 min overview):
https://home.cern/about/updates/2016/05/cloud-shows-pre-industrial-skies-cloudier-we-thought
Older papers include:
Geel, B.V. Raspopov, O.M. et al. The role of solar forcing upon climate change, Quaternary Science Reviews 18 (1999), pg 331-338.
The Svensmark set of papers like:
http://www.sciencedirect.com/science/article/pii/S1364682697000011
Additionally literature: there are many papers that find the sun's highly periodic (22 yr today) signal of the Hale cycle paleomagnetic reversals preserved in regional climate proxy data like tree rings and lacustrine varves, and this solar magnetic periodicity most likely related to cosmic rays (here is one with an overview of some of the occurences):
http://link.springer.com/article/10.1007/s10933-008-9244-0
Question 2:
This list is just a fraction of the papers that support Cosmic Ray's forcing Earth's climate. What is the threshold for literature supporting cosmic rays to consider them as part of the climate system?
It seems pages like this keep deflecting the data driven debate and not dealing directly with the issue- now CERN and several other respectable climate physics labs have collectively made a statement in 'Nature' about the uncertainty of the models: "This could raise the baseline aerosol state of the pristine pre-industrial atmosphere and so could reduce the estimated anthropogenic radiative forcing from increased aerosol-cloud albedo over the industrial period."
I fear the threshold has been crossed and ignoring the context of the evergrowing literature and data about Cosmic Rays and the potential for a stronger sun for Earth's climate has become "DENIAL" of natural climate change potential that doesn't fit the IPCC dogma and introduces uncertainty in model predictions. Furthormore, this sort of denial could eventually erode public opinion of science and actually fuels the unwaranted denial of GHG influences and anthropogenic climate change.
Cheers,
Aaron S
-
Art Vandelay at 12:01 PM on 30 July 2016Sizzling Midwest Previews a Hotter Future Climate
Preparedness is the key. Cities such as Dubai experience an average maximum temperature well above 40 degrees in summer but becauise the population has adapted there are far less heat related deaths than we might expect.
I'm surprised that many cities don't invest more in heat reduction strategies given the risks and forecasts. Many major cities are currently several degrees ++ warmer than surrounding rural areas, and UHI accounts for up to 2x the increase due to global climate change.
IOW, Even if we find a cure for climate change there remains a serious problem for major cities during summer months.
-
nigelj at 08:37 AM on 30 July 2016Sizzling Midwest Previews a Hotter Future Climate
The heat wave in the mid west is clearly very concerning and very intense. Global warming is expected to significantly increase both numbers of heatwaves, and / or intensity and duration and the science is compelling.
The article seemed to imply numbers of heat waves have not increased in the mid west, but didn't mention intensity and whether theres been an increasing trend measured so far. Does anyone know?
The largest problem is very high temperatures combined with humidity, as its harder to cool down because sweating is reduced. We know atmospheric moisture has increased so it seems inevitable heatwaves will become more uncomfortable, but has any trend been found so far?
-
Paraquat at 14:50 PM on 29 July 2016Analysis: How UK leaving the EU would increase climate targets for others
Brexit or not, I'm very cynical about the EU's CO2 emissions targets. So far, we're seeing all kinds of great claims for progress, but on closer examination, it looks to me like the EU (and others) are just playing a numbers game. One of the favorite tricks is to shut down coal use while ramping up natural gas. While it's true that burning a given amount of coal puts out about twice as much CO2 an energy-equivalent amount of natural gas, this does not account for the fact that a significant percentage of the gas will leak into the atmosphere unburned. This is particularly true if the gas is produced by fracking.
What we call "natural gas" is methane, and it is at least 25 times more potent as a greenhouse gas than CO2. Some estimates claim the greenhouse potential is about 85 times - it depends on how long the methane remains in the atmosphere (it does break down in sunlight after more than a decade, producing CO2 and water). Even with the minimum figure of 25 times, it should be obvious that even a small percentage leak will negate any benefit of switching from coal to natural gas.
As I understand it, the EU gets most of its natural gas via pipeline from Russia, and that this is not produced by fracking. But the greatly increasing demand for natural gas to meet emissions targets is creating pressure for fracking in Western Europe. That would be disastrous. It's not just the well-known problem of water pollution we'd have to worry about, but the fact that an estimated 3 to 9% of fracked natural gas leaks out to the surface through zillions of cracks that are created in the fracking process. There is probably no way to contain that.
When natural gas in brought in from the Middle East on LNG freighters, you avoid fracking but you have another problem - about 40% of the natural gas gets consumed the process of creating LNG (by refrigerating it to −162 °C) and then bring back up to operating temperature so it can be burned. The longer the gas gets stored, the more gets wasted, because of the need to keep it so cold.
There is also the numbers game that I mentioned in a previous post, switching from coal to wood pellets. This has set off an enormous worldwide demand for firewood, which Germany (among others) is importing from North Carolina and Finland.
It's not only the EU that plays this numbers game, but also the USA, as well as several Asian countries such as Japan.
And Taiwan, where I live. Our recently elected new government here in Taiwan is busy trying to shut down the nuclear powerplants, and replace them with something that doesn't emit CO2. So we too will be joining the numbers game, with LNG and firewood as our new "green" technology.
The numbers may look impressive on paper, but the laws of physics will not be fooled. Keep spewing CO2 and methane into the atmosphere, and the world is going to get warmer.
-
Tom Curtis at 08:55 AM on 29 July 2016Climate models are accurately predicting ocean and global warming
DAK4Blizzard @1, ATTP has a post on the study which is more informative. In particular it shows a graph of observations of full depth ocean heat content compared to the CMIP5 models:

As you can see, OHC increased on average, over the period from 1970-1992, although with some periods of decline within that interval.
ATTP also produces a table from the paper showing the total increase in OHC over the intervals:

The change in OHC from 1970-1991 is, evidently, 28.3-13.5 = 14.8 (X 10^22) Joules. We thus have an average gain over the intervals of:
1970-2005 -— 0.49 W/m^2
1970-1991 -— 0.42 W/m^2
1992-2005 -— 0.6 W/m^2
To confuse things further ATTP quotes the paper as indicating changes in OHC of 0.68 x 10^22 Joules/Year from 1970-2005 and 1.22 x10^22 Joules/Year for 1992-2005, which resolve to 0.42 W/m^2 and 0.76 W/m^2 respectively. The later is 0.01 W/m^2 higher than the value given in the article above, but the former is 0.04 W/m^2 smaller. The annual values from the paper likely differ from the values quoted above because, firstly, I assumed a year of 365.25 days, whereas the actual average year lenght will have varied slightly depending on just how many leap years fall within a given interval. (Particularly a factor given that 2000 was not a leap year). Secondly, the annual values will differ because they will be based on the trendline, whose endpoint need not coincide with the terminal points of the actual values (and will not for the 1970-2005 interval, given the large inflection).
I do not know why the article above calculated a different W/m^2 value from the annual Joules/Year values cited in the paper. It may be because they took into account the actual number of leap years involved.
-
tomhuld at 00:51 AM on 29 July 2016Climate models are accurately predicting ocean and global warming
Only somewhat related to the original post, but are there any prospects in the near/medium term of making a direct measurement of the energy imbalance of the earth? In principle there is this nice clean interface at the top of the atmosphere where there is only shortwave radiation coming in from the sun, and only reflected shortwave and emitted thermal radiation from the earth. The imbalance should be about 0.75/340=0.2% so the precision of the two measurements must be better than that. Is this impossible? Or is it just that ignorance is strength (profit)?
-
tomhuld at 00:40 AM on 29 July 2016Climate models are accurately predicting ocean and global warming
@DAK4Blizzard:
As I calculate it, if in the 13 years between 1992 and 2005 the warming is 0.75W/m2 that would be a total warming of 13*0.75*(Sy*AE). For the 35 years between 1970 and 2005 you would have 35*0.46*(Sy*AE). For the 22 years between 1970 and 1992 you would have (35*0.46-13*0.75)*(Sy*AE) or an average warming of (35*0.46-13*0.75)/22=0.29W/m2.
So the earth was warming even then, though at a lower rate.In the above Sy is the number of seconds in a year and AE the area of the earth (the cancel out).
-
DAK4Blizzard at 23:03 PM on 28 July 2016Climate models are accurately predicting ocean and global warming
"Earth has gained 0.46 Watts per square meter between 1970 and 2005. Since, 1992 the rate is higher (0.75 Watts per square meter) and therefore shows an acceleration of the warming."
So would this mean Earth had a net loss of 0.29 Watts per square meter between 1970 and 1992? If so, I wonder which years experienced a significant loss. I would assume sometime in the 1970s. -
Art Vandelay at 10:43 AM on 28 July 2016These are the best arguments from the 3% of climate scientist 'skeptics.' Really.
Technically, any gas that occupies less than 1% volume of the Earth's atmosphere is a trace gas. The statement itself is correct but irrelevant in the context of climate change.
-
Nick Palmer at 03:25 AM on 28 July 2016More CO2 won’t help northern forests or stave off climate change
I think it was Ken Caldeira who modelled the effect on forcing due to increasing boreal forest growth and he found it was actually a positive feedback due to the decreased albedo of greener (=darker) causing more radiation to be absorbed.
-
MA Rodger at 03:11 AM on 28 July 2016These are the best arguments from the 3% of climate scientist 'skeptics.' Really.
BBHY @5 & others.
As you all point out, the "CO2 is a trace gas" myth is entirely purile. Spencer is supposedly a grown-up scientist and, although suffering from deep delusions, he is fully signed up to CO2 as a GHG and the forcing resulting from a doubling of CO2. More, he is also signed up to the temperature rise resulting from such a forcing prior to the operation of feedback mechanisms.
So why does Spencer's 'white paper' expend 10% of its waffle on this childish nonsense proclaiming "CO2 is a trace gas"? I don't believe Spencer has resorted to this specific argument before. Indeed, the question being addressed "Does an increasing CO2 level mean there will be higher global temperatures?" is not even answered but left with a "suffice it to say" comment which makes this section of the White Paper entirely propagandist in nature. Thus I brand it anti-scientific. Such a blatant level of disregard for science appears to me as a new departure for Spencer, assuming Spencer is the true author.
(Unlike some other phrases in the White Paper, that "suffice it to say" phrase is encouraging for Spencer-as-the-author in that the phrase is a Spencerism eg. as per this following Spencer quote describing the temperature of the Earth with zero GHGs, of which "trace gas" CO2 is the major not-so-temperature-dependent GHG. Note this quote also stands to demonstrate how far away this White Paper is from Spencer's usual blather. "If the atmosphere could not intercept (absorb) any of that surface-emitted IR energy, ...Suffice it to say the Earth would probably be too cold for most life as we know it to survive." )
-
Jim Eager at 00:39 AM on 28 July 2016These are the best arguments from the 3% of climate scientist 'skeptics.' Really.
Indeed, I once encountered someone on line who boasted about an AGW denying high school science teacher they knew who demonstrated to his students how little CO2 there is in the atmosphere by having them calculate how small a volume 400 ppmv of the school swimming pool was. I countered by suggesting that he next have his students add 400 ppmv of India ink to the school pool and report back. My suggestion didn't sit too well when I added that his students would then have learned something insightful.
-
jobel at 23:28 PM on 27 July 2016There's no empirical evidence
Thanks everyone for taking the time to answer my question, I really appreciate it!
-
Tom Curtis at 17:20 PM on 27 July 2016These are the best arguments from the 3% of climate scientist 'skeptics.' Really.
BBYH @5, as demonstrated here:
(Source)
-
BBHY at 16:27 PM on 27 July 2016These are the best arguments from the 3% of climate scientist 'skeptics.' Really.
Trace gas: 400 ppm of black ink will turn a 50 gallon aquarium tank of clear water dark.
I think this is an excellent example to contradict the "trace gas" meme. Pure water is transparent to visible light, and ink turns it dark, causing it to absorb visible light. It only takes a tiny bit of ink.
In much the same way the air, mostly nitrogen and oxygen, is transparent to infrared heat energy, but adding CO2 turns it dark to infrared, causing it to absorb infrared heat energy. It only takes a tiny bit of CO2.
This is a very familiar effect to just about eveyone, like adding chocolate syrup to milk to make chocolate milk, or adding coloring to white paint, or dyeing Easter eggs, etc. It's just very easy to understand, adding something dark to something light makes the light thing dark.
-
chriskoz at 13:51 PM on 27 July 2016More CO2 won’t help northern forests or stave off climate change
MichaelK,
I've noticed the same issue. It's a typo.
The very next sentence "with more CO2, the leaves' pores will absorb the gas more efficiently and in the process lose less water", and the later discussion that carbon uptake due to CO2 fertilisation and water retention are directly linked, clarify the confusion around this typo.
-
chriskoz at 13:23 PM on 27 July 20162016 SkS Weekly Digest #30
The comment counter in the Home page is completely busted.
The article immediately preceding this one: "Study links heatwave deaths in London and Paris to climate change" has "-1 comments".
the following article "These are the best arguments from the 3% of climate scientist 'skeptics.' Really." has "7 comments", where in fact when you open it, you find only 4 comments therein.
It'd be nice for an admin (preferably Bob) to look and fix this software glitch.
-
MichaelK at 10:23 AM on 27 July 2016More CO2 won’t help northern forests or stave off climate change
In the paragraph after the second picture, the second sentence states "as we fertilize the plants with carbon in the air, this directly decreases the amount of water the plants are able to retain". Shouldn't 'decreases' be 'increases'?
-
Glenn Tamblyn at 10:12 AM on 27 July 2016Venus doesn't have a runaway greenhouse effect
Mike Hillis
You might also be interested in this chapter by Crisp & Titov about the development of the understanding of thermal balance and radiative trannsfer in the Venusian atmosphere. The book was published in 1997 so more has happened since.
There are a number of extra factors that need to be consered.- Obviously pressure and temperature broadening of the existing absorption lines/bands.
- Also Collision Induced Absorption. This is where molecules that may not otherwise be absorbers, or wavelengths where absorption may not normally occur at all become able to absorb during the transient time when a collision is occurring. For example, Nitrogen (N2) is the major GH gas on Titan due to CIA and Nitrogen/Hydrogen (N2/H2) collisions may have been a contributor to the GH Effect in the Early Earth atmosphere.
- Scattering, which is negligible in the IR in Earth's atmosphere needs to be included when dealing with the much denser Venusian atmosphere.
- Continuum Absorption is another mode of absorption that can occurr where a molecule absorbs over a continuus spectrum. H2O continuum absorption needs to be included when considering H2O vapour on Earth. CO2 also exhibits continuum absorption on Venus. At the time of writing of this book, the understanding of continuum absorption was still developing. It is better understood today.
- Spectral data from the HiTran spectroscopic database doesn't apply for Venus, what is used is the HiTemp database of data for higher temperatures.
Consider Mike. Gases absorb in lines/bands but solids and liquids absorb/emit with continuous spectra. Venus has an atmospheric density nearly 100 times that of Earth. That means it has a density nearly 10% of liquid water. Is the lower Venusian atmosphere a thick gas or a thin liquid? At what density does the transition from discrete band/line absorption to continuous whole-of-spectra absorption occur?
-
meurig at 06:57 AM on 27 July 2016These are the best arguments from the 3% of climate scientist 'skeptics.' Really.
I note that the Regina Leader Post has given Ross McKitrick right of reply to the excellent Michael Mann op ed linked above (McKitrick op ed published on Jul:25 - check the LP website). Needs another reply from someone who is on top of the details, methinks.
-
Rob Painting at 19:27 PM on 26 July 2016Corals are resilient to bleaching
As predicted, coral bleaching is now starting to manifest in the reefs of the western tropical Pacific:
And the outlook for the next few months is grim:
-
Tom Curtis at 13:48 PM on 26 July 2016Corals are resilient to bleaching
Jim Steele @25:
1) "There has been virtually no warming on the GBR"
On the contrary, there clearly has been warming on the Great Barrier Reef:


The resort to a limited time span (1982-2014) when more extensive data is easilly available, or to July temperatures (when the bleaching occurred over the Feb-April interval) clearly represents cherry picking.
What is more, the area of most bleaching experienced record SST over that period:

(Source)
2) Hendy et al (2003) in addition to showing coral die of events in 1782-5 and 1817 also shows LIA GBR temperatures elevated to end 20th century values (figure 2, bottom panel). The LIA was a period of depressed global mean surface temperatures which need not have been represented by depressed temperatures everywhere and were not in the GBR. Including the missing evidence about LIA SST in the GBR shows the evidence that purportedly shows no temperature dependence in fact shows a relationship between die backs and elevated temperatures.
3) It is true that some reefs have recovered rapidly from die backs, but others have not, and some have recovered but only with a massive loss of biodiversity. One of the key factors in rapid recovery is the presence of nearby reefs with appropriate species to recolonize the site of the die back. In mass coral bleachings, the great extent of the bleaching makes that less likely. The greater the extent, therefore, the greater the long term loss in coral viability.
That leaves aside the obvious point that these mass bleachings are occuring at current temperaures. If the target for restraining global warming is met, we can expect an additional 1 C increase in global Mean Surface Temperatures relative to 2015. If not, it will be much more than that. The likely consequence is that we will experience mass coral bleachings not every decade or so, but every few years - meaning the bleachings will occure of reefs not yet recovered from the last bleaching. The consequence will be a long term loss of vitality for coral reefs - and that is considering only the effects of temperature based mass bleachings.
-
Daniel Bailey at 09:59 AM on 26 July 2016Corals are resilient to bleaching
"There has been virtually no warming on the GBR"
Pity that your linked dodgy diagram scrupulously omits the most recent record warmth of 2015 and 2016.
No accident, that.
-
Daniel Bailey at 09:56 AM on 26 July 2016Corals are resilient to bleaching
"please provide a link to Hendy 2003"
Likely this one:
Openly available copy, here.
Very dated and taken out of context. Typical denier protocol and MO.
-
Daniel Bailey at 09:48 AM on 26 July 2016Corals are resilient to bleaching
"what is the source of that linked graphic"
Tineye traces it to Reddit, and from there to denier nee compulsive liar John McLean's cesspit:
http://mclean.ch/climate/global_warming.htm
http://www.desmogblog.com/directory/vocabulary/2542
-
MA Rodger at 09:06 AM on 26 July 2016These are the best arguments from the 3% of climate scientist 'skeptics.' Really.
A very short way into reading 'A Guide to UnderstandingGlobal Temperature Data' by Roy W. Spencer, Ph.D. I start to question whether Roy Warren Spencer, Ph.D. is truly the author. I know the second page has a paragraph titled "About the Author" which provides a biog for Roy Spencer but, thinks, the rest of this booklet is so well packed with dubious nonsense, should we not ask whether the authorship it ascribes to itself is also dubious nonsense.
My actual reason for questioning the authorship is based simply on a quick reading of a couple of the sections. As such my conclusion is prelimenary. My initial take on this booklet is that, as I have read a lot of drivel from Spencer in the past, the content of this booklet, the narrative, its structure, its argumentation, its vocabulary - it does not read like the same Roy Spencer!!
Anybody else having similar thoughts?
-
scaddenp at 08:27 AM on 26 July 2016Corals are resilient to bleaching
Jim, what is the source of that linked graphic? Is it from actual sea stations in the bleached area or just noaa gridded data over whole GBR.
-
nigelj at 08:10 AM on 26 July 2016These are the best arguments from the 3% of climate scientist 'skeptics.' Really.
Thanks for an interesting article. Clearly Spencers case is without substance, and all those arguments have been debunked.
Spencer has made a mish mash of multiple arguments, including some very silly arguments. This just weakens his case, and makes it look as though he has no one point he really believes in, and is just throwing everything at the issues hoping something will stick, or the sheer volume will create doubt. Therefore his presentation has no credibility to me. It certainly totally fails to get us any nearer the truth about anything.
The only sceptical point that deserves consideration is climate sensitivity, as we are not 100% sure. However the weight of evidence suggests it is moderate to high and the paleo climate evidence is compelling.
The small number of studies suggesting it is low are based on the slower period of warming from roughly 2002 - 2014 and are arguing that this slow rise shows climate sensitivity is low as either the greenhouse effect is not a strong as thought, or is overwhelmed by natural variation.
However this doesn't bear scrutiny. Obviously its dangerous to use a single short time frame, but the argument also falls down because recent science suggests the "pause" was largely because heat has been directed into the oceans, and this is because human aerosols have changed wind patterns. This means the pause is a temporary human caused event, unlikely to repeat, so cannot possibly be used as a basis to argue low climate sensitivity!
Even if climate sensitivity is lower than thought, and global temperatures increase more in the 2-3 degree range rather than 6 degrees, I have an instinct that weather patterns “themselves” and ice sheet stability may be more sensitive to low rates of temperature change than thought.
Consider that we have seen about 1 degree C of temperature increase since 1900, and ice sheets seem to be destabilising faster than early IPCC predictions and heatwaves are also ahead of predictions.
Prev 492 493 494 495 496 497 498 499 500 501 502 503 504 505 506 507 Next


