


 Arguments


Recent Comments
Prev 493 494 495 496 497 498 499 500 501 502 503 504 505 506 507 508 Next
Comments 25001 to 25050:
-
JIm Steele at 05:30 AM on 26 July 2016Corals are resilient to bleaching
The trouble with blaming global warming and bleaching for reef mortaliti
1. There has been virtually no warming on the GBR https://i2.wp.com/mclean.ch/climate/figures_2/GBR_SST_Anom_Jul2014.gif
2. Paleo studies such as Hendy 2003 foudn warmer temperatures durng te LIA
3. Coral bleaching from and El Nino ismuch like a devastating forest fire from a dry La NIna spell. There is a natural recovery and coral often recover from natural bleaching faster than a forest recovers from a nautarl fire.
Northwest Australia's Scott Reef, the upper 3 meters lost 80 to 90% of its living coral and the disappearance of half of the coral genera. Yet researchers observed, “within 12 years coral cover, recruitment, generic diversity, and community structure were again similar to the pre-bleaching years.” A similar long-term study in the Maldives observed a dramatic loss of coral during the 1998 El Nino but by 2013 the reefs also had returned to “pre-bleaching values”. Although a reef’s recovery sometime requires re-colonization by larvae from other reefs, a process known as re-sheeting or Phoenix effect can facilitate a reef’s speedy recovery. Often a small percentage of living “cryptic” polyps with a more resilient symbiotic partnership were embedded within a “dead” colony and survive extreme bleaching. They then multiply and rapidly “re-sheet” the colony’s skeletal remains.
Moderator Response:[GT] Link connected. Please use the link tool on the editing menu to create links. Please provide more than a link to an image. It is unclear from the link what the source of the data is, who generated it etc.
Also please provide a link to Hendy 2003
-
r.pauli at 01:20 AM on 26 July 2016These are the best arguments from the 3% of climate scientist 'skeptics.' Really.
Gavin, thank you again for a cogent summary of a tremendous body of work by thousands of scientists.
Now I only fear the most damaging, it is a yet un-numbered myth: That we can ignore this, or somehow, temporarily disregard facing the problem.
Temporary denial, is still denial - and as psychotherapist Betty Merton said, "Of all the ways to deal with a problem, denial is the least effective."
Like going to the dentist, or seeing a doctor because of a pain that will not go away - now we are in the acting mode. We have the information and we are feeling the pain. Time to alleviate and mitigate.
We have all changed our lightbulbs, now the smallest task is to vote and/or support a candidate who is aware of the problem. Most politicans are sinfully unaware, or misinformed. (just my survey of a few state legislators, someone needs to do a study of this) And we have to tell them to face it. We must exhort everyone - especially leaders and manager - to face the facts and engage with the battle directly.
-
uncletimrob at 19:18 PM on 25 July 20162016 SkS Weekly Digest #30
I love the Science vs Pseudoscience poster! Thank you, thank you. Tim
Moderator Response:[JH] You're welcome.
-
amhartley at 09:43 AM on 25 July 20162016 SkS Weekly Digest #30
Unfortunately, US Sen James Inhofe (R-OK) typifies this cartoon all too well. According to thinkprogress dot org, in 2012, the former head of the Senate Environment Committee told Rachel Maddow
“I was actually on your side of this issue when I was chairing that committee and I first heard about this. I thought it must be true until I found out what it cost.”
-
nigelj at 07:38 AM on 25 July 2016The best strategies to keep bodies cool in a heatwave, according to researchers
The biggest problem is high temperatures combined with high humidity, as the inability for sweat to evaporate means its harder to cool down. I think this creates high risk for heat stroke.
And guess what? We are creating a world with both higher temperatures and more atmospheric moisture. It wont be very nice, particularly in subtropical zones.
-
Tom Curtis at 07:01 AM on 25 July 2016Greenhouse effect has been falsified
Just as an afterthought, one of the peculiarities of fake realities arguments is the insistence that the standard account of mean global insolation is that it represents a model with four cool suns because the formula for global mean insolation, TSI x (1- albedo)/4, contains a division by four. As he states @116:
"The reason is that you use an average flux density that is wrongly calculated by using TOA irradiation/m^2 and divide by four. That gives a surface flux equivalent to 4 small weak suns which heats a m^2 with an intensity of 259W, when the surface cools with a flux of 390W."
The division by four is fully explained as the ratio between the area of a cross section of the Earth defined by the terminators, and the area of the Earth's surface. It requires no further physical explanation ... something so obvious as to not normally require stating.
The peculiar thing, and the reason for this tardy note is that fake realities model requires a division of insolation by two. By his own reasoning, therefore, he is invoking two hot suns in his explanation of insolation. Not only is he glaringly wrong, but also outragiously inconsistent in his reasoning.
-
HK at 03:03 AM on 25 July 2016Venus doesn't have a runaway greenhouse effect
Mike Hillis.
In your posts @143 and @147 you seem to agree with me that adiabatic processes can’t increase the average temperature of an atmosphere, but merely redistribute it.
If the average temperature is determined by absorbed insolation only, one would expect the Venusian atmosphere with its very high albedo to be colder than the Earth’s, right?
So, how do you explain this temperature/pressure profile?Height (km) Temp (C) Pressure (atm.) 0 462 92.10 10 385 47.39 20 306 22.52 30 222 9.851 40 143 3.501 50 75 1.066 60 -10 0.2357 70 -43 0.0369 80 -76 0.00476 90 -104 0.000374 100 -112 0.0000266 Source: Wikipedia
As you see, about 50% of Venus’ atmosphere (by mass) is hotter than 385oC, nearly 90% is hotter than 222oC and nearly 99.9% is warmer than the average of the terrestrial atmosphere (about -20oC).
If you calculate a "mass-weighted" average temperature based on this table the result is about 350oC. This is obviously much, much hotter than can be explained by any redistribution of heat. Something else must be going on!
The graph below gives a clear indication of what this "something" is.
Only a very tiny fraction (~1 %) of the nearly 16,000 watts/m2 of IR radiation from the surface escapes to space. The lower and middle atmosphere is almost completely opaque to IR, so virtually all the heat loss to space happens from the very thin and cold upper layers that are more or less transparent. This raising of the effective emission altitude to colder, less emitting layers of the atmosphere is the very core of the atmospheric greenhouse effect. The lapse rate engine is not an alternative to this, but a crucial part of it, as Glenn Tamblyn has explained.
An isothermal atmosphere (same temperature at all altitudes) full of greenhouse gases couldn’t raise the surface temperature because the effective emission altitude wouldn’t matter for the heat loss to space. And an atmosphere with normal lapse rate but no greenhouse gases would be transparent to IR and thus let the surface radiate directly to space as if the atmosphere wasn’t there at all. -
Glenn Tamblyn at 17:44 PM on 24 July 2016There's no empirical evidence
Jobel
An important point to consider. Changes in CO2 concentration are expected to produce an accumulation of heat. But where the heat is likely to go is the issue. All parts of the system will need to warm - atmosphere, oceans, land surface and Cryosphere (via ice melting). However it takes very different amounts of heat to produce the same temperature change - air is easy, water in the oceans is the big one. So we would expect most of the excess heat to go into the oceans, still only producing a small temperature change.Which is what we are seeing. Around 93% of the heat being added to the system is appearing in the oceans. The rest is divided roughly between heating land, air and ice. So when you only look at what is happening to surface air temperatures you are looking at a very small part of the system. The tail rather than the dog. And since energy can also flow between the various parts of the system, changes in the energy flows between the air and oceans can have sigificant impacts on air temperatures while only impacting the ocean slightly.
So the air temperature record is looking at a small part of the system, thermodynamically, and a rather noisy part.
One site showing changes in ocean heat content is NODC here. The most relevant graph is panel 2 in the animation, 0-2000 meters. Moderator Response:
[Rob P] Image embedded.
-
jobel at 17:25 PM on 24 July 2016There's no empirical evidence
It was a simple question from an interested layman, not critique. From this you extrapolated a non-existing disdain for all climate scientists. I was apparently not humble enough in my question. Anyway, thanks for your reply, it answered my question, kind of.
Moderator Response:[PS] Jobel, you make a fair complaint, and Tom, I think your response was overly, and unnecessarily, aggressive. Sadly, SkS sees far too many fake skeptics, would-be Galileo's and other idiots. Frequent responders are inclined to assume the worst. I would ask everyone to be careful with tone.
-
Glenn Tamblyn at 16:21 PM on 24 July 2016The best strategies to keep bodies cool in a heatwave, according to researchers
William
Steve Sherwood & Matthew Huber had a paper on this several years ago here.
And the limit is 35, although those in poor health may struggle at lower temperatures. -
william5331 at 15:22 PM on 24 July 2016The best strategies to keep bodies cool in a heatwave, according to researchers
Here it is. Apparently it is 35 degrees wet bulb.
"Heat stress reduces labor capacity under climate warming". Geophysical Fluid Dynamics Laboratory. Bibcode:2013NatCC...3..563D. doi:10.1038/nclimate1827
Moderator Response:Link fixed [GT]
-
william5331 at 15:18 PM on 24 July 2016The best strategies to keep bodies cool in a heatwave, according to researchers
Was it above wet bulb 33 or was it 35 degrees C that humans can't survive without some artificial cooling. We lived in the desert for many years but there, despite 40 degrees every day, the wet bulb temperature was down around 20 due to the dryness of the air. How much of the earth is going to become uninhabitable.
-
Tom Curtis at 11:55 AM on 24 July 2016There's no empirical evidence
jobel @310:
"... hope that someone can explain this in layman's terms"
In layman's terms the explanation is simple. Your purported facts are fictions.
The temperature series has not increased in a linear fashion except since shortly after 1960. And over the period 1960-2013 population also increased in a linear fashion (trend: 80.4 million per annum; Standard Deviation: 0.36 million; r squard: 0.999; correlation:0.999). Overall the correlation of population to Global Mean Surface Temperature from 1880-2013 was 0.900 From 1850-2013 it was 0.897, not as good as the 0.902 correlation between CO2 and GMST, but very impressive all the same.

You write that "If the heating of the planet was caused by human action then the smoking gun would be a correlation between number of people and global temperature but there is none." The key problem for you, however, is that there is a correlation - a high correlation - between population and temperature. That means when you asserted the contrary you simply made up a "fact" to suite your argument. It also means that if you actually believed that "If the heating of the planet was caused by human action then the smoking gun would be a correlation between number of people and global temperature", you would not accept that the global warming in the 20th century was anthropogenic.
Of course, by reverting to population rather than CO2 concentration, you are moving further away from the theory you purport to criticize. The warming is not a direct function of human population - but of increased greenhouse gas forcing. And while human population growth has contributed to the growth in emissions, and hence to the growth in temperatures; they do not have a linear relationship. Indeed, per capita emissions have grown approximately quadratically:
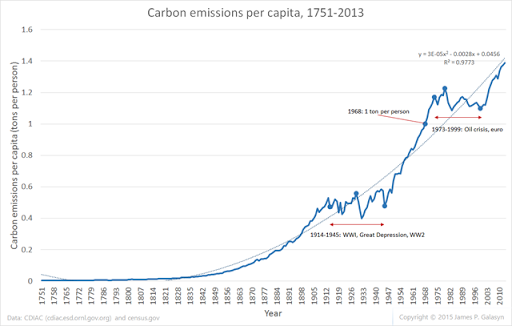
(Source)
Temperature, in the mean time, grows with the forcing, ie the log of concentration. Combined the two effects mean that temperatures will grow at slightly below a linear rate relative to population. To determine the actual rate, however, we would need to compare the growth of all forcings vs population. That becomes a complicated and obscure way to check a theory which stands up to far more obvious and direct tests.
Finally, when you say a theory is refuted "looking at it from a pure logical viewpoint" you are saying the adherents to that view have made fundamental errors of reasoning that are easilly exposed. You are saying of the climate scientists who developed that view that they are either incompetent or dishonest. That hardly seems like a friendly approach to me. If you want friendly, try being a little less arrogant and begin with the assumption that the scientists are competent so that if you think you have a knock down argument against them, you are probably wrong. By all means then ask us to identify where the error lies - but don't assume that the thousands of scientists are wrong because of your bee coaster argument that you have not bothered fact checking.
-
David Smith at 09:10 AM on 24 July 2016After 6 years of working on climate at Harvard, I implore it to show the courage to divest
Divestment. Waste of time. You sell it, someone else buys it.
BTW How do you "fix" climate change? The climate is constantly changig. Always has and always will. There's nothing there for you to fix. You might as well try and fix a bowl of soup.
Moderator Response:[JH] Sloganeering is prohibited by the SkS Comments Policy.
Please note that posting comments here at SkS is a privilege, not a right. This privilege can be rescinded if the posting individual treats adherence to the Comments Policy as optional, rather than the mandatory condition of participating in this online forum.
Please take the time to review the policy and ensure future comments are in full compliance with it. Thanks for your understanding and compliance in this matter.
-
jobel at 08:48 AM on 24 July 2016There's no empirical evidence
Thanks Tom for your answer. No need to be unfriendly, I am just curious. I thought it was obvious from my post that I am a layman, I am looking at it from a pure logical viewpoint. That said, I realize that I did a major error in my first post. I wrote about correlation between CO2 and temperature, but I meant number of people and global temperature levels. Very sorry about that!
So here is the third argument rephrased correctly:
“The planet is accumulating heat”: yes, the diagram clearly shows a drastic increase. But the time period starts 1960, if you instead look from 1880 you get a slightly different picture: the temperature has increased during the 20 century but in more of a linear fashion. If the heating of the planet was caused by human action then the smoking gun would be a correlation between number of people and global temperature but there is none. the number of people are increasing exponentially, global temperature increasing linearly.
Sorry for the error, hope that someone can explain this in layman's terms
-
nigelj at 07:56 AM on 24 July 2016The best strategies to keep bodies cool in a heatwave, according to researchers
Chriskoz at 5
The article made many points. I just posted it to see what people thought. I'm not too sure about pointing a fan at the window, but will experiment to see.
Cold baths are a great idea, but tedious to do all night. This is when the heat really gets to me as I'm a light sleeper at the best of times.
I agree air conditioning has partly got us into the high emissions problem, but we could ideally use solar powered fans and AC, with battery storage at night. Fans and small AC units dont draw much electricity.
-
chriskoz at 22:46 PM on 23 July 2016The best strategies to keep bodies cool in a heatwave, according to researchers
Read the article again, guys. It says that "full body immersion" is the best method in an emergency, but not always available.
No, it is always available in virtualy every modern house: a bathtub. Mine usualy holds cold water in summer (which comes from my rain tank therefore costs nothing) so that I can dunk for a moment as needed - usually every hour of so in record heatwave days. Less water usage and more effective than shower, truely zero-emmision method, unlike fan, or dreadfully emmsion-heavy AC. By overusing AC, the civilisation increased the heatwaves and now people are trying to crank AC more to escape from heatwaves? Where does this nonsense ends?
-
MA Rodger at 21:05 PM on 23 July 2016Venus doesn't have a runaway greenhouse effect
Mike Hills @210.
You still fail to describe the workings of your proposed Lapse Rate Heat Engine. We can see from Glenn Tamblyn's comments @211/212 were he stands on the matter and that it is incompatable with your comments @208/210. Yet #208/210 does not give "any reader who argues for a runaway greenhouse effect on Venus" the slightest inkling of what you propose. In truth, anyone familiar with your input into this comment thread would still struggle, unable to glean whether you still incorporate any or all of the various fallacies you presented variously down this thread. The Unified Theory of Climate from denialists Nikolov & Zeller whose work you cited @121? A katabatic-type mechanism as you proposed @132, which is strangely a mechanism that does the exact opposite of what you appear to propose? The vertical-means-down fallacy you use at, for instance, @158? Or your fallacy that the surface of Venus would require more direct solar heating than it does so as to be hotter than the insulating atmosphere above it, as described say @208? How many of these fallacies do you still use to support your proposed Lapse Rate Heat Engine?
Simply, nobody else truly knows what it is your trying to say. Can you give it your best shot?
-
Glenn Tamblyn at 19:24 PM on 23 July 2016Venus doesn't have a runaway greenhouse effect
Mike Hillis.
First I need to correct a basic mistake you have made wrt albedo. The figure you have cited of 0.65 is the simple albedo for Venus. The simple average of albedo's across a range of wavelengths. However if we were to use this to calculate how much energy is reflected we would get it wrong because energy isn't constant across all wavelengths obviously, it follows the Planck curve. So if for example albedo was higher at wavelengths that have high energy, near the peak of the Planck curve, this would reflect more energy. So we need to take an average that is weighted by energy density. This is called the Bond Albedo.
For Venus the Bond Albedo is 0.9.
Next, the graph you link to isn't what you think it is.
This is data for the Earth, not Venus!The site you have taken it from is here. As you will note, they don't dispute the role of the GH effect on Venus. However, they credit another site as the source, but do not give all the detail. The original source is here. And this is their discussion of that graph."There are two ways that Venus’ atmosphere could be responsible for keeping the surface hot, either individually or in combination. First, Venus’ atmosphere is very dense, and there is a physical relationship known as the ideal gas law that indicates that gases under pressure tend to be hotter. Second, robotic probes have measured Venus’ atmosphere to be about 97% CO2, and we can see from the image above (click for a larger version) that the absorption spectrum for CO2 (AT EARTH TEMPERATURE AND PRESSURE – VENUSIAN TEMPERATURE AND PRESSURE INCREASES THE WIDTH OF THE ABSORPTION BANDS, MAKING CO2 A STRONGER ABSORBER IN VENUS' ATMOSPHERE THAN IN EARTH'S) strongly overlaps the peak emission spectrum of Venus’ surface. The overlap in the spectra suggests that the greenhouse effect of so much CO2 is the cause" (my emphasis)
The graph you show is what CO2 does in Earth's atmosphere, not Venus!
What you are missing in this is referred to in the comment above about temperature and pressure increasing the width of the absorption bands. This factor is profoundly important.
The actual absorption properties of CO2 (and other GH gases) are that they have a large number (10's of 1000's) if distinct spectral absorption lines, spread over what we call bands. In principle each absorption line would be infinitely narrow, they would by exact wavelengths. However quantum mechanics imposes a minimum width restriction, based on Heisenberg's Uncertainty Principle. But this minimum width for each line is still extremely, extremely narrow.A single molecule, at rest, not colliding with anything else would exhibit such idealised narrow absorption lines.
But two other factors produce what is known as 'line broadening'. This smears each line out, potentially till they overlap and possibly overlap over wider ranges of wavelengths.
Temperature Broadening is due to Doppler shift. Molecules aren't at rest, and their velocity distribution means that a proportion of molecules absorb at somewhat differing wavelengths from the primary wavelength of each line since the molecule is moving realtive to the photon it absorbs.
Pressure Broadening is due to the fact that absorption events for a single molecule may occur while that molecule is colliding or in close proximity to another molecule, again shifting the wavelength that the absorption occurs at.
At sea levle pressures hear on Earth Pressure broadening is already significant, as well as Temperature broadening.
When we move to Venus, with much higher temperatures, and pressures vastly higher than Earth, with also hugely higher CO2 proportions, broadening essentially smears absorption across the entire spectrum.
Mike, I think the mistake you are making is projecting what you know about IR absorption from an Earth context and assuming it is similar on Venus.Moderator Response:[JH] I inadvertently deleted a second response by Glenn Tamblyn. Here is the complete text of it.
Next Mike, I didn't 'recant' about the Lapse Rate Engine. It is central to understanding what is going on.
It sems here you haven't fully understood previous comments. You seem to think that the Lapse Rate is a process to be considered instead of the GH Effect.
As I have said before, the Lapse Rate is a part of the GH effect.Let me reiterate.
The GH effect arises as a result of 3 mechanisms.- Radiative Balance requires that the effective emission altitude (EEA), the altitude at which radiation to space, on average, originates from must tend towards the temperature required for the planet to be in radiative balance.
- GH Gases determine the radiative properties of the atmosphere. They determine whatthe effective emission altitude will be.
These two process tend to drive the EEA to the required emission temperature. On Earth this tends to drive the 5 km level towards a temperature of -18 C. And for Venus this tends to drive the 50+ km level to a temperature between -80 and -90 C. - The Lapse Rate Engine then drives other layers above and below the EEA to matching temperatures.
So for example, on Earth Radiative Balance and GH Gases drive the 5 km layer towards -18C. The Lapse Rate engine then drives the surface towards + 15 C and the 10km level towards -41C.
On Venus Radiative Balance and GH Gases drive the 50+ km layer towards -80 - -90 C, and the Lapse Rate drives the surface towards 500 C warmer than this.
The Lapse Rate is a part of the GH Effect!And your comment about incoming solar radiation being absorbed by the atmosphere. So what.
1/3rd of solar energy absorbed on Earth is absorbed in the atmosphere. It doesn't matter whether absorption happens at the surface or in the atmosphere. The air circulation behind the Lapse Rate redistributes energy within the atmosphere, irrespective of whether it was originally absorbed at the surface or in the atmosphere, to produce a temperature gradient, and allow the EEA to tend towards the needed balance temperature.
-
Mike Hillis at 09:47 AM on 23 July 2016Venus doesn't have a runaway greenhouse effect
My post was addressed to any reader who argues for a runaway greenhouse effect on Venus, and yes, the lapse rate heat engine I described was affirmed by Glenn Tamblyn @168, though he recanted later.
Now for some more evidence. Venus spectrum and CO2 bands
Venus is much hotter than Earth, and radiates a Planck curve with much shorter wavelengths. It appears to peak around 3 or 4 microns with the bulk between 2 and 10 microns. The 15 micron band is barely on the chart. The CO2 absorption bands within this Planck curve are very thin, so I ask again, how can you (we, or anybody) call this scenario a greenhouse effect, especially since most of the sun's radiation which Venus absorbs is absorbed by it's atmosphere on the way in?
-
nigelj at 09:01 AM on 23 July 2016The best strategies to keep bodies cool in a heatwave, according to researchers
Tom Curtis at 3
You could well be right. I haven't tried anything in the artcle yet, but thought it was worth posting as something to at least experiment with.
I respond more like your wife, so it might work for me. We all have different metabolisms.
You might end up in separate bedrooms to your wife on those extremely hot nights. Better solution, buy an air conditioner!
-
Tom Curtis at 15:52 PM on 22 July 2016The best strategies to keep bodies cool in a heatwave, according to researchers
nigelj @2, I note that there is a contradiction between the advise on the proper use of a fan, and the proper employment of windows.
In my experience there are at least two human physiological approaches to cooling. I, for example, will sweat copiously at even slightly above normal temperatures or levels of excertion. Provided I am bathed in an air stream of relatively dry air I remain cool at temperatures up to 40 C and even with high levels of excertion. Lacking that air stream, or if the air is humid, I swelter. (I have noticed this pattern in other people who, like me, have grown up in hot arid areas with plenty of drinking water.) In contrast my wife sweats little unless it is very hot. The result is that, unlike me, in typical Brisbane summer weather she does not become drenched (or dehydrated) and her skin continues to cool; but she cannot cope with very hot dry air.
It seems probable to me that the advise from the NZ herald (keep overall room temperature down) would be good for my wife and people like her. For me, however, there is no substitute for a high volume air flow over the skin, so I am best of sitting directly in the air stream from a fan turned to high. Likewise I often benefit more from increased natural air flows from open windows, even if the air is hotter than the still, inside air (within limits).
-
nigelj at 13:42 PM on 22 July 2016The best strategies to keep bodies cool in a heatwave, according to researchers
The following article describes the best way to use a fan. Basically it advises don't just blow air at the sofa or bed. It says point a fan at the open window at night, to blow hot air out of the room, and let the outside air which is sometimes cooler enter the room. Haven't tested the idea as yet.
www.nzherald.co.nz/nz/news/article.cfm?c_id=1&objectid=11590919
The article also says turn rooms into "chilly bins". So keep everything like windows and curtains closed during the day, to conserve cool air from the night before.
-
villabolo at 12:08 PM on 22 July 2016The best strategies to keep bodies cool in a heatwave, according to researchers
When I went through 117 degree Fahrenheit heat a few years ago, I had no airconditioner in my apartment (The electrical wiring couldn't allow for it with all the appliances running.). Fans did not work above 100F even with frozen water bottles in front of them.
It was that temperature outside and inside my apartment. Other than walking naked around the house I decided to improvise. I put a small bucket of water into a freezer overnight and the next morning I removed it. It was not frozen except for a thin crust of ice on top. The water was ice cold though.
I dunked a tight fitting T-shirt into the water; wrung out the excess water; then I put the T-shirt on.
I shivered from the cold for less than 3 seconds and immediately after that I felt an intense sense of relief. I was still naked from the waist down but there was no one to notice.
At night, with the temperature no lower than the mid 90s F I dunked a bed sheet into that same water and had a small fan blowing besides my bed. That's the only time that a fan can provide relief.
I would also suggest keeping your hair short and have a beanie for your head also soaked in ice water.
-
HK at 22:23 PM on 21 July 2016Greenhouse effect has been falsified
Tom @153:
Your numbers seem to agree pretty well with the energy flow chart in @137.My reason for focusing on the IR part of the spectrum is the fact that an IR emissivity lower than 1 reduces the heat loss to space in a way that resembles the greenhouse effect. In a discussion on another blog (I don’t remember where) someone suggested that the 33 K warming of Earth was caused by a surface emissivity of about 0.61-0.62. If that was true, a surface temp of 288 K would be needed to emit 240 w/m2.
But of course, measurements of many types of terrain show that the IR emissivity in general is > 0.95, so that doesn’t contribute much to the 33 K warming of Earth. -
MA Rodger at 10:11 AM on 21 July 2016Greenhouse effect has been falsified
Fake Reality Man @150.
You must forgive me but I still find your abilities to comprehend the reality of climate as laughable as the turtle & elephants supporting your fat Earth. Okay, I am sure that engaging with you is something that will be entirely unfruitful but, hey-ho, I enjoy a good laugh.
I shall ignore the nonsense you spout @148, although that said, you do not make demarkation of nonsense entirely easy.
@149 there is in some respects more definition in your assertions You tell us "that 1000W is the density that has to irradiate 1m^2, 1/2 the sphere. To get 288K surface mean temperature?" This appears to be your obsession. I agree that a thing with a temperature of X degrees Kelvin indeed does require heating by an energy flux of Y from "somewhere" that will allow it to emit the black body emissions (or roughly that amount) commenserate with the thing's temperature of X degrees Kelvin. The problem is that you are very very selective about the "somewhere". You seem to be unable to consider certain alternative "somewheres" such that you proclaim that the only source of heat for the surface of planet Earth has to be the sun. Yet, thinks you, if I put on an overcoat, I do not in any way don an energy source. It is nothing but inert cloth yet I am evidently warmer for the coat. The reason for my feeling less frosty is of course due to insulation. It is a concept you and your fake reality seem unable to grasp.
@149 you insist "that 1000W is the density that has to irradiate 1m^2, 1/2 the sphere. To get 288K surface mean temperature?" Assuming my abacus has not lost too many beads, a thing with a temperature of 288K, would be radiating 390Wm^-2. Further, I appreciate you see temperature & external heating as being the definng physics but, as I say, you are being very selective in what you consider to be allowable external heating sources for the surface of planet Earth.
And when you state @150m that 1,000W/m^-2 has to be the peak value, I have to ask "Why?" What are you saying? The average has to be roughly (from all sources) 390Wm^-2. That could be 3,900Wm^-2 for 10% of the time, couldn't it? What is this obsession with 1,000Wm^-2?
You say "We never heat anything up with a colder gas." Indeed. But if the gas is still cool (hey, Fonz gas!!) but warmer than it was, what then is the result? It is no longer a "colder gas!!!!" Even the elephants & turtle know it!! It is warmer."It us a hotter gas!!!!!"
The only one here left denying that such cool gas is "hotter" is our chum fake reality. So chum, defend your position. I look forward to you reply. As I said, I enjoy a good laugh.
Moderator Response:[DB] Note that, being unable to adhere to the Comments Policy, "fake reality" has recused themselves from further participation in this venue.
Doubtless the physics of the Naetherworld will be more pliable for them.
-
Tom Curtis at 08:19 AM on 21 July 2016Greenhouse effect has been falsified
HK @144, the surface emissivity shown is for IR wavelengths, whereas most of the incoming solar energy is in visible wavelengths. Based on Stephens et al (2015), all sky albedo is 0.293. From the listed flux values, clear sky albedo is 0.154 and clear sky albedo - atmospheric contribution is 0.059. Because of potential overlaps, that means the mean absorptivity of the Earth's surface, weighted for solar energy is between 0.846 and 0.941. 0.9 would be a reasonable approximate estimate. Overall the surface is better at reflecting visible radiation than IR radiation.
false reality's position clearly commits him to the view that the Earth absorbs more energy from the Sun than would be absorbed by a disc perendicular to the Sun placed very near the Earth such that the umbra of the disc at 1 AU equaled the Earth's radius (ie, the Earth was in the full shadow of the disc, and the full shadow of the disc and the full shadow of the Earth coincided). That view clearly contradicts conservation of energy. As false reality refuses to even entertain that fact, there is no more point in discussing the issue with him then there would be in discussing philosophy with a rattlesnake.
-
fake reality at 07:24 AM on 21 July 2016Greenhouse effect has been falsified
Checking if I am banned yet, last post dissappeared without a trace
Moderator Response:[JH] If you were banned, you would not be able to post the above comment.
-
fake reality at 07:05 AM on 21 July 2016Greenhouse effect has been falsified
@144 HK
Why is it so hard to understand the following implications of the points above?
1 + 2: Each square metre of Earth receives 1361 / 4 ≈ 340 w/m2 of solar radiation before the albedo is accounted for.It´s not. But that is the wrong question. The right question is:
What is wrong with your model if it doesn´t replicate reality?
You are assuming that your model is right and reality does something that we can´t describe with radiation laws, so you fill out the gap with stuff you find in the atmosphere, like water, co2, photons etc.
Not one of them is known to have an intensifying effect on a body of higher temperature, but that is exactly what you use it for.
It´s not only your sun with intensity of 240W that is a problem, although it´s really funny, it´s the combination of darkness and stuff that we know as cooling elements in relation to hotter bodies, that is absolutely hilarious. I think you could not make a model that is more dysfunctional, it must be unique as leading theory, in it´s total lack of accuracy.
What you should ask is also: how can anyone buy into that when we know that a sun that doesn´t shine, at ~240K=240W, is not in any way a correct model of reality.
3. When albedo is accounted for, this number drops to 340 x (1-0.3) ≈ 240 w/m2. That radiation flux is what you get from a blackbody at 255 K, or 33 K colder than the real Earth.Why not try to build another model that is more correct. Am Iright in that the number 340 is K?
If so, I think you need to use εσ340^4, where ε=0.7
When you average before albedo(which can be ignored at this stage), you change the outcome pretty much. There is a very big difference between 1370W and 340W but not temperature K.
When we know that we need 1000W/m^2 to get 288K, why not use it?
Because you know better than earth, that radiates at the wrong temperature, and it must be the icecold atmosphere that heats the surface, the sun cannot be enough?
Stupid drunk earth, radiating all wrong so we have to fix it with icecold gas.
4. Even though the Earth is not a blackbody in the IR part of the spectrum, it’s sufficiently close to make the impact from emissivity very minor. An average surface emissivity of 0.96 would only raise the temperature by about 2.5 K on an airless Earth with evenly distributed insolation. The cooling impact from the uneven insolation is probably somewhat larger than that (it’s about 70 K at the Moon’s equator!), so there is at least 33 K of warming that has to be explained in other ways than by insolation, albedo or emissivity.But insulation has certain features that must be in place. One that is very important is som boundary surface or surfacelike structure opposing the warm body, placed at the outer limit of the insulated area, and works by conduction, so that it has to get heated and radiate at it´s own temperature. The gradient between the boundary and body should be as small as possible to get good insulation. Like the opposite of earth´s steep gradients that makes sure that all altitudes above surface is colder, much colder.
Nope, thats not insulation. No blanket, no sleeping bag and no sweater. Just cold air and 3K-vacuum of space.
The 33C is entirely a number that is the ugly child of your model with darkness and cold when the sun heats earth at 260W/m^2
-
fake reality at 06:25 AM on 21 July 2016Greenhouse effect has been falsified
@ 137 MA Rodger
The concept of "4 weak suns" was introduced by fake reality @116 and he has since often restated it but entirely failed to explain it. I would suggest that the "4 weak suns" (which as KR points out @133 is conceptually a bit of a dog's breakfast if taken literally) is probably better described as a "quarter strength sun" and is being applied to, for instance, the usual account of the planet's energy balance, as per IPCC AR5 fig 2-11.
I think I have answered how you get the model with 4 suns. Do you still wonder how?
I´ll tell you again, because this is the funniest part in GH-theory.
Whenever you divide something in 4 parts you get equal parts of the initial number if you do it like you do.
Only way to get rid of those fractions is to multiply by four. That your result is written like W/m^2 doesn´t mean that the other 3 parts dissapeared. Pay attention to the fact that you are trying to describe reality correct. If you divide the sun by 4, then you have 4 suns. They irradiate 4m^2.
The waveform of the radiated intensity has a peak value, a probable maximum, that corresponds to peak intensity/wavelength. I say that everything points at 1000W being the right value for maximum intensity/wavelength for mainly two reasons.
First, it is what is needed for mean 288K. Second, it is a commonly observed number all over the earth. That is enough to use it until something better shows up. Your 4 suns @240W is not what I define as "better". On top of that, the fudge you apply is the most contradicting set of functions that is the opposite of observations.
We never heat anything up with a colder gas. We never use water in large amounts when we describe what heats a gas like air. Never do we pour water at something hot expecting it to get hotter.
All of greenhouse-functions cannot be confirmed in experimental trials. There is no information that shows co2 as a heating agent in any system in heat transfer. It only gets heated and never gets hot enough to heat something.
You are showing spectral distribution of intensity from the atmosphere that has the clear sign of co2 acting in IR-wavelengths around 15micrometer and claiming that it shows how much it´s heating.
But the spectrum shows that co2 lowers spectral intensity efficiently in peak wavelengths OLR. That is nothing but a sign of lower temperature and since it radiates equal in all directions, we know that radiation downwards must be at the same intensity.
In the midst of all that you use emissivity as a tool for explaining an increase in temperature, when the definition of emissivity is that it equals absorption and always is <1.
No matter what the explanation is, using emissivity as the thing that increase intensity is the opposite of what kirchoff´s law is about.
-
Tom Curtis at 06:16 AM on 21 July 2016Other planets are warming
Jacksan @43 is the latest in a long line of people endorsing the Anthing But CO2 (ABC) theory of climate change. In support of his theory, he has at least the good grace to provide links.
The first link is to a 2011 article by Lawrence E Joseph in the Huffington Post. In that article, he repeatedly refers to his book, Apocalypse 2012: An Investigation into Civilization’s End, which is described in his bio:
"Apocalypse 2012 is a personal exploration of the strange coincidence that both ancient Mayan prophecy and contemporary solar physics indicate that the year 2012 will be uniquely pivotal, perhaps catastrophic. His interest in 2012 began while serving as chairman of a New Mexico research firm that holds the global patent for an ultra-high temperature plasma furnace designed to disintegrate deadly chemical and nuclear wastes. His research led him to work with scientists, shamans, and philosophers on five continents."
He has consulted the Mayan Calander and shamens. Who could doubt the scientific credibility of that?
In his Huffington Post article, Joseph cites M Opher as claiming that "that the Solar System has begun to pass into" a magnetic field that is "at least twice as strong as had previously been predicted". The later, at least, is true. Opher et al (2009) find that "We find that the field strength in the local interstellar medium is 3.7–5.5 μG", which is more than twice the previous estimates mentioned in the paper of 1.8-2.5 μG. (For comparison, the Earth's magnetic field at the surface is 250,000 to 650,000 μG, and the Interplanatery Magnetic Field at Earth's orbit is 10 μG.) Unfortunately for Joseph (and Jacksan), Opher et al make no claim that "the Solar System has begun to pass into" the magnetic field. Rather they say:
"This difference could be a result of turbulence in the interstellar medium which could cause the local magnetic field direction to differ dramatically from that of the large-scale field. This difference could also be a consequence of local distortion of the magnetic field in the solar vicinity. Within 100–200 pc from the Sun, the interstellar gas is embedded in the Local Bubble, a huge region of hot tenuous plasma which contains small, cooler, denser clouds such as the Local Interstellar Cloud (also called the Local Cloud), which envelops the Sun. Collisions between the Local Cloud and other cooler, denser clouds in the Local Bubble, such as the G cloud, could cause such a distortion. Theories for the creation of the Local Cloud suggest that the magnetic fields are strong, of the order of 4–7 mG."
That the Local Bubble lies within 100-200 parsecs (326 to 652 light years) if the Sun clearly indicates the scales of "local" effects, and precludes any possibility that "the Solar System has begun to pass into" a magnetic field that has in fact been surrounding the solar system for tens of thousands of years. It therefore cannot be the basis of recent changes in Earth's climate by itself.
Not to worry, for Jacksan has additional evidence. Specifically an article in New Scientist, from which he finds several quotes. He finds room to quote "The fact that the wind is shifting over the span of mere decades means that the interior of the cloud is either unusually turbulent, or that the solar system is a mere 1000 or so years away from punching its way out" but not to quote the actual scale of the shift:
"But then NASA’s Interstellar Boundary Explorer (IBEX), launched in 2009, revealed something odd: the wind has changed direction. IBEX has been directly sampling neutral helium atoms from the interstellar cloud as part of its mission to map the boundary between the solar system and the rest of the galaxy. Its readings show that, instead of Earth passing through the sun’s helium tail in late November, the peak came about a week late, in early December. That indicates a change in wind direction of about 6 degrees in only 40 years."
(My emphasis)
That change of 0.15o per year in wind direction represents a delay of about 3.7 hours per year in the arrival of the peak. It is astonishingly rapid in astronomical terms, but in terms of earthly impacts it is glacial.
Other parts of the article that Jacksan did not feel like quoting:
"“If you took a handful of the air we breathe on Earth and stretched it out to the nearest star, it would have the same density as this cloud,” says Priscilla Frisch of the University of Chicago."
And more crucially:
"The edge of the solar system is roughly defined by the heliosphere, a giant magnetic bubble blown by charged particles streaming from the sun. This bubble shields Earth from much of the interstellar wind, so a change in the wind’s direction will have little effect here on the ground."
(My emphasis)
Pretty much says it all, really - but not if you want to follow the great Mayan Calander catastrophist of 2012 in reading catastrophic outcomes from interstellar tea leaves.
Finally, Jacksan draws our attention to a 2006 NASA prediction of a huge solar storm in 2012. Of course, that prediction was not based on considerations of interstellar media. More importantly, it predicted that "The next sunspot cycle will be 30% to 50% stronger than the previous one", that "the first sunspots of the next cycle appear in late 2006 or 2007--and Solar Max to be underway by 2010 or 2011", and that the next solar maximum "could produce a burst of solar activity second only to the historic Solar Max of 1958". Unfortunately, the prediction was completely wrong. The next solar cycle did not start until 2010, the maximum until 2014, and it was the lowest maximum since 1958 (and probably since the early 20th century):

Jacksan recommends that we should "Question everything and always do your own research and take your own conclusions." Unfortunately, genuinely doing your own research requires years gaining the relevant skills and detailed background knowledge to not make a fool of yourself. Not recognizing that, and pulling quotes out of context, assuming predictions are valid when they are falsified and generally questioning everything except your own conclusions as Jacksan has done is a recipe for pseudoscience, conspiracy theories and nonsense. I heartilly recommend to as many people as possible that they do do the hard yards to become genuine scientists. But pretending 15 hours or less of internet searches (or even a year of internet searches) is some kind of substitute for those hard yards is arrogant nonsense.
We don't think backyard quarterbacks are ready for the superbowl because they've tossed a ball around for a day or two. Why then are we so arrogant as to think there is not an elite in science as there is in sport and that cobbled together misquotation is a genuine substitute for scientific expertise?
-
fake reality at 05:54 AM on 21 July 2016Greenhouse effect has been falsified
@145
"(B) The Wikipedia Sunlight page does also say in the Summary "...the direct sunlight at Earth's surface when the Sun is at the zenith is about 1050 W/m2, but the total amount (direct and indirect from the atmosphere) hitting the ground is around 1120 W/m2.[3]" The Wikipedia reference [3] is to a commercial company's archived archived web entitled "Introduction to Solar Radiation" (the company is into optics) and it does quote the values but provides no source. The 1120W/m^2 value would be correct if there was very little albedo from the atmosphere and zero ground albedo. But sadly for fake reality, the value again is only correct for a clear sky with the sun slap overhead."
I can only interpret your words as:
You do not think that it is likely that we get irradiation @ fluxdensity of 1000W in enough amount, you think that such a number is likely to be wrong?
And you say that knowing that 1000W is the density that has to irradiate 1m^2, 1/2 the sphere. To get 288K surface mean temperature?
Please tell me were you get the extra energy. You must have a hidden stash somewhere.
-
fake reality at 05:36 AM on 21 July 2016Greenhouse effect has been falsified
@144 MA Rodger
Are you saying that there never is 1000W/m-2 in any place?
Are you saying that the required 1000W for 288K is not all coming from the sun?
That is a bit spooky.
Are you saying that a model of earth in darkness is our best available alternative?
Sorry, can't do that.
Read carefully:
To have a medan surface tempel of 288K, as a greybody, it is necessary to have 1000W/m-2 fluxdensity of solar irradiation on 1/2 surface area. It is not like you can have different opinions about that,that is a fact. Irradiation has to be 1000W/m-2. Or are you saying that there is heat transfer at night from air to grund.
In that case, what T(air) and T(surface) dö you use?
-
fake reality at 05:09 AM on 21 July 2016Greenhouse effect has been falsified
@144
"2. The formula for the area of a sphere is 4 π r2, while the formula for the area of a circle is π r2. Therefore a sphere (the real 3-D Earth) has four times larger area than a circle (the 2-D cross section of the Earth) with the same radius."
I made clear that I know why you do it like that.
And I made clear that it doesn´t matter what you think is right, when we can see that without doubt that you have a defect model.Your result gets us the useless information about earth in darkness heated @240W.
We know when that state appeared in your calculations, and we know what value it should have been /m^2. That is all the reason we need to come to the conclusion that it is not the right model of earth. Apart from the dividing by four.
I don´t disagree with you about the method in general, but here it is an apparent problem.
"3. The Earth’s Bond albedo is close to 0.3 or 30 % according to any comreliable sources."I think that can wait as we dont have a working agreed model yet. I refuse to use a 240W sun as it is dark. And with that darkness we don´t have to worry about albedo.
First we focus on blackbody radiation and all that it applies to. Because that is a complete model for radiating bodys and heat transfer.
Instead of relying on your dysfunctional model and making reality the culprit, when you get the wrong results.
"4. Tehe Earth’s surface emissivity depends on the type of terrain, but is most ly between 0.95 and 0.99, at least for wavelengths between 4 and 16 mitcrons."I wouldn´t waste your time if that would be news to me. Should I ignore that you don´t mention that SW is from 500nm< and up. With 53%-ish of the energy in IR. Mostly SW-IR(NIR). the flux density is a minor fraction in Far-IR compared to NIR and it is all thermal radiation. We get a lot more input power than output.
Are you saying that we should use a value for all wavelengths that is 0.9?
We know what is going in and out. That is emissivity.
-
MA Rodger at 04:45 AM on 21 July 2016Greenhouse effect has been falsified
Moderator Response @142.
There was within the fake reality comments deleted for sloganeering two references that presented that 1,000Wm^-2 figure although not to its actual measurement. These references don't actually change much as they do not provide the support fake reality requires but for completeness they are as follows:-
(A) A web page from The Institute of Agriculture - University of Tennessee. This presents a calculation for the total sunlight energy that would hit Texas (so including ground albedo energy) under clear skies and with the sun slap overhead. The page states "At the Earth's surface, the energy density is reduced to approximately 1,000 W/m2 for a surface perpendicular to the Sun's rays at sea level on a clear day[1]." Texan sunlight is almost "perpendicular" at the summer solstice so the situation is not impossible. The reference cited in the quote [1] is actually to the second reference (B) that fake reality cited, the Wikipedia Sunlight page but this reference is to a different paragraph (Composition & Power) that itself mentions no power quantities but does in turn reference Buffo et al (1972). "Direct Solar Radiation On Various Slopes From 0 To 60 Degrees North Latitude". This is a 75 page PDF full of tables, charts and graphs presenting values of Direct Solar Radiation. A quick scan appears to show the highest value given to be 848 cal/sq cm/day which I make = 411 W/m^2.
(B) The Wikipedia Sunlight page does also say in the Summary "...the direct sunlight at Earth's surface when the Sun is at the zenith is about 1050 W/m2, but the total amount (direct and indirect from the atmosphere) hitting the ground is around 1120 W/m2.[3]" The Wikipedia reference [3] is to a commercial company's archived archived web entitled "Introduction to Solar Radiation" (the company is into optics) and it does quote the values but provides no source. The 1120W/m^2 value would be correct if there was very little albedo from the atmosphere and zero ground albedo. But sadly for fake reality, the value again is only correct for a clear sky with the sun slap overhead.
-
fake reality at 04:39 AM on 21 July 2016Greenhouse effect has been falsified
JH] If you do not document the source(s) your oft-repeated assertions, they will be deemed to be sloganeering/excessive repetition and will be summarily deleted.
The sources are there, blackbody radiation and heat transfer mainly.
Seriously? You need sources?
Repetition of what, that dividing by 4 generates an impossible situation that has nothing to do with earth.
Even if you don´t agree, the 240W/m^2 alone or as a quartet, is a model of earth in darkness since the only sourc(es) available are way below in energy that it´s not even a source that is close to getting red hot.
Why do you use a model that is so totally different from reality?
It´s staring you in the face, you can check for yourself. No one is forcing you to use a number of 240W when measurements show 1000W/m^2. It´s fine to abandone a model when it doesn´t perform.The reason for wrong results is clear, you are calculating earth in a universe that is dark and cold. 240W/is dark and cold. And obviously not the right value.
Where should we look for bugs? In reality?
Or in your model?
Definately not in my model.
-
HK at 04:28 AM on 21 July 2016Greenhouse effect has been falsified
Fake reality:
1. The TSI has been measured directly by satellites. This updated graph clearly shows that the average value over the last four solar cycles has been close to 1361 w/m2.

2. The formula for the area of a sphere is 4 π r2, while the formula for the area of a circle is π r2. Therefore a sphere (the real 3-D Earth) has four times larger area than a circle (the 2-D cross section of the Earth) with the same radius.
3. The Earth’s Bond albedo is close to 0.3 or 30 % according to any reliable sources.
4. The Earth’s surface emissivity depends on the type of terrain, but is mostly between 0.95 and 0.99, at least for wavelengths between 4 and 16 microns.
Why is it so hard to understand the following implications of the points above?
1 + 2: Each square metre of Earth receives 1361 / 4 ≈ 340 w/m2 of solar radiation before the albedo is accounted for.
3. When albedo is accounted for, this number drops to 340 x (1-0.3) ≈ 240 w/m2. That radiation flux is what you get from a blackbody at 255 K, or 33 K colder than the real Earth.
4. Even though the Earth is not a blackbody in the IR part of the spectrum, it’s sufficiently close to make the impact from emissivity very minor. An average surface emissivity of 0.96 would only raise the temperature by about 2.5 K on an airless Earth with evenly distributed insolation. The cooling impact from the uneven insolation is probably somewhat larger than that (it’s about 70 K at the Moon’s equator!), so there is at least 33 K of warming that has to be explained in other ways than by insolation, albedo or emissivity. -
fake reality at 03:51 AM on 21 July 2016Greenhouse effect has been falsified
1 kW is like peak wavelengths, it is the peak intensity, apart from fluktuations in both ways the spectral maximum density of an equivalent blackbody radiator. That is why 1000W is the right value to use.
A peak is the mean power intensity corresponding to peak wavelenghts in the radiationfield, in this case it´s solar irradiation at a fraction of the source, equivalent to a blackbody @394-ishW/m^2. Toa 1370W/m^2, at sea level 1000W/m^2
Can you read in that darkness surrounding your 4 suns. With all that darkness radiating its cold photons burning your skin.
It is not surprising that the model use heat transfer from cold to hot based on quantum functions of the photon. Since cold is the only thing that exists.
But quantum functions is never used in such big scale to describe energy flow and especifically not in heat transfer. We can say with confidence that there is no transfer of heat to the warm surface from the cold atmosphere. We alsp know with certainty that a cold body that absorbs heat from the radiationfield is the only place where there is rising temperature when it is an open system.
-
Jacksan at 02:47 AM on 21 July 2016Other planets are warming
In response to comment no.29, user MagickWizard, who totally nailed it, I will complement your question and give some NASA evidence, in order to get the skeptics think more profoundly about this subject and conect some dots.
Yes, the Solar System is not in a fixed space! We are NEVER in the same place in the Universe! And YES, we are passing through a very high energy interstellar cloud, that NASA knew of since the 70's(!) but the general public only knew about around 2009(!!!) - "On Christmas Eve, 2009, the startling hypothesis that our Solar System, the Sun and all its planets, are moving into a potentially dangerous and destabilizing interstellar energy cloud, was resoundingly sustained." - (source: http://www.huffingtonpost.com/lawrence-e-joseph/passing-into-the-energy-c_b_405086.html )
Various quotes from the same source previously mentioned: "“We have discovered a strong magnetic field just outside the solar system. This magnetic field holds the interstellar energy cloud together and solves the long-standing puzzle of how it can exist at all,” says Opher, a NASA Heliophysics Guest Investigator from George Mason University. " ;
"In fact, most scientists had either minimized the possible significance of the interstellar energy cloud or dismissed the whole notion of its existence altogether. But not Dr. Alexei Dmitriev, the esteemed Russian space physicist";
"Dmitriev’s conclusions, based on his team’s analysis of Voyager data, that the atmospheres of Jupiter, Saturn, Uranus and Neptune are inexplicably excited — immense storms, mammoth eruptions, plasma arcs jetting from the planets’ surface to their moons. He reasoned that this turbulence is caused by an external injection of energy into the planets’ atmospheres: to wit, an interstellar energy cloud which the leading edge of the Solar System has now entered."
For more information about this intense high energy cloud and how it's being studied, check NASA own page http://www.nasa.gov/mission_pages/ibex/news/ribbon-explained.html
I also have another source, please check it out: https://www.newscientist.com/article/dn24153-solar-system-caught-in-an-interstellar-tempest/
highlights: "The solar system is travelling through much stormier skies than we thought, and might even be about to pop out of the huge gas cloud we have been gliding through for at least 45,000 years.";"The fact that the wind is shifting over the span of mere decades means that the interior of the cloud is either unusually turbulent, or that the solar system is a mere 1000 or so years away from punching its way out."
"“While there had been hints that something was changing in the environment of the sun, when we finally put all the historical data together it became clear that one can make a strong scientific statement that this change has actually occurred,” says Frisch."
And if you want to read Dr. Dmitriev research translated, please read it here: http://aetherforce.com/planetophysical-state-of-the-earth-and-life-by-dr-alexey-n-dmitriev/
What makes this even more interesting is the fact that in 2006, NASA warned people of an impending huge solar storm for the next solar maximum (2012)... How can they make this prediction 6 years in advance?! Interesting, like they knew something was going to make this solar cycle very abnormal and something is messing up with our Sun - http://www.nasa.gov/vision/universe/solarsystem/10mar_stormwarning.html But, for this, we can only speculate...
Question everything and always do your own research and take your own conclusions.
-
fake reality at 02:30 AM on 21 July 2016Greenhouse effect has been falsified
A correct treatment of fluxdensity is handling it like instantaneous constant flow anytime anywher of a thousand Watts/m^2, because that is what it takes to keep earth going at the surface.
Do not involve time, which you do when you make an average over day and night, because that is not irradiation/heating, use the surface as is. Use 1m^2 and 1kW. It is the right way to do it.
Moderator Response:[JH] If you do not document the source(s) your oft-repeated assertions, they will be deemed to be sloganeering/excessive repetition and will be summarily deleted.
-
fake reality at 02:19 AM on 21 July 2016Greenhouse effect has been falsified
@142 HK
Finally, somone else in here that is not deleting my comments.
"Fake reality’s claim about 1000 watts is pure nonsense. That value is only reached near the middle of the day at low latitudes. No places on Earth have an insolation nearly that high on a daily or annual basis."
Tell me what is wrong with a thousand watts. That is about the amount that has to be the value of irradiation from the sun to get a T of 288K, if you don´t claim that earth is a blackbody. You´re not doing that, do you?
I get the heat from the sun only in my calculations, because I don´t see any other source of heat. That means that the sun has to provide a value of 1000W/m^2 for a T of 288K.
Where do you get the extra heat that fix up your model?
"Figure 1 below shows the annual insolation on top of the atmosphere and on the surface (but before albedo is accounted for). Note that even the tropics only receive a little more than 400 w/m2 on top of the atmosphere (yellow), and no places get more than about 300 w/m2 on the surface."
So, you say that the sun provides only enough energy to heat the surface (400W/m^2)/2m^2=243K, in the tropics. That is even less than 255K.
Or do you mean that it gets an even 400W/m^2 in the tropics, that is irradiation worth of minimum 800W under ideal blackbody conditions.
In that case, you agree with me(almost). I never said an even 1000W si needed, as maxwell-boltzmann-distribution points to the fact that density is question of probability for different states of excitance in matter at a certain flux. I think that makes room for a level of radiation at 1000W/m^2 that not has to be even to deliver a mean probability for the excitance needed for a mean 288K.
It is the result of the probability of excitance levels in fluxdensity of 364^4K transformed in a mean excitance overall with the probable levels of excitance @288^4K.
That is not the same as evenly irradiation level of 1000W. Although I must point out that it is needed, the surface T of 288K needs to get irradiation at the surface of overall mean value 1000W/m^2 when just calculating straight. So that is the appropriate amount to use.
Unless you know of another heat source.
"Figure 2 shows the daily insolation over the year for 4 latitudes. Again, no places get near 1000 w/m2 at any time of the year, but it’s interesting to note that the North Pole gets more than any other place in the NH near summer solstice."
So you say that a T of 288K does not need irradiation at 1000W/m^2, and that we get extra energy from some flux elsewhere than the sun?
-
John Hartz at 00:30 AM on 21 July 2016Greenhouse effect has been falsified
[JH] Moderator's Comment
Fake Realitys posts of today have been deleted for multiple violations of the Comments Policy including argumentative sloganeering, excessive repetition, and moderation complaints.
Fake Reality is about to relinquish his/her privilege of posting comments on this site.
-
HK at 23:28 PM on 20 July 2016Greenhouse effect has been falsified
Fake reality’s claim about 1000 watts is pure nonsense. That value is only reached near the middle of the day at low latitudes. No places on Earth have an insolation nearly that high on a daily or annual basis.
Figure 1 below shows the annual insolation on top of the atmosphere and on the surface (but before albedo is accounted for). Note that even the tropics only receive a little more than 400 w/m2 on top of the atmosphere (yellow), and no places get more than about 300 w/m2 on the surface.
Figure 2 shows the daily insolation over the year for 4 latitudes. Again, no places get near 1000 w/m2 at any time of the year, but it’s interesting to note that the North Pole gets more than any other place in the NH near summer solstice.
Figure 1

Figure 2

If the Earth’s rotational axis was perpendicular to the ecliptic (no seasons) the average insolation could easily be calculated by multiplying the TSI (1361 w/m2) by the sine of the latitude and divide by π. This gives 433 w/m2 at the equator, but the seasons make this value slightly smaller, while higher latitudes get more.
-
fake reality at 19:30 PM on 20 July 2016Greenhouse effect has been falsified
@132
"[PS] This 4 suns stuff is a nonsense argument. You are simply demostrating that you dont understand the geometry."
Ok. Then I wonder what happens when dividing by 4?
If we ignore pi and that you are using the sphere geometry, because that just makes things worse, and see what happens when we divide 1370W/m^2 by 4. =we get four equal parts of ~350W/m^2.
How is that not a model with four equal suns that emits 350W/m^2 each?
"Please actually take the time to understand what is going on. Open a text book. Tom's reply is best, including actual data."
I think you all should read up on maxwell-boltzmann distribution instead. Then you will realize why having (1370W/m^2)4pi*r^2 as a model for the density of flux, is not the right way to do it.
Draw a simple graph with two axis of W/m^2 and temperature in K. See how the curve is developing with increased temperature, then you see why 260W/m^2 is not a good way to calculate flux density..
"Explain this data in light of your understanding. If you cant get your head around basics, then you have no hope sensible discussion of science."
You show me what is wring with my model instead. I have shown what is wtong with yours. My model works, yours doesn´t.
"Any further rubbish about multiple suns will be deleted."
So everyone must ignore that (1370W/m^2)/4pi*r^2 is equal to 4*260/m^2
You cannot be serious.
"There is a simple online reference here for solar calculations."
That also give a value of 260W/m^2?
I say thank you, but no thanks.
I don´t think that (w/m^2)/4pi*r^2 is describing a correct irradiation of any radiating body in the universe. I will use real values instead of trying make reality fit the model with fudgefactors like GH-effect.
I know that I´m pushing it and you soon will kick me out, since I am making it very uncomfortable for you. But I beg you to stay scientific and address my statements. Where am I wrong?
Everyone knows that dividing by four gives four equal parts. Do you still stand by your statement that dividing TSI by 4, is not equal to a model of irradiation from 4 suns in 4m^2 @ 260W.
I am very excited(!) about reading your answer.
Moderator Response:[PS] Repetition, sloganeering and moderation complaints.
You only get banned by not abiding with the comment policy. At moment, what you are demonstrating is that you dont understand the real model; put up a misunderstanding of what is being postulated instead and then unsurprizingly finding your caricature unsatisfactory. You are simply annoying everyone by not making any effort to really understand and grandstanding instead. You arent "making us unconfortable" with supposed "new truth" just disbelief at your astonishing hubris.
-
MA Rodger at 19:16 PM on 20 July 2016Greenhouse effect has been falsified
The concept of "4 weak suns" was introduced by fake reality @116 and he has since often restated it but entirely failed to explain it. I would suggest that the "4 weak suns" (which as KR points out @133 is conceptually a bit of a dog's breakfast if taken literally) is probably better described as a "quarter strength sun" and is being applied to, for instance, the usual account of the planet's energy balance, as per IPCC AR5 fig 2-11.

The irradiance here is given as an average over the sphere of 340Wm^-2 rather than the average over the disc of 1,360Wm^-2. Anybody with a normal grip on reality would understand that a sphere with a surface area of 4πr2 will on average receive a quarter the irradiance projected onto the disc of the planet which has a surface area of just πr2 .
As for the "measured" 1,000Wm^-2, my thought is that fake reality is grasping at a rough value that has not been "measured" but rather is inferred through measurement. The Earth's irradiance is measured at 1,360Wm^-2 normal to the flux (& onto the disc). The albedo is also measured and that averages to about 0.30 irradiance. Thus in NASA's words (they being the measurers) "the remaining 240 watts per square meter is absorbed by land, ocean, and atmosphere," that being 240Wm^-2(spherical) = 4 x 240 = 960Wm^-2(discal), or roughly 1,000Wm^-2.
I could continue attempting to make sense of nonsense (and without even a mention of elephants stood on the back of the turtle) but if fake reality is unable to begin to explain his crazy assertions or assist in their explanation; if he cannot I am with Tom Curtis @128 and would "suggest that the comments policies on sloganeering and excessive repetition be scrupulously applied."
-
Paul Pukite at 18:40 PM on 20 July 2016Greenhouse effect has been falsified
I don't know why you are dealing with Fake Reality's word salad argument. Let him post and just put a strikethrough html tag through his arguments. Every teaching assistant has learned that it is impossible to educate those that do not wish to be educated.
-
Tom Curtis at 16:52 PM on 20 July 2016Greenhouse effect has been falsified
KR @133, the point is not irrelevant because while one or four weaker suns makes no difference to total energy input, it makes a significant difference to negentropy and also to day/night temperature cycles. That is why fake reality's claim that we are using a four weak sun model is fake climate science to go with his fake reality.
-
Tom Curtis at 16:46 PM on 20 July 2016Greenhouse effect has been falsified
fake reality @130:
"So lets go with the idea of 4 weak suns, that seems like the right thing."
Let's not. The four weak sun model is not used by anybody in climate science. It is only used by you in the false supposition that four weak suns would yield uniform illumination, but climate science does not use a model of uniform illumination of the Earth, and neither do I. The only think climate science points out is that the integral of energy from the Sun on the Earth equals the sum of the energy recieved at each unit area, which in turn equals the mean recieved across all areas multiplied by the total area by definition of 'mean'. It follows that as the average across all areas is the TOA insolation divided by four and times (1-albedo) (by virtue of geometry), that is the mean that should be used. End of story.
As an aside, here is the illumination pattern on a sphere using four distant light sources to illustate the point that it does not result in uniform illumination:

(Source)
"You can not find any made up numbers in my calculation."
What I can find and have demonstrated is that the 1000 W/m2 uniform illumination on the day side of the planet that you assume in your calculation is a fiction contradicted by geometry and also be actual measures of hourly insolation at various locations (specifically, Lafayette, Indiana; Singapore). It is also shown to be false for Albaquerque.
It's OK. I get that you do not understand that you have been thoroughly refuted; and that for reasons of ideology you cannot admit error. Unfortunately for you, so does everybody else reading this discussion.
-
KR at 13:27 PM on 20 July 2016Greenhouse effect has been falsified
fake reality - One sun, four suns at 1/4 the intensity (assuming identical spectra), it makes no difference to the daily average of 240 W/m^2 insolation as the Earth rotates. Your harping on that _irrelevant_ point indicates, IMO some basic lacks in high school geometry.
If you can work past that, perhaps then we could discuss other issues, such as your misunderstandings of the interactions of the lapse rate and effective emission altitudes. But, quite frankly, I'm not optimistic in that regard...
-
fake reality at 12:36 PM on 20 July 2016Greenhouse effect has been falsified
@131
Which parts about the difference in number of suns is mostly flawed. That you have four and I have one? Or opposite?
Moderator Response:[PS] This 4 suns stuff is a nonsense argument. You are simply demostrating that you dont understand the geometry. Please actually take the time to understand what is going on. Open a text book. Tom's reply is best, including actual data.
Explain this data in light of your understanding. If you cant get your head around basics, then you have no hope sensible discussion of science.
Any further rubbish about multiple suns will be deleted.
There is a simple online reference here for solar calculations.
Prev 493 494 495 496 497 498 499 500 501 502 503 504 505 506 507 508 Next


