


 Arguments


Recent Comments
Prev 500 501 502 503 504 505 506 507 508 509 510 511 512 513 514 515 Next
Comments 25351 to 25400:
-
There is no consensus
Wikipedia has a pretty up to date listing of scientific organizations and their position on the climate here. They show four non-commital groups (all geologists, for some reason), with none expressing a group opinion contrary to the current consensus.
-
barry1487 at 03:03 AM on 27 January 2016Record hot 2015 gave us a glimpse at the future of global warming
OPOF,Hence my interest in this site and other groups focused on better understanding what is going on and determined to get the required changes of understanding and action to happen sooner rather than later
Our interests are similar. Communicating the science honestly and effectively is important. If there were a blog dedicated to effectice communication of science I would probably participate. Obviously, it is of considerable interest for the authors here.(Actually, I think a semi-open forum to discuss effective communication of (climate) science is a good idea. Maybe there is one somewhere. The topic comes up on the blogs fairly regularly, including here, but doesn't survive long. How about a dedicated thread, mods?)
-
scttharding5 at 03:01 AM on 27 January 2016There is no consensus
I just had a quick question. I know that all but two scientific bodies with national or international standing have endorsed anthropogenic climate change. The two that have not take no official position. I was just wondering exactly how many scientific organizations have national or international standing. Is it hundreds of organizations or scores of organizations?
-
tmbtx at 02:41 AM on 27 January 2016Tracking the 2°C Limit - December 2015
Ok I found the article he wrote.
-
tmbtx at 02:32 AM on 27 January 2016Tracking the 2°C Limit - December 2015
I'm failing to find the source because I'm too sick to look at the moment, but what about Mann's point that we're really already at 1.2 above? That the baseline being used here is still too recent?
-
barry1487 at 02:29 AM on 27 January 2016Record hot 2015 gave us a glimpse at the future of global warming
Eclectic, OPOF,
I wasn't asking a question, I was commenting on the flow of argument in the article - on the juxtaposition of two points and selective reference to uncertainty. Perhaps it would have been clearer if I'd referred to the "OP." I'm sure Dana would have got it. I was unsure if feedback is welcome but went ahead anyway.
Unless the readership is only the two climateball tribes, choosing what to omit when summarizing science is a tricky business, especially if you want to be persuasive. As I'm fairly well-informed about climate science and a critical reader, I mentioned two things that jarred for me. Others will not notice or care.
-
John Hartz at 01:39 AM on 27 January 2016Record hot 2015 gave us a glimpse at the future of global warming
Recommended supplementary reading...
Analysis: How much did El Niño boost global temperature in 2015? by Roz Pidcock, Carbon Brief, jan 26, 2016
-
bozzza at 01:35 AM on 27 January 2016The Quest for CCS
Sharon,
You are talking about living in an extreme environment and the truth is to live there you are being subsidised by others. This is all tax payers money and the externalities involved have not, it would seem, been fully realised until now.
The world turns.
-
One Planet Only Forever at 01:19 AM on 27 January 2016Record hot 2015 gave us a glimpse at the future of global warming
Barry,
I mistated my last sentence. Should have been "... more rapid than during ENSO Neutral or El Nino conditions."
Also, though I started following this subject because of Civil Engineering interest and concern, my concern has grown regarding the mechanisms and motivations behind the denial of the developing better understanding and the changes required (my MBA training). Hence my interest in this site and other groups focused on better understanding what is going on and determined to get the required changes of understanding and action to happen sooner rather than later (it will never be too late, but sooner is clearly better).
-
One Planet Only Forever at 01:10 AM on 27 January 2016Record hot 2015 gave us a glimpse at the future of global warming
barry,
Though your question is unclear I will offer something that may relate to your concern.
There is a connection between the surface temperature and ocean heat content.
I am not a climate scientist. I am science trained as an Civil Engineer with an MBA, but I have only followed this topic out of the need to better understand the potential impacts on my designs such as location specific maximum snow load, maximum wind speed, maximum rain intensity, maximum wave height.
Tha said, my understanding is:
When ocean circulation conditions produce a larger than average cool surface, such as a La Nina condition in the Tropical Pacific or similar conditions in other ocean areas, the interaction of the ocean surface with the atmosphere will keep more heat energy in the ocean than a neutral condition.
When ocean circulation conditions produce a larger than average warm surface, such as a El Nino, the interaction of the ocean surface with the atmosphere will keep less heat energy in the ocean than a neutral condition.
Some of the heat energy from the ocean surface interaction stays in circulation in the lower atmosphere (below the elevation of the typical 25,000 to 50,000 foot elevation zone of satellite temperature evaluation) and spreads around the planet temporarily affecting the global average surface temperature (cooler than neutral state during La Nina, warmer than neutral state during El Nino).
Another thing is going on. The ocean will take a very long time to reach a new heat content balance state with the recently rapidly warming global surface. And when conditions are more predominantly La Nina than El Nino (as they had been since 1998) the global surface temperature would not appear to be warming relative to the spike of 1998. However, during those times the rate of ocean heat capture would be even more rapid than during ENSO Neutral or La Nina conditions.
-
POJO at 22:58 PM on 26 January 201610 Indicators of a Human Fingerprint on Climate Change
Tom Curtis @ 78
Huh,
It is a very broad history i have shown there. Here is the last 35 years.
Keen to hear an explanation for this apparent diversion.

-
Eclectic at 22:49 PM on 26 January 2016The Quest for CCS
SharonK @ #50 , you make a good point about the need for home-heating with oil, for those who are not connected to the electric grid [powered by hydro, nuclear, wind, or solar . . . solar presumably from somewhere south of lattitude 60. ] .
There is no immediate problem in shortage of available oil, for 20 years or more ( I expect) . In the longer run, as coal & petroleum oil are phased out, it would be a logical political decision for households such as yours to receive "privileged priority supply" of petroleum oil, during the tail-end of the phase-out process. Eventually, there would be a reasonable-sized industry producing organic-origin liquid fuel [jetfuel & diesel] for planes and ships and heavy machinery . . . and presumably a fraction of that supply would be allocatable to "special needs" households which are off the grid.
I am unclear about the number of households which it would be uneconomic to supply grid electricity to, in future years. Clearly there are many isolated houses and small townships, to which that might apply, at present. My guess is that they would total a very small fraction of the world's liquid fuel for transport industry requirements. But I am happy to be corrected, and I would be grateful if you could give an authoritative or reasonably close estimate of house numbers which are currently "off-grid" and requiring oil-type heating by absolute necessity (not choice) .
-
Eclectic at 22:03 PM on 26 January 2016Record hot 2015 gave us a glimpse at the future of global warming
barry @ #7 . . . sorry, Barry, but your comments are so brief that they don't make much sense on their own.
Please expand your comments, so that I and other readers can understand whatever the message is (which you wish to convey) .
Also, in passing, perhaps you could mention how you think the "lower trop" [as you quote it] has relevance to the so-called surface air temperatures at ground level & sea-surface level. ( I confess that ) my initial impression is that the "lower trop" as measured by satellites, gives a mass-weighted average roughly at 3 kilometres above ground level ~ something which, like stratosphere temperatures, is interesting yet of tenuous connection with what's happening on land and sea, where we inhabit the planet.
-
Sharon Krushel at 19:15 PM on 26 January 2016The Quest for CCS
Andy, I've been reading about these CCS projects, and I find this to be a very thought-provoking article. I'm new to this website. I have a few comments.
I must say, I was a bit put off by the caption under the photo: "Shell boasting about its government-funded Quest CCS project..." The word "boasting" in this context indicates a bias and prepares the reader for a negative spin on the topic rather than scientific objectivity.
You might want to check with some experts in the industry, but I don't know that it's necessary to cause people to question the safety of CCS. I've heard something about layers of salt that work to "heal" cracks and holes and keep the CO2 from escaping. Also, they do check the integrity of cavities before using them. I'm not saying there are no dangers; I don't know that. I'm just saying there is more relevant information available.
Personally, I believe CCS is one of many important innovations in our transition to renewables.
If we "keep the oil in the ground" any time soon, I and my family, and millions of others in the north, will freeze to death before we have a chance to starve to death. We don't have enough sunshine in the winter to heat our homes with solar panels unless we rebuild our homes with huge heat sinks and have a backup heat source. We built a very energy-efficient home in 1983 and used a wood stove, with a gas furnace for back up, but we had to travel far to get the wood for the stove, and the slow burning of wood releases dioxin into the atmosphere. It also caused problems with my asthma.
A nuclear power plant was proposed for our area, but environmentalists objected. A hydro dam is proposed, but environmentalists are objecting as it would flood some very important agricultural land.
Even with global warming, it gets down to -40 Celcius where I live. We're hoping people further south won't divest from and turn off the fossil fuel companies until we figure out how to survive without them. Until that time, I think CCS is a very good thing.
Thank you for your commitment to addressing the problem of global warming and for your work and research and willingness to respond to comments.
-
denisaf at 16:59 PM on 26 January 2016The Quest for CCS
These discussions relate to a form of biomimicry, the attempt to use technological systems to emulate what natural systems do. This is not possible for two reasons. Firstly, the technological systems are expected to do at a high rate what nature does at a very slow rate. Secondly, the materials used in natural processes often recycle while most materials used in technological systems cannot be recycled. The hydrocarbons in oil and gas is one prominent example of the inability to recycle. So innovative technological systems can only provide a very weak temporary response to the devastation caused by the installed technological systesm of industrialization.
-
Tom Curtis at 16:05 PM on 26 January 201610 Indicators of a Human Fingerprint on Climate Change
POJO @78, if the night times warm faster, then the difference between daytime and nighttime temperatures will decrease, as is shown on your graph. Consequently I am not sure what your point is.
-
barry1487 at 15:39 PM on 26 January 2016Record hot 2015 gave us a glimpse at the future of global warming
Talking about ocean heat content directly after saying the temps where we live (surface) are more relevant is a small hiccup in the flow of the argument. Neglecting uncertainty in OHC directly after mentioning that factor to favour the surface records over lower trop also popped out.
-
POJO at 14:21 PM on 26 January 201610 Indicators of a Human Fingerprint on Climate Change
Forgot to add that data is Crutem4 sourced via KNMI
-
POJO at 14:20 PM on 26 January 201610 Indicators of a Human Fingerprint on Climate Change
Just wondering why in point 7 it states
"If an increased greenhouse effect is causing global warming, we should see certain patterns in the warming. For example, the planet should warm faster at night than during the day. This is indeed being observed (Braganza 2004, Alexander 2006)."
Is not observed in the CRUTEM4 DTR data.

-
Tom Curtis at 10:30 AM on 26 January 2016Record hot 2015 gave us a glimpse at the future of global warming
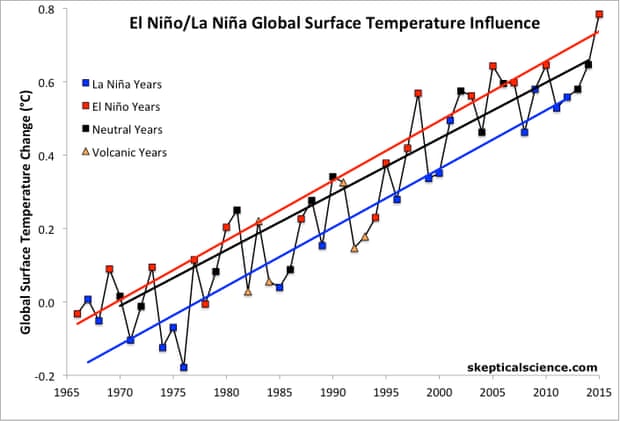
I should note that in answering Steve L's question @5, I answered by own question @4. The trends are by my calculation:
La Nina years:0.156 C/decade
Neutral years: 0.152 C/decade
El Nino years: 0.163 C/decade
-
Tom Curtis at 10:06 AM on 26 January 2016Record hot 2015 gave us a glimpse at the future of global warming
Steve L @2&3, calculating the trends for La Nina, Neutral and El Nino years seperately on the BEST LOTI (Sea Ice as Air Temperature) since 1966, it turns out that 2015 will be the average temperature for an El Nino year in 2018, for a neutral year in 2023 and for a La Nina year 2028. The precise year estimated will depend on the temperature set used, and the ENSO index used (I just used the classification in Dana's graph below).
That means that within three years, we can expect the average El Nino to match 2015 temperatures, with El Nino's occuring every three to four years on average. Put another way, by 2028 we can expect to have experienced five or so years approximately as hot as 2015, and likely one or two hotter.
-
Tom Curtis at 09:17 AM on 26 January 2016Record hot 2015 gave us a glimpse at the future of global warming
Dana, in the extended section of the OP, it is claimed that El Nino, neutral and La Nina years all have the same trend of 0.16 C per decade. That claim is belied by the graph, however, were the slope of the trend line for neutral years is visibly less than that of El Nino and La Nina years, and where pixel count shows the trend lines for El Nino and La Nina years draw apart, showing the El Nino trend to be greater than the La Nina Trend. Could you note the exact values.
-
Steve L at 07:05 AM on 26 January 2016Record hot 2015 gave us a glimpse at the future of global warming
Ah, I see by following the link to the Guardian, Trenberth indicates it would be 15 years before we could expect to frequently see anomalies such as observed in 2015.
-
Steve L at 07:02 AM on 26 January 2016Record hot 2015 gave us a glimpse at the future of global warming
I like the quote at the end from Trenberth. Perhaps the best way to communicate this result, besides saying it's really warm and this warmth is having big negative consequences, is to predict when this global surface anomaly will become "normal". That is, how many years is this year's anomaly ahead of the long-term trend (say, 1970-2014 ... don't want to cherry-pick a biased end date). At about 0.15 C increase per decade, and 2015 being about 0.14 C warmer than 2010 and 2014 (with 2014 being approximately on the trendline?), then we should expect 2015 temperatures to be "normal" by about 2025.
Is this correct? On average we should expect to see years like 2014-2016 by 2024-2026? I think this also says that it would be abnormal to see another year so warm before then, and it would be really weird to see several more than one of them. Perhaps this kind of messaging to the media would help to avoid wasteful discussion of a new hiatus in the next decade.
-
william5331 at 04:41 AM on 26 January 2016A Rough Guide to Rainfall, Run-off and Rivers
Read "Three Against the Wilderness" by Eric Collier; especially toward the end when he describes the flood of 1948 in the Frazer River catchment. This flood descimated the Frazer delta, raising water levels to the first and sometimes the second floor of houses on the delta. It was caused by a huge snow pack and a very late spring that when it happened came on rapidly went straight into summer. The only creek along the Frazer Valley that didn't contribute to this flood was Meldrum Creek. Eric had, along with a very forward looking conservation officer, R.M. Robertson, reintroduced the beaver to the catchment some years earlier and they multiplied and restored the environment and with it, it's water storing capacity. If beavers has been spread throughout the Frazer catchment, the flood never would have happened.
-
william5331 at 04:06 AM on 26 January 2016Record hot 2015 gave us a glimpse at the future of global warming
So because of this El Nino created jump in the temperature,we can expect another "hiatus" starting in 2017. The climate change deniers can have fun with this one. They can now start their graphs in 2015 and at least for a few years explain to us how the climate is cooling. That is, unless we have passed one or more of the tipping points and 2017 turns out to be warmer than 2016.
-
Tom Curtis at 00:40 AM on 26 January 2016Wigley and Santer Find the IPCC is too Conservative on AGW
Jsalch @27, the principles used in climate models are not assumptions. Climate models are reiterative calculations of causal relationships relevant to global climate. Thus one part of a model will handle conservation of momentum, requireing that momentum be conserved when are masses move from one cell to another in a model. Another will handle the effects of Boyle's law with regard to vertical motion of gas under convection. Another part again will handle radiative absorption and emission. All of these causal laws that go into a climate model are very well confirmed physical theories from both laboratory and non-laboratory observations.
There is a problem in that the smallest practical resolution of climate models is much larger the resolution of laws applied. Consequently to make the physics work, parameters need to be introduced to handle the approximation. These parameters, however, are justified in detail based on the causal laws - and refined by comparison with real world observations.
The range of physical laws, and hence causal relationships embodied in GCMs ranges through radiative physics, newtonian dynamics, gas laws, laws of evaporation, and on into laws of chemistry.
The output of the models are then tested against both much simpler models and against global observations of a very large number of variables (not just Global Mean Surface Temperature). All GCM's produce earthlike climates with an astonishing verrisimilitude - which is astounding given the number of physical laws embodied in their operation, and the courseness of their grid. Combined they also produce quite accurate predictions of physical values in absolute terms. They are made to look like the perform much worse than they do because values are expressed in relative terms because doing so highlights discrepancies - the better to be able to test and improve the models.
When you summarize this process as "if [assumptions from climatology models], then humans are the problem", it merely demonstrates your complete ignorance on how climate is actually modelled in GCMs.
Curiously, however, there is one class of 'scientist' who only ever present simple, statistical models of climate - ie, whose output could be described as "if assumptions, then results". That class are the AGW deniers. They are so confident in their theories that they never dare model them based on detailed representations of physical law.
-
Tom Dayton at 00:22 AM on 26 January 2016Wigley and Santer Find the IPCC is too Conservative on AGW
Jsalch, basic physics was used to project human-caused warming many decades before it was possible to observe it. See the post How Do We Know More CO2 Is Causing Warming? Also read The History of Climate Science, and for details Spencer Weart's The Discovery of Global Warming. Watch Pierrehumbert's AGU lecture describing successful predictions, or at least read a summary of his talk. And Climate Change Cluedo.
-
Jsalch at 23:07 PM on 25 January 2016Wigley and Santer Find the IPCC is too Conservative on AGW
It appears that the whole point of causality versus correlation is skipped. I am a statistician, not a physicist or chemist. However, most of these types of paper seem to read ... "if [assumptions from climatology models], then humans are the problem."
I'd like to see where causality is addressed.
-
Forrest at 21:22 PM on 25 January 2016Thorough, not thoroughly fabricated: The truth about global temperature data
Cruz is trained as a lawyer - his job is to advocate for his client, without regard for the truth. If he gets a murderer acquitted, he has done his job regardless of whether the suspect was actually guilty or not. Sometimes lawyers don't do well in a field like science, where the goal is to find out the truth, regardless of any potential impacts it may have.
I find it amusing when deniers insist that the raw data are more accurate than the corrected data, while also insisting that raw data are inaccurate and must be adjusted for urban heat island effect, poor station siting, and other factors that might conceivably raise the temperature.
-
Eclectic at 17:56 PM on 25 January 2016Thorough, not thoroughly fabricated: The truth about global temperature data
Scaddenp @ 9 , please . . . do tell the dreadful secret of your cognitive bias ~ unless it involves something actually illegal, of course !
No, I don't think we can excuz Cruz, on the grounds that no-one else is absolutely perfect. There are shades of grey in many concepts, to be sure . . . and especially on the spectrum between undoubted sanity and undoubted insanity. Slightly off-white and almost pitch-black, may well be on the same spectrum ~ but there is a huge qualitative difference, that amounts to a recognizable difference of category.
Digby's possibility (1) is something that features on a dimension at right angles to the sane/insane spectrum. And that is: the moral dimension. There we are treading more on the territory of religion & ethics.
But you could equally argue that "cognitive bias" [ possibility No. 2 ] also has a moral dimension of good/evil, when the bias is extreme.
-
scaddenp at 12:40 PM on 25 January 2016Thorough, not thoroughly fabricated: The truth about global temperature data
(2) is simply cognitive bias and frankly I think everyone suffers from it to a certain degree (I do). Fortunately, the scientific method as it has evolved, and when practised as a community gives us a way to break from the biases. Getting someone to accept a proposition that is conflict with their values and/or identity is close to mission impossible.
-
Digby Scorgie at 12:23 PM on 25 January 2016Thorough, not thoroughly fabricated: The truth about global temperature data
Glenn
Is Cruz declining to tell all of the truth or is he just denying the truth?
There are two possibilities:
(1) Cruz knows that global warming is a threat.
(2) Cruz does not want to know that global warming is a threat.
What do you call someone of the first type — psychopath?
What do you call someone of the second type — a victim of a special form of insanity?
-
amhartley at 11:51 AM on 25 January 2016Thorough, not thoroughly fabricated: The truth about global temperature data
Scott Johnson, I don't know if you're reading the comments here, but this post is just about the most helpful one I've ever seen at SkS. And that's saying a great deal.
-
hank at 08:23 AM on 25 January 2016IPCC overestimate temperature rise
Needs an update for 2015, if anyone has access to do that.
-
MEJ at 21:48 PM on 24 January 2016Ted Cruz fact check: which temperature data are the best?
Thanks Tom for the more detailed info on the lag time between the satellites detecting the heat. Makes sense. It will be interesting to see the RSS data move up as it begins to detect it. Off course we pretty much walk about the surface of the Earth so surface temperature is what we live in not the troposphere 7 -10 klms above us. Thanks for all the info. Best regards MEJ
-
Tom Curtis at 20:23 PM on 24 January 2016Ted Cruz fact check: which temperature data are the best?
MEJ @23 & 24, arguably the largest El Nino since 1950 occurred in 1997/98. As a result the GISTEMP Land Ocean Temperature Index set a new global temperature record of 0.47 C, a record it broke in the following year with a 0.63 C annual average (both relative to a 1951-1980 baseline). In contrast, RSS TLT only showed a distinctly non-record 0.1 C, only just shading 1987 and beaten by 1995. It then went on to a massive 0.55 C in 1998. (Records relative to a 1979-1998 baseline.) The reason for the very low temperature in 1997 relative to 1998 was the lag.
2015 is also arguably the largest El Nino since 1950, although I think it is smaller than 1997/98. Of course, there is a strong possibility that it will be referred to as the 1015/16 El Nino in the future. Regardless, the most comparable temperature from the 97/98 El Nino with which to compare the 2015 TLT temperature is 1997, which was not a record year. Well, at 0.36 C, 2015 isn't a record in the TLT series either, but it is a lot warmer than 1997, and is only beaten by 1998 and the 2010 El Nino year. Further, the most recent montly temperature (0.54 C) is very comparable to the 1998 annual record (0.55 C) and very close to most months in the 97/98 ENSO period as well.
So, the reason why 2015 is not a record in the TLT temperature series, while it is a record in the surface temperature series is very clearly the greater lag in response to ENSO events in the mid troposphere. The leaders of the denialist pushback against the extraordinarly warmth in the surface record for 2015 know this very well.
-
MEJ at 19:38 PM on 24 January 2016Ted Cruz fact check: which temperature data are the best?
Thanks Moderator. I read it till my brain hurts. I read the post and watched the video. Cool to see Dessler and Mears interviewed. I also read the link John Hartz posted above which also included UAH satellite data. Thanks for that John.
Oh, okay I have not understood SURFACE TEMPERATURE as opposed to Lower Troposphere Temperature (TLT). Two different places. One we don't even live in. That is my mistake. Add in the inaccuracies inherent in satellite data in the video. Also as I presume you are alluding to there was a 'lag time' for the heat from El Nino in 1998 being detected in the TLT by satellite readings.Ok got it
Thanks
MEJ -
MEJ at 17:56 PM on 24 January 2016Ted Cruz fact check: which temperature data are the best?
Hi everyone. If I could get some help understanding why the Remote Sensing Systems (RSS) satellite data does not indicate 2015 as the hottest year on record.

The graph seems to show quite plainly 1998 as the hottest year and even 2010 as being hotter than 2015.
If I was to look at this graph I would say (possibly wrongly) 1998 far outsrips 2015 as the hottest year on record.
Thanks for any help understanding this.
Regards
MEJModerator Response:[PS] Um, that is largely what the article is about. Did you read it? 2015 is the hottest surface temperature on record (we dont live in the TLT). I would also watch this space if lag in response to El Nino in troposphere follows previous pattern.
-
Glenn Tamblyn at 16:58 PM on 24 January 2016Thorough, not thoroughly fabricated: The truth about global temperature data
DS
"Not fully sharing your knowledge and understanding with others can give you a competitive advantage. "
One of the creative ways to lie"Tell the Truth. But Not All Of It"
Robert Heinlein
And yeah, Susan Cain's book is awesome. -
Digby Scorgie at 13:27 PM on 24 January 2016Thorough, not thoroughly fabricated: The truth about global temperature data
They are not climate skeptics. They are climate-change deniers.
-
tcflood at 10:50 AM on 24 January 2016It warmed before 1940 when CO2 was low
@35 - 37 in response to 34
Thanks for the references and comments. Now I can give a more informed answer to the question.
-
Tom Curtis at 09:43 AM on 24 January 2016It warmed before 1940 when CO2 was low
Kevin C @36, this is the relevant image from the article to which you link:

The right hand series of panels is ERSST v4-v3b. In it land temperatures are cancelled out and consequently not shown. The middle column of panels (ERSSTv4) however, does show land temperatures. In particular, it shows a very warm Chile plus Argentina, more or less adjacent to the unusually warm south east Pacific temperatures. Further, checking the 250 km resolution, meteorological station only map for the 44-45 period at Gistemp shows an off shore (island) meteological station of the coast of Namibia or Angola which again shows unusual warmth. Finally, the west coast of Australia is warm, although not exceptionally so in the 250 km resolution GISTemp map. These correlations to the warm pools in the SH in that period suggest those warm pools are not, or at least not entirely artifacts.
-
Kevin C at 09:06 AM on 24 January 2016It warmed before 1940 when CO2 was low
tcflood: The narrow WWII peak itself is almost certainly spurious. It only shows up in the SST data, and particularly in ERSSTv4. There are very substantial known changes in SST measurement practices during WWII, which are hard to correct for completely. Hansen discusses it here.
-
One Planet Only Forever at 07:47 AM on 24 January 2016Thorough, not thoroughly fabricated: The truth about global temperature data
nigelj,
More important points about the Satellite record are:
- The satellite temperature values do not measure the surface temperature.
- The result of increased CO2 concentrations is understood to be a more significant warming of the surface, under all the CO2, than the warming that would occur up in the atmosphere.
- The satellite data may be less reliable than surface temperature data for a number of reasons.
People like Cruz who try to make claims based on the satellite data are likely to understand the above points. They deliberately do not want to more fully inform others of what they are aware of (typical debate, legal, political and economic tactics)
Not fully sharing your knowledge and understanding with others can give you a competitive advantage. Especially if scientific investigation for political marketing purposes indicates that a significant portion of the population are willing to be easily impressed by misleading marketing claims or outright lies.
The power of being able to 'create impressions' began trumping the significance of the 'actual substance' of an issue in the late 1880s (Pointed out by Susan Cain in "Quiet: The Power of Introverts in a World That Can't Stop Talking"). That is obviously something that needs to change (contrary to desires to prolong or expand many developed damaging and unsustainable 'popular profitable pursuits of perceptions of prosperity').
-
nigelj at 07:01 AM on 24 January 2016Thorough, not thoroughly fabricated: The truth about global temperature data
Cruz is either lying, or being misleading. He's intelligent enough to know using 1998 as a start point in the data isn't valid science.
This is particularly frustrating coming form Cruz, who sets himself up as a strong Christian with impeccable moral values, or at least aspirations to impeccable vales.
Its time the world stopped making excuses for people like Cruz. They should be utterly condemned for what the way they are acting, like utter charletans. Where's the media holding these people to account? Nobody has the intelligence or courage to do it, apart from a few websites like this one.
Not all climate sceptics are insidious people obviously, however the world is being held to ransom by a few fanatical climate sceptics. These people are towards the outside of the bell curve in terms of beliefs. Some of them may have some sort of personality disorder.
The satellite record shows 2015 was the third hottest year, according to UAH. However there is also a delay before el nino events show up fully in the satellite record. The 1997 - 1998 el nino didn't show up until mid 1998. Last years el nino may be the same, and wont fully show up until this year.
-
Trevor_S at 18:28 PM on 23 January 2016The Little Ape That Could
veranda posts. I drove a small SUV with a trailer to a nearby town to hire a machine to excavate the post holes and return it the same day. The machine had a 25 horsepower (HP) motor. My car had a 130 kW engine - roughly 175 HP.
I think it was the Earh Day founder whom I will paraphrase, "All we have to do to ensure the complete destruction of the enviorment, is to keep doing exactly what we're doing now"
and to further mangle things, Tolstoy 'Everyone thinks of changing the world, but no one thinks of changing himself.'
-
Tom Curtis at 13:43 PM on 23 January 2016A striking resemblance between testimony for Peabody Coal and for Ted Cruz
It occurs to me that part of the reason people buy the "satellites are more accurate" line is that they never see graphs of the raw data. I'm not sure where you could find a graph of the true raw data, and certainly would not be able to make one. But Po-Chedley et al (2014) have a graph of minimally processed data:

As I understand it, the top panel already has processing in the form of a rough alignment of means ot each satellites series. At least, it would be stunning if such a close allignment of absolute values was achieved in raw data from satellites. For comparison, here are the absolute alignment of satellite measurements of the solar constant:
Certainly similar problems of alignment are experienced by Earth observing instruments measuring the IR spectrum, and I see no reason why the microwave observing instruments (which operate on the same principles as the IR and solar observing instruments) should be any different.
Further, it is possible that the top panel in Po-Chedley's figure 3 also includes adjustments for problems with the hot target.
In any event, the transition between the top panel and the third panel is not a given. It represents serious adjustment to the data - and different teams disagree about how that adjustment is best done. As a result they also significantly differ about satellite data trends.
-
Tom Curtis at 13:15 PM on 23 January 2016A striking resemblance between testimony for Peabody Coal and for Ted Cruz
gregcharles @3, there are (at least) two graphs of satellite data used in the hearing. The first, introduced by Happer, shows the average of RSS and UAH TMT data against the average of four ballon datasets. It is shown above in the OP.
The second, shown by Ted Cruz himself is of RSS TLT data from March 1997 to Novemer 2015, and is shown below:
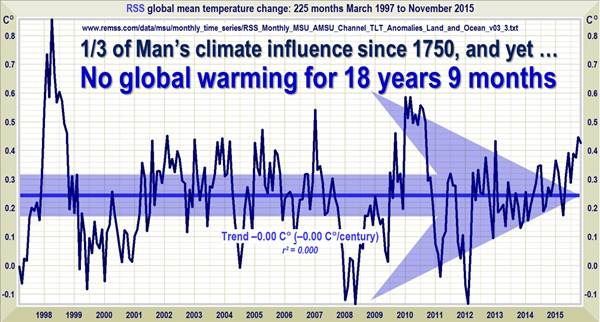
It should be noted that Admiral Titley's point about the start point is valid, but limited. That is because the strong La Nina's in 2008 and again in 2001/12 contribute as much to the low trend as does 97/98 El Nino. Ergo, in 2016 when RSS finally shows the current EL Nino (which it currently does not due to a well known lag), the trend will still be below what would be expected if there were no short term variations.
I might add that watching the video was distinctly unpleasant. It leads me to the belief that the purpose of a congressional hearing is to give the chair of that hearing the chance to see just how many lies he can fit into a three minute speach. Virtually everytime Cruz stated something was the position of climate scientists, he got it egregiously wrong.
-
David Lewis at 12:51 PM on 23 January 2016Thorough, not thoroughly fabricated: The truth about global temperature data
I assume Cruz is lying.
He is an accomplished debater. He made a name for himself starting at Princeton in 1992 when he won the Top Speaker award for them at the North American Debating Championship. When he went to Harvard Law one of his professors, Alan Dershowitz (a political liberal) said, "Cruz was off-the-charts brilliant". As Texas Solicitor General Cruz argued many cases before the US Supreme Court, winning more than he lost.
Because his argument against doing anything about climate change because it isn't happening is so weak, the first thought that comes to my mind is he is lying. Its just another debate to him. Top flight debaters can argue black is white, or white is black. It doesn't matter. He hasn't got much to work with in this climate debate, but he's giving it a shot.
He is cynically attempting to vacuum up the votes of people who actually believe NOAA, NASA, etc., just fabricate whatever it takes to contribute their bit to efforts of the global conspiracy of climate scientists who are all busy fabricating what they can so they can destroy the US economy or make their lawn die or whatever it is that they fear.
Prev 500 501 502 503 504 505 506 507 508 509 510 511 512 513 514 515 Next


