


 Arguments


Recent Comments
Prev 578 579 580 581 582 583 584 585 586 587 588 589 590 591 592 593 Next
Comments 29251 to 29300:
-
Cooper13 at 01:21 AM on 20 May 2015My Research with Steve
These are the stories you don’t read about in scientific papers, which out of necessity detail the methodology as if the authors knew exactly where they were going and got there using the shortest possible path. Science doesn’t often work like that. Science is about messing around and exploring and getting a bit lost and eventually figuring it out and feeling like a superhero when you do. And then writing it up as if it was easy.
LOL - I think a LOT of scientists in just about any field of publication can relate to this!! Congrats on the first 'first author' article!
-
dcpetterson at 00:25 AM on 20 May 2015Why the 97 per cent consensus on climate change still gets challenged
Part of denialism is based on the argument that if we don't know everything, it means we know nothing. I think ThisWillFrighten is making that same basic argument — if any part of the climate system (which includes daily weather) is chaotic, that means it all is, and models are useless.
This is also, I think, the basis for disputing the "consensus" argument. For example, if any questions can be raised about methodology, it means the study was imperfect, and therefore cannot be trusted (or "can be dismissed", which is the same thing).
Another example: Are you =certain= the "true number" for consensus isn't 96%? or 94%? or even 90%? If it isn't =precisely= 97%, that proves the study is flawed, and we shouldn't draw any conclusions from it.
This "reasoning" is insidious — even if all doubt could be removed that there is, in fact, a 97% consensus on this matter, that means 3% are unsure — if anyone is unconvinced, there must be legitimate question about the matter, and we shouldn't move forward.
I don't know how to combat this problem. It's funnny, because the same people who make these arguments are willing to, for instance, play poker, or bet on football games, or even cross the street when there could be cars around. The "if we don't know everything, we can't know anything" ploy is really a rationalization, not an argument that is sincerely held. It is an excuse for ignoring what is really a convincing reality.
-
chrisd3 at 23:52 PM on 19 May 2015Why the 97 per cent consensus on climate change still gets challenged
@Frightened: You don't understand what that quote means. It means that we can't predict the exact state at any particular time. It doesn't mean that we can't project long-term averages or trends with reasonable confidence.
-
KR at 23:47 PM on 19 May 2015Why the 97 per cent consensus on climate change still gets challenged
TWFYSYWDI - I've responded on the appropriate thread.
-
KR at 23:46 PM on 19 May 2015Climate is chaotic and cannot be predicted
TWFYSYWDI - Weather is certainly chaotic, a non-linear phenomena strongly dependent on initial conditions and difficult to predict more than a week out. Climate, on the other hand, is a boundary condition problem where long term averages are driven by energy balance, and is not chaotic. Exact future weather can't be predicted. But those averages can.
Apples and oranges, as they say.
-
KR at 23:41 PM on 19 May 2015Breathing contributes to CO2 buildup
Art Vandelay - In terms of the balance of biomass shifting from plants to humans with population growth, carbon has simply moved from one set of organisms to another - and not added to atmospheric concentrations. Again, breathing is carbon neutral, as what is exhaled simply cycles between food and CO2 and back again.
Atmospheric concentrations can only have net changes over the long term if more carbon enters or leaves the biological carbon cycle - from volcanic activity (no net long-term change), from weathering (slow drawdown, not relevant over century time-scales), fossil fuel burning (the relevant cause of change over the Industrial Age), etc. Breathing does not, and can not, influence long term atmospheric CO2 concentrations. It's a complete red herring in the discussion of climate change.
-
This Will Frighten You so You Will Delete It at 23:35 PM on 19 May 2015Why the 97 per cent consensus on climate change still gets challenged
Scad, regarding your assertion that "climate...does not appear to be" chaotic, you are not in agreement with the scientific consensus. This is what the IPCC has written:
"In climate research and modelling, we should recognise that we are dealing with a coupled non-linear chaotic system, and therefore that the long-term prediction of future climate states is not possible."
http://www.ipcc.ch/ipccreports/tar/wg1/505.htm
Moderator Response:[RH] Welcome to Skeptical Science! There is an immense amount of reference material discussed here and it can be a bit difficult at first to find an answer to your questions. That's why we recommend that Newcomers, Start Here and then learn The Big Picture.
I also recommend watching this video on why CO2 is the biggest climate control knob in Earth's history.
Further general questions can usually be be answered by first using the Search function in the upper left of every Skeptical Science page to see if there is already a post on it (odds are, there is). If you still have questions, use the Search function located in the upper left of every page here at Skeptical Science and post your question on the most pertinent thread.
Remember to frame your questions in compliance with the Comments Policy and lastly, to use the Preview function below the comment box to ensure that any html tags you're using work properly.
Your previous post was delete for being baseless gish-gallop. If you're going to post here you're going to have to be able to support your positions, and when you can't, you'll need to have the capacity to concede the point.
First case in point, climate, by definition, is not chaotic. If you believe this to be an incorrect assertion you need to support that with research that shows otherwise. Merely repeating the assertion without support will lead to having your posts deleted.
(edit) Note that SkS has several articles on the issue of chaotic systems. Start here.
-
jgnfld at 21:05 PM on 19 May 2015Why the 97 per cent consensus on climate change still gets challenged
It would be trivial to point out there is no overwhelming "evolution consensus" in the biological literature by counting up the number of published articles that explicitly endorse evolution in the text. Yet the argument is made that each climate paper must make an explicit claim or not be relevant to any consensus.
Odd reasoning.
-
BBHY at 20:07 PM on 19 May 2015Why the 97 per cent consensus on climate change still gets challenged
Carbon Dioxide absorbs infrared heat energy. You can do 1000 experiments and get the same result 1000 times: that CO2 absorbs infrared heat energy.
I don't care if it's Freeman Dyson, Judith Currty, or just some guy in congrss or on TV, none of these people have come up with any way to refute this very basic fact.
Adding more CO2 to the atmosphere will cause the atmosphere to absorb more infrared heat energy. Adding sugar to water makes water sweeter. Adding black ink to white paint makes it darker. At the most fundamental level this is not so very difficult for people to understand.
It's far past time to stop with all this crazy denial of the basic, obvious physical reality.
-
Art Vandelay at 16:22 PM on 19 May 2015Breathing contributes to CO2 buildup
@KR "Now, if a population increases, there is a corresponding sequestration of carbon in biomass - and in that fashion the 7 billion people on the Earth represent a carbon sink, not a carbon source. Breathing, however, is simply not a net cause of rising CO2."
I agree with the latter - that a static human population cannot on its own cause CO2 to rise.
However, on the former point, 7 billion humans came into existence in a very short time frame in geo terms, and as we know, every carbon atom in every human is plant borne, which means that there must be less plants to sink the 'respired' CO2 with 7 billion people than there was before the 7 billion people existed. IOW, the carbon that was sequestered in plants is now sequestered in humans, and unlike plants human are combustion engines needing carbon and oxygen to produce energy and expelling CO2 as waste in the process.
Consider the position if only plants existed. Their growth would be ultimately limited by insufficient CO2 in the atmosphere from photosynthesis.
And now consider paradoxical the position if human population rises to the point where all vegetation is consumed as food.
-
One Planet Only Forever at 14:31 PM on 19 May 2015Why the 97 per cent consensus on climate change still gets challenged
scaddenp,
Using the comments made on sites like WUWT as a basis for what is commonly believed is like looking at the insects near an outdoor light bulb at night to determine the ratio or relative proportions of different insects that are active at night in a region, or looking at the birds at a garbage dump to determine the ratio or relative proportions of birds in a region.
-
scaddenp at 13:39 PM on 19 May 2015Why the 97 per cent consensus on climate change still gets challenged
A quick glance at commentators at say WUWT would contradict your first point. A UN/liberal plot to rule the world with falsified data when clearly climate is normal seems pretty common belief.
"for the same reason that a butterfly flapping its wings in China can have an influence on subsequent hurricane formation in the Atlantic."
Not remotely. Weather is chaotic but climate (weather averages over a 30 period) does not appear to be. Consider that you can get a wet cold day in summer but summer average temp is always going to be warmer than winter average temp because there is more irradiation of the surface during your hemispheric summer. Adding more non-condensing greenhouse gases to the atmosphere has same effect, but globally.
Plenty deny it. The point of consensus is that consensus may or may not be right, but it is the only rational guide to setting policy. The consensus is that we need to reduce emissions and it appears that majority are very unwilling to do so or hate proposal that would be effective in achieving that;
As to climate models not predicting slower warming, well what what part of "climate models have no skill at decadal level prediction" is hard to follow? You can for instance see more of this discussed here. However, if you want to discuss this further please do so on this topic. Take very careful note of the comments policy on this site, especially the on topic/appropriate thread.
-
Tristan at 12:00 PM on 19 May 2015Climate sensitivity is low
Interesting, I would not have intuited that result at all!
bobl's difficulties in finding the sensisitivity to GHGs would be further compounded by the fact that you shouldn't be looking at the net antho effect anyway - as that ignores the negative anthro forcings.
It seems that you can't determine the ECS (or it's more relevant brother, TCR) from the recent temp record without first accepting the validity of quite a number of papers, something that bobl would never admit to doing in the first place. He's kinda stuck. -
Tom Curtis at 10:20 AM on 19 May 2015Climate sensitivity is low
Tristan @362, out of interest I just downloaded the forcing data from the IPCC AR5. From that I was able to determine the relative contributions of natural and anthropogenic components between certain dates and 2009 using five year running means:
1850 104.52%
1880 102.34%
1900 94.58%
1950 109.72%Note that the ratio of difference in forcing is not the same as contribution to difference in temperature. That is because there is some internal variability in temperature, because volcanic temperature responses are not commensurate with instaneous volcanic forcings due to thermal inertia, and because earlier forcings will have more fully worked through the system than will have later forcings. With these caveats, however, the relative contribution to change in forcing is a good first approximation to the relative contribution to change in temperature.
Allowing for the caveats, I believe the 1880 and 1900 figures significantly overstate the anthropogenic contribution. In particular, the anthropogenic contribution to change in forcing falls to 57% in 1885 and to 76% in 1904. Given the extent and intensity of volcanism that cause those falls, it would be foolish to assume a simple five year mean of the forcings captures the temperature impacts of that volcanism. Further, there is good reason to believe there was a significant contribution from internal variability to the temperature increase from 1910-1940 which will be diluted but also relevant to the temperature increase to 2010.
Of course, Bobl is not entitled to these caveats. In his calculation he ignores internal variablity (which of necessity cuts both ways), and by assuming TCR = ECS, he also ignores thermal inertia. Given that, it would be inconsistent of him to not use the relative contribution to forcing increase as the relative contribution to temperatue gain.
-
Tom Curtis at 06:19 AM on 19 May 2015Breathing contributes to CO2 buildup
Phil @40, below is the most recent IPCC estimate of the various fluxes in the carbon cycle (with changes to the process since the preindustrial shown in red):
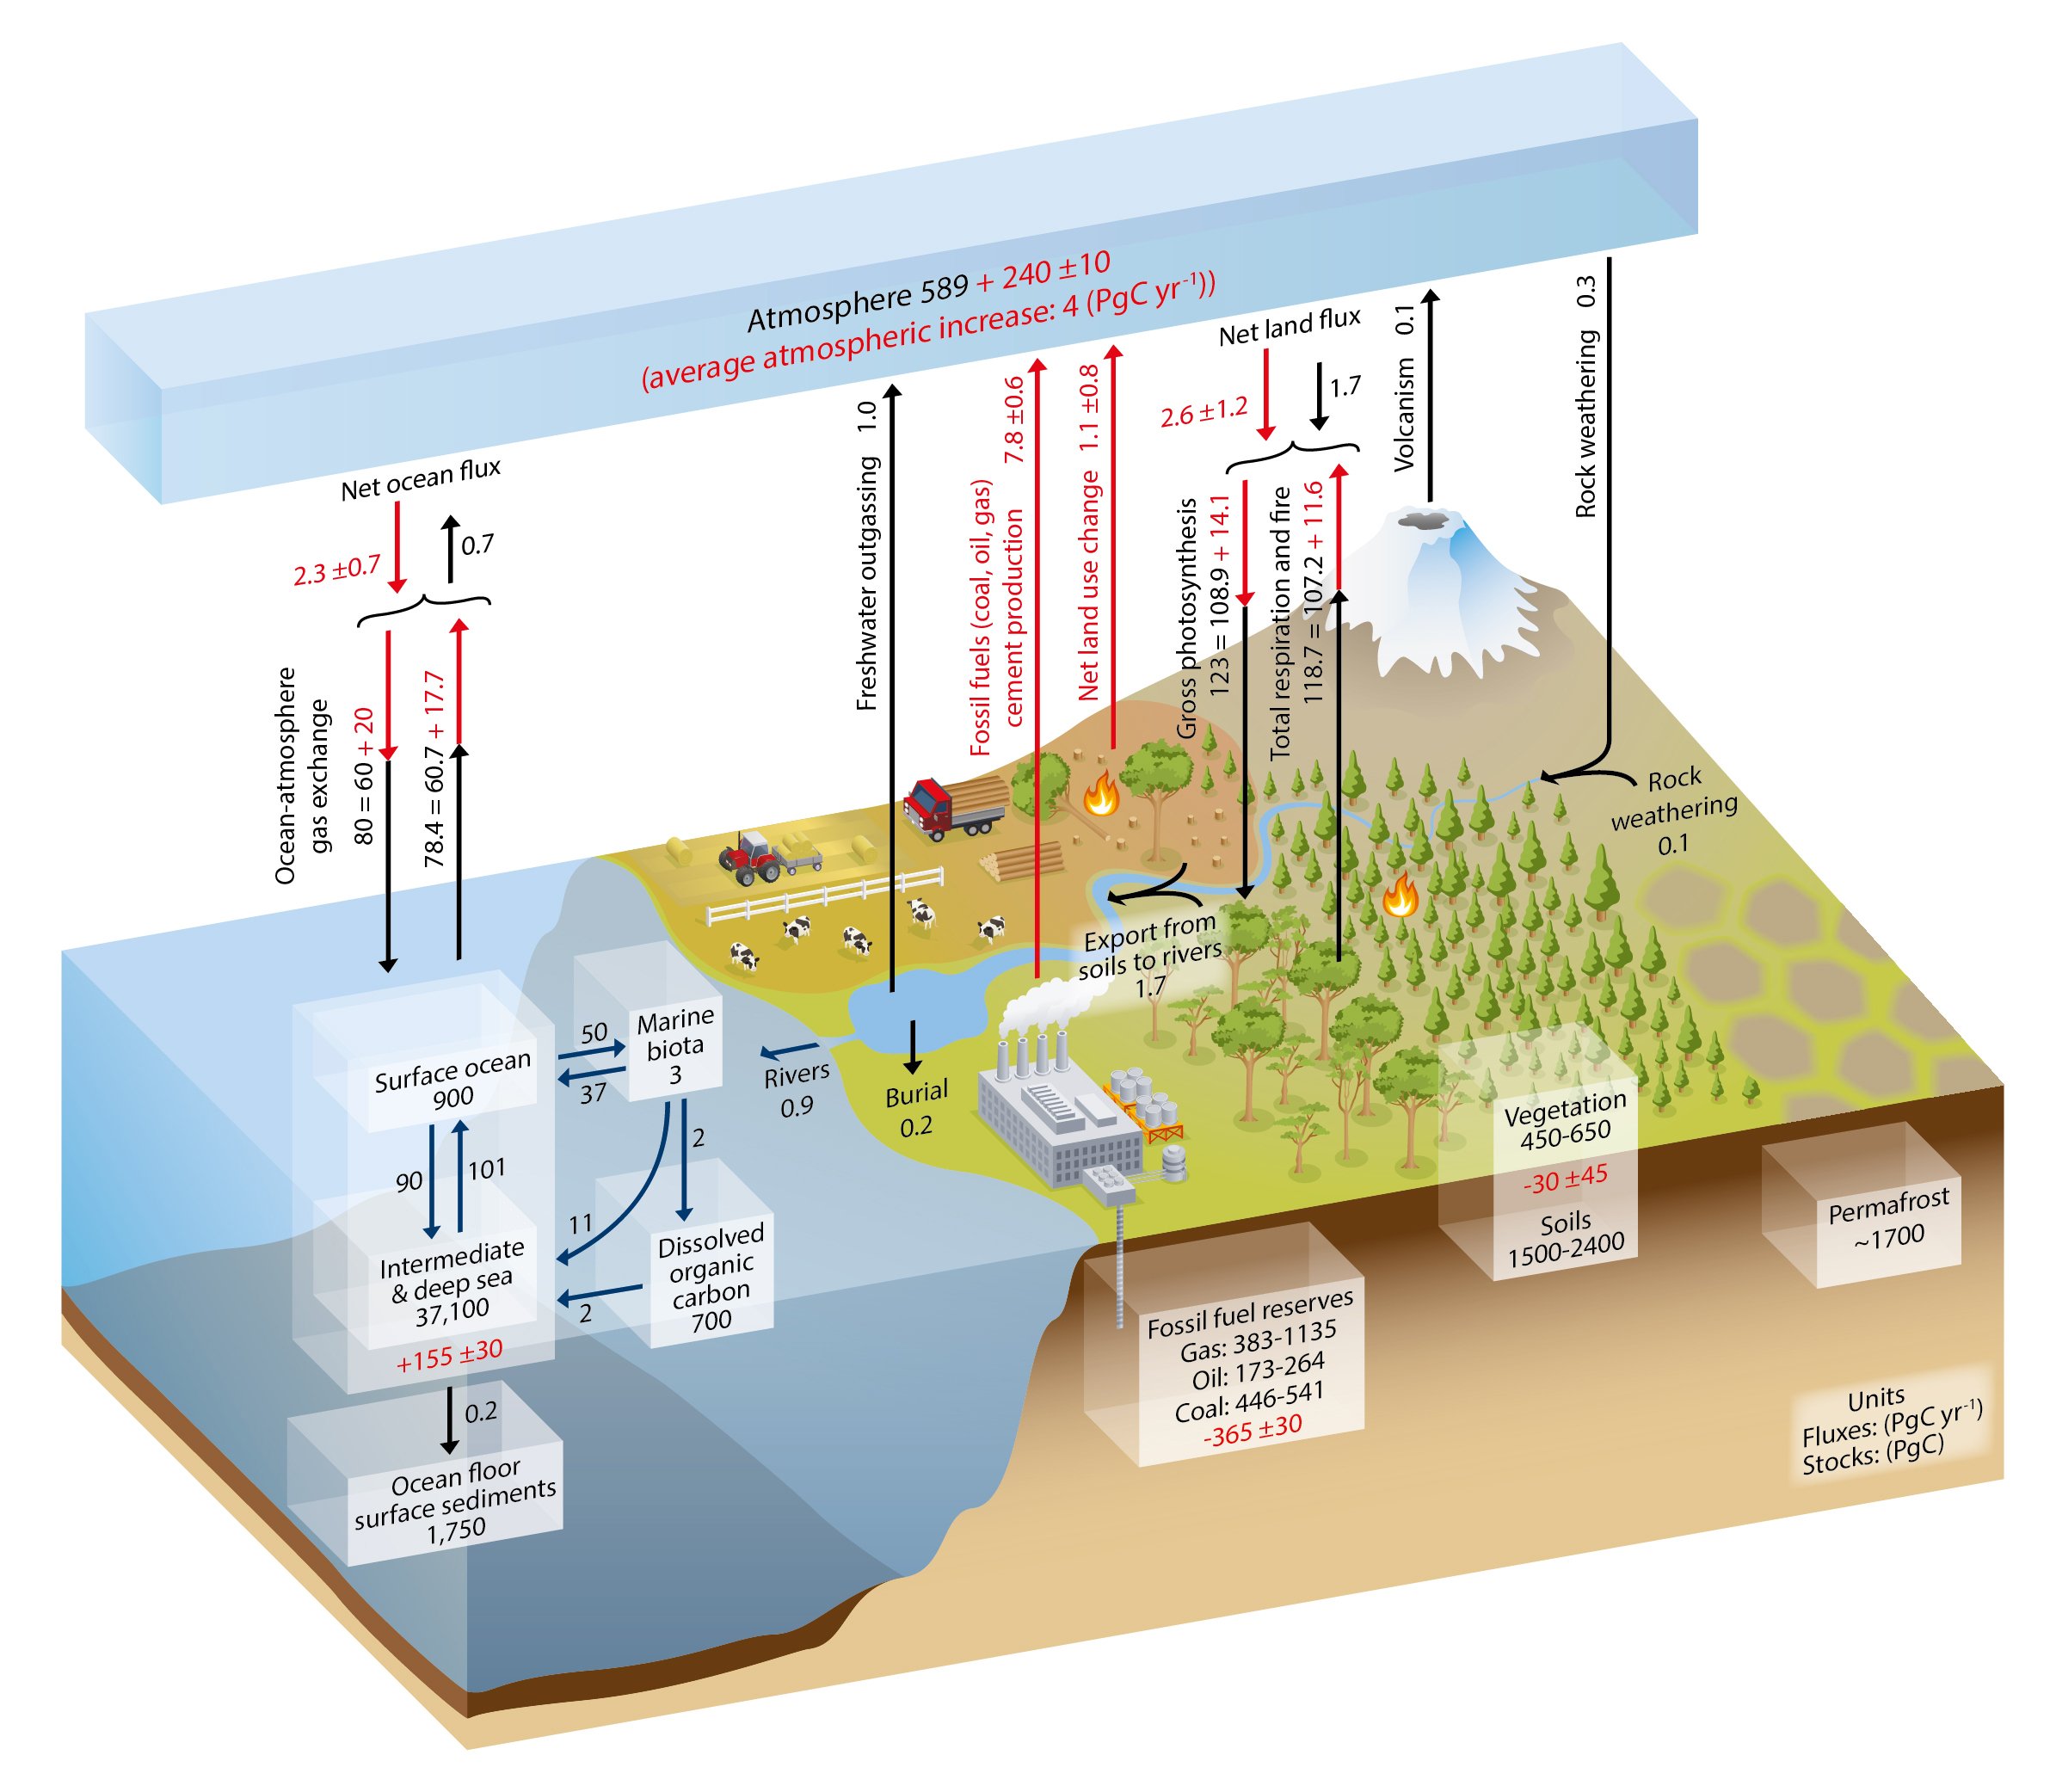
If you look closely you will see that "Gross photosynthesis" minus "Total respiration and fire" results in a positive flux of 2.6 +/-1.2 Petagrammes Carbon per year out of the atmosphere. That is an increase over the preindustrial value by more than the 90% uncertainty. Ergo it is simply false that "Of course land use change (specifically de-forestation) has been a significant carbon source, offsetting any increase in other forms of biomass." (As an aside, "respiration" in these terms includes natural decay.)
FYI, these values are known fairly well because they can track the decline in O2 in the atmosphere, which excedes the corresponding increase in CO2 from fossil sources, even after allowing for ocean uptake (CO2) and outgassing (O2).
-
TheCheshireCat at 06:07 AM on 19 May 2015Inoculating against science denial
Bland Denial is merely one component of the strategy first published by Peter Clyne in "How not to pay your debts - a handbook for scoundrels". Clyne proposed that successful evasion (of scientific truth, or obigations, or indeed debts) required these 4 steps: Deny, Delay, Confuse, Part-Pay (in an endlessly recurring sequence with slight amendments for each recycle). For example:
- Deny: (climate change is a myth)
- Delay: (More research is needed, wrong to act precipitously)
- Confuse: (Climate change is multifactorial, therefore wrong to focus on one single cause)
- Part-Pay: (okay climate change is here, but its not man-made)
Spice this up with some crooked language and logic, as Cook suggests, and there you have it. Add to this industry sponsorship of scientists and regulators to add some much-needed bias, and, well, here we are.
I'm reminded of the Upton Sinclair quote: 'It is difficult to get a man to understand something, when his salary depends on his not understanding it.'
Alice.
-
Tom Curtis at 06:05 AM on 19 May 2015Breathing contributes to CO2 buildup
Art Vandelay @38, any carbon in animal matter has first existed as carbon in plant matter. Any carbon in plant matter was in turn first extracted from the atmosphere by photosynthesis. The food chain may be extended in that, for instance plants (planckton) may be consumed by carnivorous planckton, which may in turn be consumed by planckton eating fish, that may be consumed by low level carnivous fish, that may be consumed by a top predator like Tuna, that may in turn by consumed by humans - but that does not alter the fact that every molecule of carbon in humans was first extracted from the atmosphere by photosynthesis (ignoring plastic based prosthetics). Therefore your argument fails because it reverses the logical order of the process, assuming in effect that the CO2 in humans comes into existance by a creative act and needs to be then, later extracted by photosynthesis.
Given this, there are only two ways that human respiration can increase atmospheric CO2. The first is if the whole cycle ceases, so that CO2 respired is not then taken up by plant matter. The second is if the whole cycle changes its time constants so that the carbon in the cycle spends relatively less time in biomatter and relatively more time in the atmosphere. For both of these, because they involve the whole cycle and not just human consumption it is not particularly appropriate to look at it in terms of respiration.
Of the two methods mentioned above, it is known that the first is not occuring. The second, however, is occuring, but is already accounted for in carbon budgets under the label of Land Use Change (LUC). Land Use Change, however, includes a large number of inputs in addition to changes in the relative rate of respiration. It includes, specifically, deforestation for the timber industry; and deforestation for land clearing (in which the timber is simply waste, and does not enter the human carbon cycle). These components dominate the LUC budget, so it is not possible to extract from the LUC figures any meaningful estimate of the change in relative times of carbon in the atmosphere from those figures (SFAIK).
One thing that is known, however is that net biosphere productivity is a sink for CO2. That is, once you add up all of the effects of deforestation, changes in agricultural practises, growth of urban areas, draining of swamps etc, and subtract from that the effects of increased plant growth due to increased humidity, the fact that human timber is better protected from decay than natural equivalents, (and hence precipitation) and any carbon dioxide fertilization effect, the total biosphere is absorbing more CO2 from the atmosphere than it is emitting.
-
Phil at 04:35 AM on 19 May 2015Breathing contributes to CO2 buildup
KR @39
Now, if a population increases, there is a corresponding sequestration of carbon in biomass - and in that fashion the 7 billion people on the Earth represent a carbon sink, not a carbon source.
But this may be offset by a decrease in other animal populations. Admittedly the rise in human population may have also produced a concomitant rise in domestic animals, however the population of wild animals has crashed over the past century. The population of non-photosynthesising organisms is dependent on the population of photosynthesising ones, and that in turn is dependent on the land mass available to them, along with the "ingredients" for photosynthesis. Of course land use change (specifically de-forestation) has been a significant carbon source, offsetting any increase in other forms of biomass.
-
KR at 02:25 AM on 19 May 2015Breathing contributes to CO2 buildup
Art Vandelay - "...the fact that we're net emitters (of CO2) rather than net absorbers of it, unlike plants"
Um, No. Aside from our fossil fuel emissions any stable population of organisms is carbon neutral, as the carbon in them comes from the environment and upon death returns to the environment. While carbon-containing food comes from the environment and is itself cycled back as (among other things such as fertilizer) CO2.
Now, if a population increases, there is a corresponding sequestration of carbon in biomass - and in that fashion the 7 billion people on the Earth represent a carbon sink, not a carbon source. Breathing, however, is simply not a net cause of rising CO2.
But then we go and burn fossil fuels that have been sequestered for hundreds of millions of years, and we go straight from carbon neutral to immense net emitters... sigh.
-
bozzza at 01:43 AM on 19 May 2015Monthly global carbon dioxide tops 400ppm for first time
-
Art Vandelay at 01:09 AM on 19 May 2015Breathing contributes to CO2 buildup
RJS
I liked your water baloon analogy.
The debate in some of the climate threads in cyberspace over whether the respiration of 7 million human inhabitants adds significantly to AGW is obviously alive and well, particularly among skeptics.
On the face of it the total emissions from animal respiration are considerable but of course we know that the carbon cycle is also a closed system.
Having given this some thought though I'm of the view that respiration from 7B people must increase atmospheric CO2 if for no other reason than the fact that we're net emitters rather than net absorbers of it, unlike plants.
To maintain an equilibrium it's obviously necessary for respired CO2 to be offset by photosynthesis in plants, which requires us to grow synthesising plants at the same rate that we're consuming them. We all agree on that I'm sure.
However, the net effect is to amplify the carbon cycle in much the same way that higher tropospheric temperature amplies the water cycle.
In the same way that the atmospheric transportation of water increases with temp so too does the transportation of CO2 into the atmosphere from increased animal respiration, resulting in an increase in the static level of atmospheric CO2 that's proportional to the population.
Since the laws of physics can't be broken the only way that this is possible is by converting O2 into CO2 and by transporting sequestered carbon (from trees and plants) into the atmosphere. Although humans grow crops to maintain the equilibrium they've needed to remove existing trees and plants to accomplish it, so effectively the amount of carbon that's stored in plants must have decreased as population has increased.
To what measnureable extent humans contribute to an altered ratio of OC and CO2 in the atmosphere is impossible to measure but I'm sure that it's dwarfed by CO2 borne from fossil fuels, but nonethless I don't think we can or should claim that human respiration from 7 billion people does not increase atmospheric CO2 to some degree.
-
CBDunkerson at 22:38 PM on 18 May 2015Monthly global carbon dioxide tops 400ppm for first time
chriskoz, aviation accounts for ~2% of emissions. Adding in the few categories of large ground vehicles which require an energy density that only fossil fuels can currently deliver might raise it to 3%. Thus, while I agree that we will likely continue to see some fossil fuel use for decades to come, I stand by my prediction that the peak of fossil fuel usage is less than a decade away.
Indeed, China may have already turned the corner. India and the rest of the 'developing world' countries which had been driving increases the past couple of decades aren't far behind.
Obviously, it will take time to replace the existing fossil fuel infrastructure with renewables, but we are very near (possibly even past) the turning point. Total CO2 emissions basically held steady last year despite global GDP growth. Trends so far this year suggest that CO2 emissions may well drop.
We talk about environmental tipping points, but such things also exist in politics and economics. We are very close to the point where renewables finish supplanting fossil fuels as the darlings of the global economic and political castes. Soon they will be growing not just because they are better, but also because they will be propelled by the same forces which have thus far been deployed to hold them back.
-
MA Rodger at 22:18 PM on 18 May 2015Models are unreliable
Klapper @923.
You conclude "So both the TOA spread from model to empirical and the SAT warming rate spread agree the models look to be running too hot." but your inclusion of "TOA spread" in this statement is entirely unsupported.
Imagine a world and a model-of-that-world with the model running hot. We impose forcings of equal size onto both. The model SAT rises faster because it runs 'hot'. But all things being otherwise equal, that would reduce the TOA imbalance as a higher SAT leaches more energy back into space. Thus my comment questioning whether high TOA could not be seen as a symptom of a 'cool' model.
But in climatology, things are never 'otherwise equal'. A 'hot' model with increased SAT presumably results in higher 'forcing levels' due to higher positive feedback. Now if the world & the 'hot' model had an SAT that were equal, their conforming increase in SAT would have equalised different proportions of the initial forcing as the level of feedback is different. In the model because of the larger feedbacks, this equalisation will be less - there will be more of the forcing remaining - more TOA imbalance. So we can propose that the TOA imbalance would differ because proportinately less forcing would be equalised in the model. The difference would be most dramaitc in a 'well-equalised' situation, where most of the forcing has been equalised. But let us assume the forcing is roughly half equalised in the world with the 'hot' model showing 33% more TOA imbalance, 33% less forcing equalised, but the same SAT. This implies ECS in the model is 50% too high.
But if in the model both TOA imbalance were higher and SAT were higher (this last the Klapper definition of a 'hot model' and exemplified by the CMIP5 projections 2006-2014) , ECS would have to be now greatly different to balance the books. @923, a value is suggested for the model ΔSAT = 150% of world values yielding a model:world ECS of 2.25:1. But this does not actually relate to the post-2006 period. To compensate for both TOA imbalance and the differences in SAT we are therefore talking, what, ECS proportionately 3:1, 4:1, more.
Given the CMIP5 models perform well prior to 2006, is it then at all likely that ECS in the models is so wrong? So how can we simply attribute the post-2006 performance to them being 'hot models'? -
Tristan at 13:42 PM on 18 May 2015Climate sensitivity is low
@DB, thanks for checking, those arguments definitely sound like ones he'd make, though I dont know if that's him.
@michaelsweet, thanks, can't blame a layperson for using hadcrut in this instance, and I'm waiting for his response on the as-yet-unrealised warming.
@MARodger, the best moment I've had recently was when someone told me that you couldn't use EVs for continuous random variables, and when I pointed him to a description of how you could he claimed "Queen's Gambit" and that he just was proving that I could spot a cherry pick. Which, I dunno, means he can accuse me of dishonesty in the future if I fail to agree with him that something is a cherry pick? Guess he got me.
@TomC, thanks, I actually posted that very graph before coming here, to which Bobl responded: my math is pretty much indisputable. I expect if he did [post it at Sks] I’d not get one refutation, they’ll either pick an irrelevancy like Tristan did, or for example want to pick a higher figure for the warming from 1850.
Every few months I go back, thinking, "maybe there'll be some people who respond in a reasonable manner", but the content is 40% rhetorical games, 30% slurs, 20% crazy, and only 10% the sort of argument I'm looking for. And then you I moderated for...who knows. I was told narcissism. I guess for not showing enough deference.
-
KR at 13:09 PM on 18 May 2015The climate 'hiatus' doesn’t take the heat off global warming
Owenvsgenius - See IPCC AR5 on detection and attribution for a summary of the literature on what percentage of recent warming is attributable to anthropogenic factors. The mean estimate is that ~110% of the warming over the last half-century is due to us.
I believe the other references you've been given on ocean sampling are a good start, and will defer additional comments in that regard until you've done some reading.
-
bozzza at 11:42 AM on 18 May 2015Ice loss in west Antarctica is speeding up
owenvsgenius, have you ever heard of dimensional analysis?
-
scaddenp at 11:27 AM on 18 May 2015Ice loss in west Antarctica is speeding up
Antarctica as a whole is losing ice (eg see here) at rate in order of 150Gt per year.
There is some expansion of sea ice around the continent (which at first glance is paradoxical as the sea warms) with complex causes. Note that an increase in sea ice in winter (when there is no sun) in no way offsets loss of arctic ice in summer (which causes a loss of albedo).
-
scaddenp at 11:16 AM on 18 May 2015The climate 'hiatus' doesn’t take the heat off global warming
I think the information on you want (level of uncertainty in ocean indicators) can be found Schuckmann and La Traon
-
Tom Curtis at 11:04 AM on 18 May 2015New study finds a hot spot in the atmosphere
chriskoz @11, in my comment @3, the first two images are the images used in the RealClimate post to show that both CO2 and solar forcing result in a tropospheric hotspot. The third image is, as you show the effect of halving CO2 (after 100 years). The fourth image, for comparison, is the effect of maintaining 1/3rd Pinatubo forcing for 100 years.
I would certainly be interested in, and gratefull for, Chris' rerunning of the GISS model for the equivalent experiment.
I cannot comment on Ben Santer's input as I have not seen it. Could you provide a link. Further, if he is commenting on the topic somewhere, and you can respond, could you ask his opinion of my point 4 immediately above. Specifically, what is the algorithm for "MSU Space"? Does converting to it have the effect I postulate? Also does he have any graphs of absolute temperature values with altitude in MSU space as the test of the effect of using MSU space?
-
bozzza at 10:56 AM on 18 May 20152015 SkS Weekly News Roundup #20B
Precisely correct, Bjorn Lomborg is blind to intergenerational inequality. His political message is a global one: that carbon emissions be allowed to warm the earth by three degrees. (What was his choice of measurement btw as I cannot recall?)
-
Tom Curtis at 10:55 AM on 18 May 2015New study finds a hot spot in the atmosphere
Tom Dayton @9 & 10, Michael Mann writes:
"Just compare the GHG signal in Santer et al '13 (which shows a hot spot) and the volcanic (which doesn't, and shows a change of sign at 500 mb, which is very close to the 595 mb PEAK of the TMT weighting function--if there were a mid-tropospheric hotspot, it should be seen in TMT)."
My emphasis.
Below is a figure showing the trend warming rates from 1979-2012 in the troposphere by altitude for all CMIP5 RCP8.5 models:

The source of the diagram is John Christy, which is dubious in some respects, but I presume he has not misrepresented the model outputs. That being the case, the CMIP5 models show a clear upper tropospheric hotspot with a multimodel mean peak warming at 250 mb. Despite this the trends from 1979-current are:
GISS 0.158 C/decade
RSS TLT 0.121 C/decade
RSS TMT 0.077 C/decade
RSS TTS 0.011 C/decade (from 1987)
RSS TLS -0.269 C/decade.
Clearly the trends decline as the mean altitude of measurement rises, with the TMT trend being less than either the TLT or surface trends, and greater than any trends above it. It follows that if Mann's claim highlighted above is true, then there is no tropospheric hotspot contrary to the model predictions. In other words, if Mann's highlighted claim is true, the models have been falsified on a fundamental issue that is vital to estimates of climate sensitivity and future warming. Michael Mann may want to claim in response that his claim is only applicable to volcanic warming, and not warming in general. If so that is just the rankest special pleading. If not he either has to accept my claim @8, point (3), above, or radically revise his reliance on models, and his view as to the dangers of AGW.
Further, the GISS Model E vIII 1880-2000 all forcing response by altitude is shown below:

As you can see, the peak warming is around 350 mb (337.5 mb). That is in fact lower than the CMIP5 multimodel mean, and also lower than the CMIP5 versions of the GISS Model E (six versions, shown with dotted lines of various shades in the first figure above). That discrepancy may be simply due to the different forcing periods, but if anything the evidence is that the altitude of peak warming has shifted upwards from CMIP3 to CMIP5, not downwards as would be required for the GISS model E images I have been using to be in need of significant correction.
As an aside, there is certainly no reason to prefer the data from cone CMIP3 era model, ie the Parallel Climate Model (PCM) as shown in the IPCC reports and used by Mann over another model of the same vintage (GISS Model E vIII). As a further aside, the peak cooling for the one third Pinatubo forcing shown @3 is also at 337.5 mb). This point should be irrelevant in that I originally rebutted Mann's claim that, "if global warming really *were* due to a (natural) decrease in volcanic activity over time ... then we would expect to see an increase in global surface temperatures WITHOUT any mid-tropospheric "hot spot"". Mann now appears to be trying to make the issue about the exact altitude of peak warming, which shifts the goal posts. He also misrepresents the altitude of the peak warming (or cooling) in the GISS model, claiming (@10) it is about 140 mb higher in the atmosphere than actually shown by the model.
3) Fairly abviously, the PCM models shown @10 do not use a period with significant volcanic forcing, with the consequent that any coldspot is too small to register for the volcanic forcing given scale. The same also applies with sign reversed for the solar forcing. That is telling in that solar forcing is definitely one of the forcings which does show a hotspot, but shows no hotspot in the PCM figure. As Mann accepts that solar forcing generates a hotspot, he must attribute the lack of a visible hotspot in the solar forcing panel to the small quantity of warming relative to the temperature scale used. He cannot therefore consistently argue that that is not also the case with respect to the volcanic forcing.
4) Finally, with respect to figure 2 from Santer et al (2013) (see your post @6 above), Santer et al write:
"Zonal-mean atmospheric temperature trends in CMIP-5 models (A and D–G) and observations (H and I). Trends were calculated after first regridding model and observational TLS, TMT, and TLT anomaly data to a Graphic latitude/longitude grid, and then computing zonal averages. Results are plotted in “MSU space,” at the approximate peaks of the TLS, TMT, and TLT global-mean MSU weighting functions (74, 595, and 740 hPa, respectively)."
My emphasis.
It is not explained what "MSU Space" is, although it is almost certainly not a linear function of temperature with altitude. More likely, at each altitude, the value shown is the weighted average of the TMT, TLS and TLT trends, with the weighting determined by the relative weight of each channel at that altitude as shown in my post @8, although different algorithms with similar effect could also be used. As such, it loses vertical structure. That is because it first reduces the vertical structure to just three values, and then tries to recompose it from those three values. It is, in effect, a complex smoothing of the data. As such it will not more show the tropospheric hotspot than will the TMT channel (for reasons given above). What it will show is what will be found by attempts to reconstruct the vertical temperature signal from the MSU or AMSU channel outputs. That, of course, is very useful for comparison with satellite data, but renders the graphs positively misleading about the detailed vertical temperature structure of the atmosphere.
-
Daniel Bailey at 10:47 AM on 18 May 2015The climate 'hiatus' doesn’t take the heat off global warming
Here's a couple to give you a head start on your research:
Google Scholar wants to be your friend. Call him.
-
bozzza at 10:46 AM on 18 May 2015The climate 'hiatus' doesn’t take the heat off global warming
Owenvsgenius, you can't measure everything: this is called 'the uncertainty principle'. Thus all measurements have to be verified by other means making repetition of results central to scientific method!!
-
chriskoz at 10:09 AM on 18 May 2015New study finds a hot spot in the atmosphere
Tom Curtis @3,
Looks like Mike Mann did not even change the details of his hypothesis based on your input. And as it turns out MM hypothesis is backed by Ben Santer, your inquiry to the authority of Gavin Schmidt on the subject is unlikely to change anything. Meanwhile Chris Colose offered to run GISS model you claim about volcanic hot spot is based on, to run it and check the apparent discrepancy: we are all eager to see the results, thanks Chris!
Meanwhile, pardon my punt, I don't see the extraordinary evidence you need to provide in support of your extraordinary claim taking on the top scientists. If particular, your third image is just a hot spot cooling due to a loss of 50% of CO2, as seen in the NASA link you cite. Where is the "1/3 rd Pinatubo level volcanic forcing" picture where you claim "the patterns in the tropics are very similar"? Maybe you've seen but missed that picture. Please provide it for the benefit of us better understanding your point.
-
Owenvsgenius at 10:02 AM on 18 May 2015The climate 'hiatus' doesn’t take the heat off global warming
Can anybody tell me the spacial resolution and coverage of ocean temperature surveys? This question impacts the subject matter directly, as models use survey data
Moderator Response:[JH] Perhaps you should do your own research on this matter.
-
Tom Curtis at 09:43 AM on 18 May 2015Climate sensitivity is low
Bobl writes, "Now the IPCC says that 50% of warming is probably coming from humans and 50 % is natural variation ...".
What the IPCC actually wrote was that:
"More than half of the observed increase in global mean surface temperature (GMST) from 1951 to 2010 is very likely due to the observed anthropogenic increase in greenhouse gas (GHG) concentrations."
where "very likely" means "90-100%" likelihood. In other words, what the IPCC claimed was that there is a less than 10% chance that only 50% or less of 1951-2010 warming was due to anthropogenic forcings. That is sufficiently different, indeed contradictory of what Bobl claimed the IPCC wrote that prima facie, he is a bald faced liar.
Indeed, it is worse than that. The IPCC also provided a figure with the mean and uncertainties of attribution. This allows you to generate the Probability Density Function (PDF) of the AR5 attribution, as was done by Real Climate:
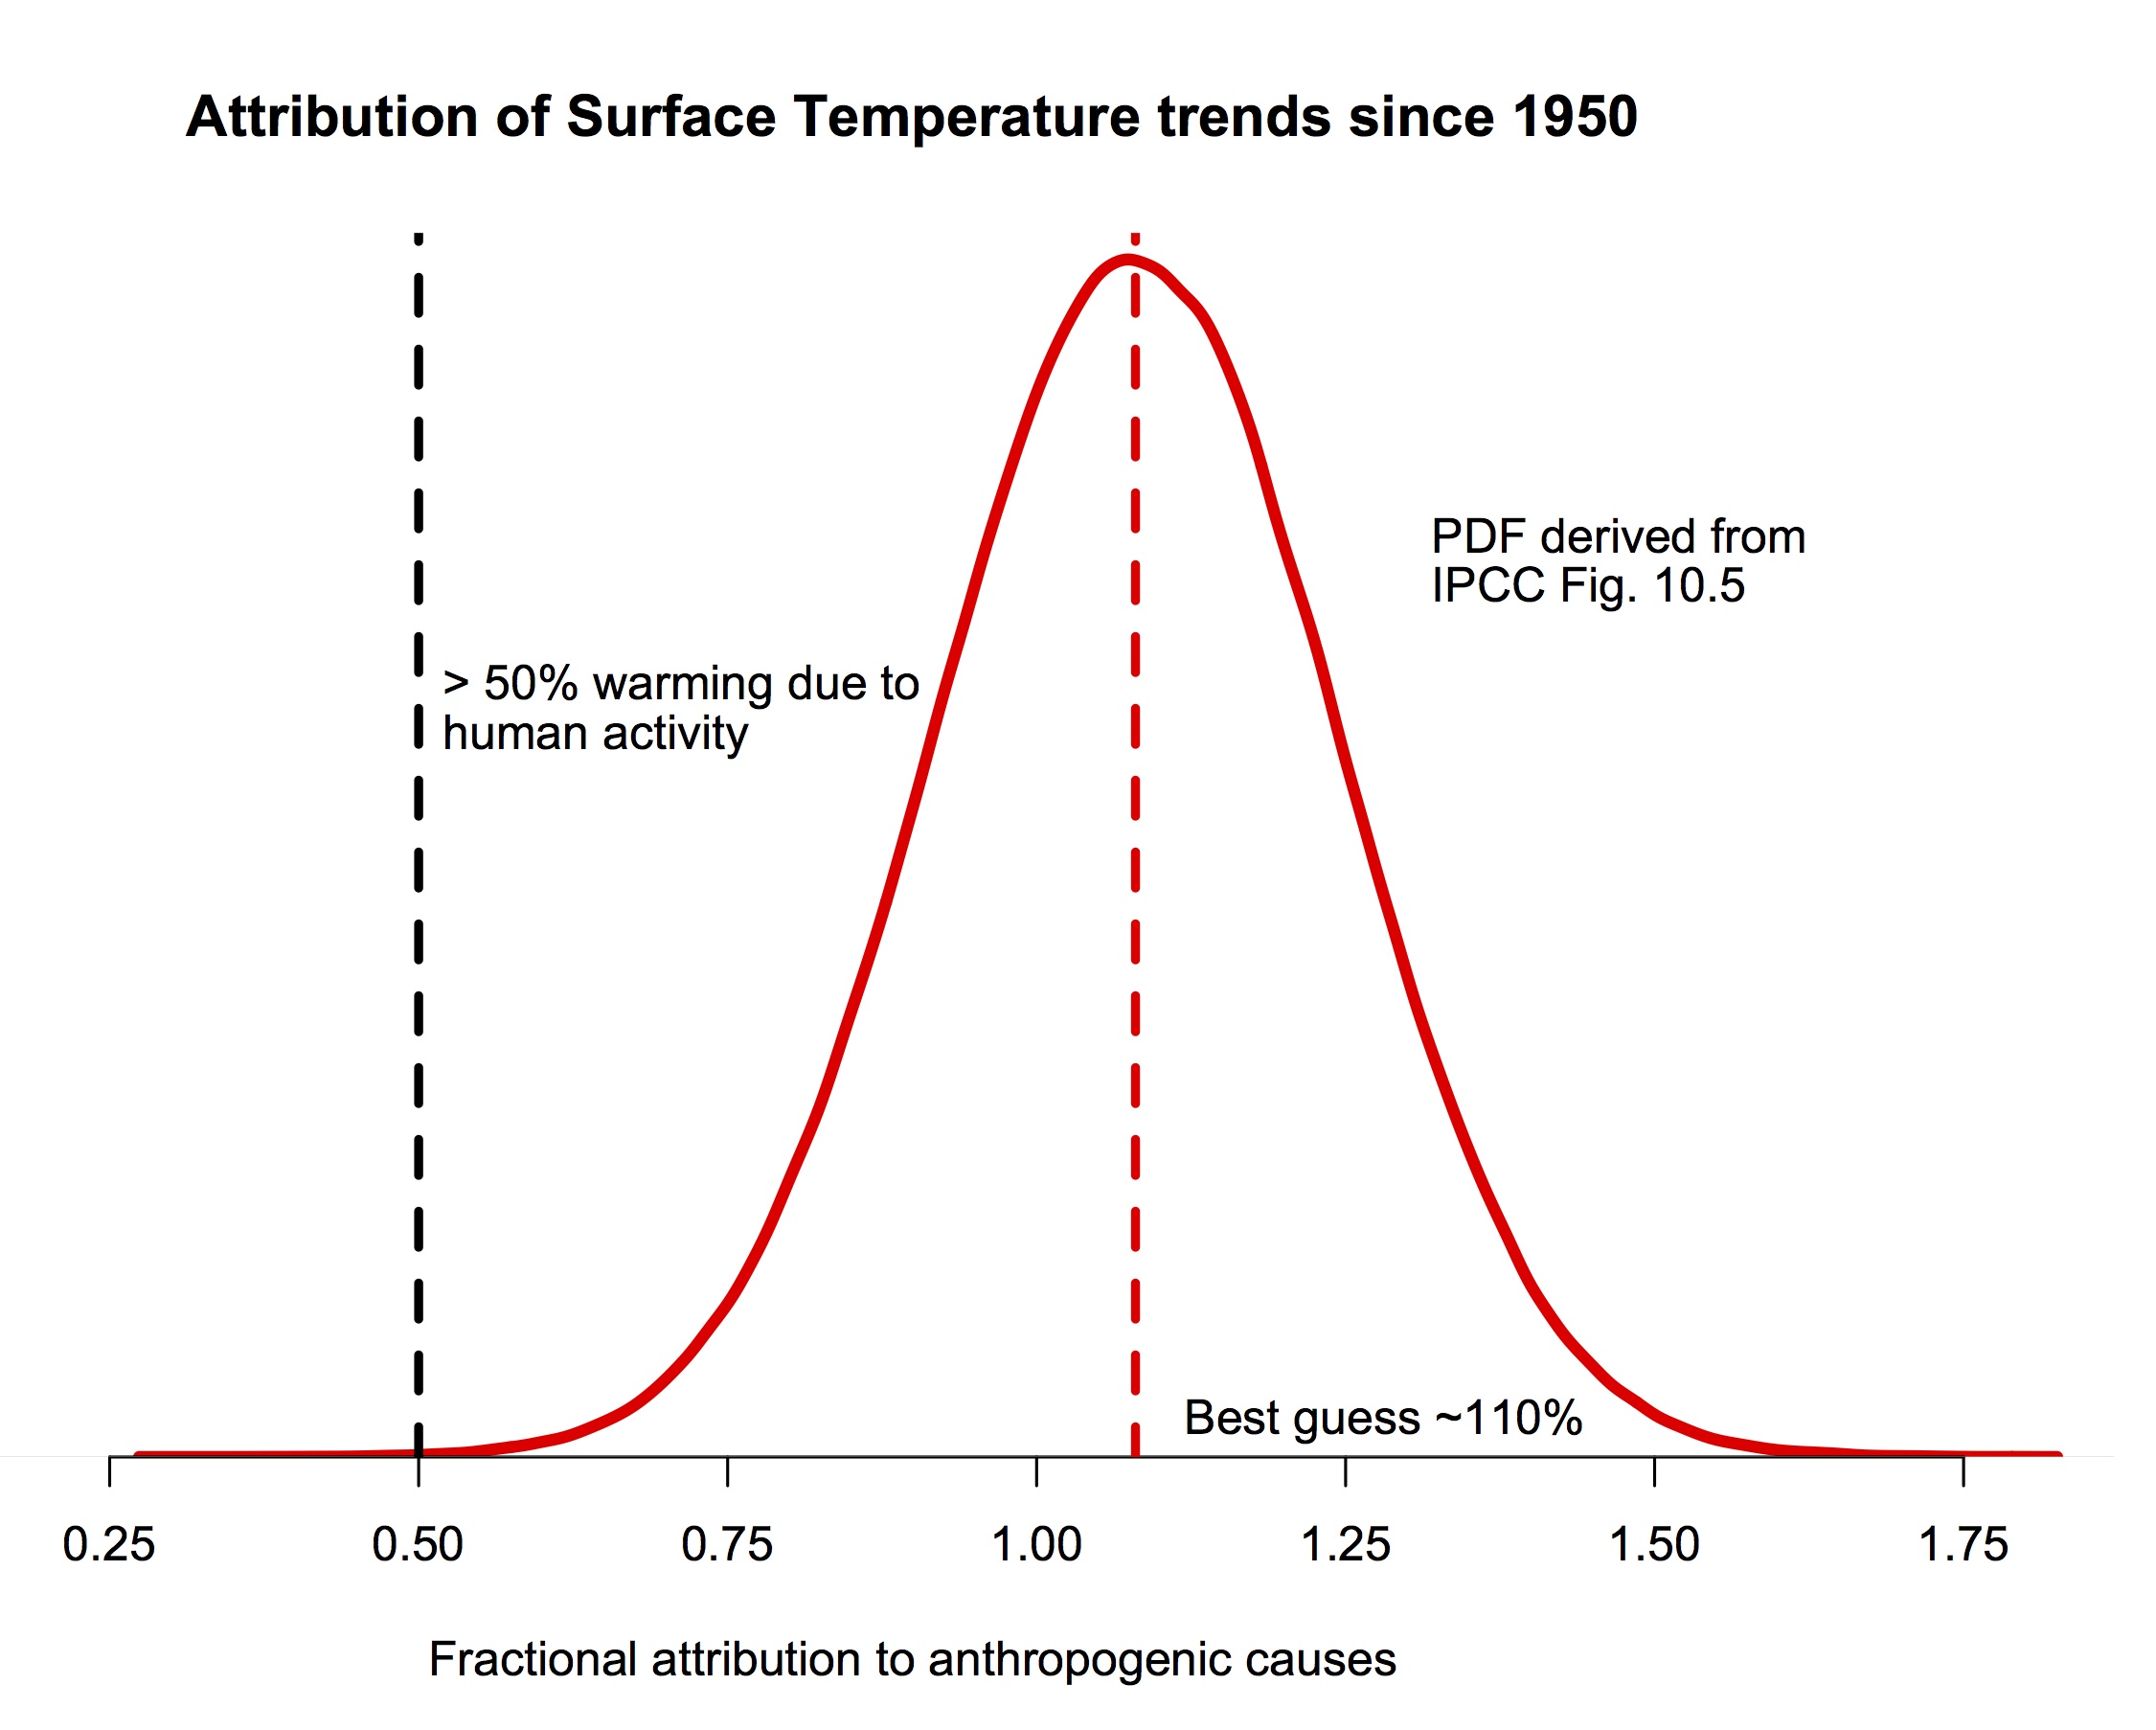
From this, in turn, it can be determined that the actual likelihood of less than 50% anthropogenic causes of warming since 1951 is 0.06%. It follows that at best Bobl is calculating the lower bound of the 99.9% probability range of the "climate sensitivity". To perform the calculation correctly (ignoring other errors), he should have used an attribution of 107.7% (the mean value of the PDF). Correcting for this factor alone would more than double his "climate sensitivity" estimate.
It should be noted, of course, that the IPCC attribution statement only covers the period 1951-2010. It cannot be arbitrarilly extended to cover periods back to 1900, 1880 or 1850. Natural forcings were negative from 1850 to about 1910, strongly positive from then to 1940, and remained positive to about 1950, as they more than recouped the losses to 1910, and have been effectively neutral or slightly negative since then. The result is that 70% is a better estimate than 108% for the anthropogenic contribution since 1900 (or 1880), but 100% is probably more accurate for the anthropogenic contribution since 1850. These figures, of course, are highly uncertain and not particularly precise. Sufficiently so that I consider estimating climate sensitivity from temperature differences between two dates with the first date prior to 1950 to be essentially a waste of time. If you are going to make those estimates, you should greatly increase the data used to counter the uncertainties. You do this by fitting a Transient Climate Response (TCR) function to annual data as Kevin Cowtan has done. The result is a TCR around 2 C per doubling of CO2, with an Equilibrium Climate Sensitivity necessarilly greater than that.
-
Owenvsgenius at 09:09 AM on 18 May 2015The climate 'hiatus' doesn’t take the heat off global warming
KR, I would like to point out that we do not posses the coverage needed to properly survey the ocean and its depth to come up with anything concrete. Our surveys currently rely on a lot of speculation
Moderator Response:[TD] You need to back up your contentions with data.
-
Owenvsgenius at 09:01 AM on 18 May 2015The climate 'hiatus' doesn’t take the heat off global warming
KR, so what you are saying to Ryland is...that %100 of all warming is due to human CO2 forcing which is offset by tiny amounts of natural cooling...in other words the main driver if climate, using your reasoning, is offset by blips in natural variability...that again, naturally occurring blips cancel out that warm feeling we're all looking for. So what is the primary driver then?
Moderator Response:[JH] Please note that posting comments here at SkS is a privilege, not a right. This privilege can be rescinded if the posting individual treats adherence to the Comments Policy as optional, rather than the mandatory condition of participating in this online forum.
Please take the time to review the policy and ensure future comments are in full compliance with it. Thanks for your understanding and compliance in this matter.
-
Owenvsgenius at 08:26 AM on 18 May 2015Ice loss in west Antarctica is speeding up
Its an interesting survey. However the title is misleading, as the Antarctic ice, to the best our ability to survey, is growing. Yes a certain peninsula, which is subject to warmer temps, by warmer I mean less than 0 C average summer temp, has lost some ice...so what
Moderator Response:[JH] Unless you can back-up your assertions with proper documentation, they are just your personal opnions which very little weight on this website. Sarcasam is also frowned upon.
-
Klapper at 06:19 AM on 18 May 2015Models are unreliable
@MA Rodger #922:
"Wouldn't such a 'hot model' not run with reduced TOA energy balance?"
If the TOA energy balance was zero (incoming = outgoing), we would for that instant be neither gaining nor losing energy, so although there may be temperature change by heat transfer from one global heat sink to another, total global heat stays the same. An AOCGC model with a positive TOA imbalance (incoming > outgoing) is gaining heat, either in the atmosphere or the ocean, or ice conversion to water (or all three), but it's unlikely you would not see a temperature rise in both the ocean and the atmosphere over longer periods. The higher the positive imbalance the faster the temperature rise, although SAT rise is obviously subject to the percentage of heat sinking into the ocean vs. the atmosphere.
In fact this is what we see in SAT. Over the last 35 years the ensemble modelled temperature rise is 0.25C/decade, while SAT only rose about 0.15 to 0.18C/decade depending on SAT dataset. So both the TOA spread from model to empirical and the SAT warming rate spread agree the models look to be running too hot.
-
MA Rodger at 05:36 AM on 18 May 2015Models are unreliable
Klapper @920.
You write "I like to post numbers and let people decide for themselves" which is rather generous of you. But you do also present an opinion, writing "I still think the models run hot after this exercise." This implies that in light of your "exercise" you see nothing to contradict your contention that "models run hot." Indeed, you go on to argue that your "exercise" lends support to your 'hot model' thesis. "The average error on the over the last 35 years, model TOA forcing to OHC et al is +0.27 W/^2, so the models are definitely warmer in this analysis period." (My emphasis)But your 'hot model' thesis is surely to do with the modelled global temperatures being too hot due to their modelled temperature rising too fast. Wouldn't such a 'hot model' not run with reduced TOA energy balance?
-
MA Rodger at 05:30 AM on 18 May 2015Climate sensitivity is low
Tristran @357.
I must say that JoannaNova comment thread is a classic. I think they could be sitting on a new direction for comedy. "Exactly Tristan, where are the published figures on jet stream friction, where are the published figures on kinetic energy of global rainfall…. though you can calculate that one, it’s about 0.05 Watts per square meter, comprising about 10% of the imbalance energy." Never one to shirk a challenge, if raindrops hit 20mph & average global rainfall 900mm, Bobl is only a triffling 5000% out!!
As for his question, if you use the forcings from AR5 AII Table 1.2 (which are a little higher than CO2 forcing alone), & the global numbers@359 (but assuming 0.86W/m2 imbalance) you get an ECS = 2.8ºC but most folk consider energy balance methods do underestimate ECS. The figure is also sensitive to negative forcing levels with their big error-bars.
-
michael sweet at 02:19 AM on 18 May 2015Climate sensitivity is low
Tristan,
I used the Northern Hemishpere data instead of the global data (my link is to the correct data). 1880 was -.22 and 2014 was +.68. That gives .90 observed and 1.6 including warming in the pipeline. That is 2.3C per doubling or 4.1 incuding warming in the pipeline. Multiplying by 1.06 gives 2.4 observed warming and 4.3C at equilibrium.
-
michael sweet at 02:09 AM on 18 May 2015Climate sensitivity is low
Tristan,
If Bobl claims that his estimate is "truth telling" it is easy tp see why he has trouble at SkS.
Checking the GiSS temperature records I find that in 1880 the anamoly was -.38 degrees while 2014 was +.86 degrees (it is more accurate to do a least squares fit but Bobl did not say how he got his numbers). I find that to be 1.24 degrees since 1880. The records previous to that are incomplete and inacurate. Bobl is probably using HADCRU which is well known to underestimate warming since it does not cover the entire globe. Since this year is currently running .15 degrees above last year and there is an El Nino that will increase temperatures later this year it will not be surprising to see 1.4C globally this year. At .15/decade it will only be 40 years to the 2C disaster threshold.
Bobl knows that the current temperature is not in equilibrium with the forcing. He has left this amount out of his calculation. Estimates range around .7C in the pipeline. That makes 1.94 degrees for an estimated final temperature with current CO2 concentrations. Using 1.24 degrees I get 3.18 degrees per doubling and using 1.94 I get 4.97 degrees per doubling (!!). The IPCC estimates there is greater than 95% chance of 50% of warming being due to humans with 106% the best estimate (Bobl knows that too). The 3.18 must be multiplied by 1.06, not by .50. That rounds the estimates to about 3.2 degrees per doubling for observed warming and 5 degrees including the warming in the pipeline.
The agreement is that above 2C is a disaster, not that below 2C could be good. Warming is accelerating so I expect 2C to happen in my children's lifetime.
-
Tom Dayton at 01:48 AM on 18 May 2015New study finds a hot spot in the atmosphere
Mike Mann updated his post on the hot spot. This is the last time I'm going to copy over his posts and comments. Please go to his FaceBook page if you want to read and comment more.
UPDATE to "The Tropical 'Hot Spot' and Global Warming"
In response to some interesting comments in the comment thread of my previous post, I've decided to add some additional discussion (and two new figures). Figure 1 is a modified version (from Karl et al '09) of a figure that appeared in the CCSP SAP 1.1 report "Temperature Trends in the Lower Atmosphere" in 2006 that compares the PCM model-predicted patterns of response to the various forcings (based on Santer et al 2000). What I like about this particular figure is that the tropopause (border between troposphere and stratosphere) is explicitly shown, which helps to guide the interpretation of the results. The difference in the relative vertical patterns of response to the various forcings is clear here. Greenhouse gases and Anthropogenic Sulphate aerosols show a clear mid-tropospheric amplification. Volcanic forcing does not. Note that the peak warming in the response to greenhouse gases alone (i.e. the center of the "hot spot") is very close to the tropopause, but the response to all forcings combined shows a peak "hot spot" that is well below the tropopause. That is true because the other forcings do not follow the same vertical pattern of response as the GHG forcing alone.
Figure 2 is from the same report, and it is especially instructive as it shows the response of 4 different models (trend from 1979-1999) to the same imposed late 20th century forcing changes (greenhouse gas increases are the single largest forcing contribution). A "hot spot" of sorts is observed in each case, but note the dramatic variation in the vertical pattern and in the "shape" of the hot spot. GFDL for example has a very well defined hot spot peak at 300mb (and both PCM and CCM3.0 have peaks just above 300mb), while GISS-EH (the model used in the Skeptical Science post mentioned earlier) has a peak that is centered higher up, closer to 200mb. This speaks to the importance of varying convective and cloud parameterizations that govern the dynamical responses. There is no simple, universal response common to all models subject to all forcings. And I will leave it there...
Figure 1:

Figure 2:

-
Tristan at 00:30 AM on 18 May 2015Climate sensitivity is low
Apologies for this one folks. Bobl over at joannenova is adamant that he has been banned from sks for his truth-telling, and I told him I'd ask a question for him. A couple commentators now have a bee in their bonnet given I tried to address it myself, so here you have it:
In 1850 the temperature was about 0.75 deg C lower than now, the CO2 was supposed to have been about 270PPM. Now it’s 400 PPM.We know from Arhennius that deltaT = k ln(CO2-2/CO2-1)
So, therefore 0.75 = k ln(400/270) and therefore k=0.75/ln(400/270)
k = 1.91
So lets then calculate the warming for a doubling
DeltaT = 1.91 × ln 2 = 1.34 degrees per doubling between 1850 and 2014
Now the IPCC says that 50% of warming is probably coming from humans and 50 % is natural variation so if we assume that 50% of all the warming from 1850 to now is CO2 induced (which it is not, the bit from 1850 to 1950 is unlikely to be CO2 related) at best we causing just 0.77 degrees of warming due to mans gasses, and the other 0.77 degrees must be something else which won’t necessarily accumulate.
0.77 degrees per doubling implies feedback was negative over the period from 1850 to 2014.
Given CO2 warming over the last 130 PPM was at best 0.37 to 0.75 degrees and the implied climate sensitivity from that is therefore 0.77 to 1.35 degrees per doubling, therefore the magic 2 degree figure (noting that the IPCC says up to 2 degrees of warming will be positive for the human race) is likely 500 – 1000 years away from happening, why are we even worried about it?
Moderator Response:[DB] "Bobl over at joannenova is adamant that he has been banned from sks for his truth-telling"
There is only one SkS user with "bob" prefacing their user name that is banned from this venue and that is user "Bob Smith", who had his commenting privileges revoked for being a sock puppet of yet another SkS user.
Bob Smith at 18:47 PM on 18 December 2012
IPCC Draft Report Leaked, Shows Global Warming is NOT Due to the Sun
I am a retired Professional engineer, not a scientist but let me make a few comments: You have scared the governments into giving you the enormous amounts of their taxpayers’ money that you use to maintain your lavished lifestyle. For instance, the lead authors of this report will have their meetings on Tasmania Island, a place that is as far from everywhere as you can possibly get, with air fares in thousands dollars each and with huge CO2 footprint to match them while we, ordinary people, suppose to walk or bike to work. Last month there were 14,000 of you, including 7,000 environmental activists, on all inclusive holiday at the taxpayers’ expenses in Doha. And just the accommodation, air fare and meals for these activist cost some $50 million. And last year it was Rio and before that Durban and Cancun. CO2 and the resulting warming suppose to run out of control but you must be an organization with the largest CO2 footprint in the world. And money you spent has also enormous CO2 footprint for before you can spent it on your salary, reports grants and perks ,like travel, the taxpayers must generate good and services to make them. This is not how the people claiming that CO2 and warming is out of control ought to behave. You are also in a huge conflict of interest for unless you can keep the public scared of the warming your paycheques, careers and perks would be gone. And that applies to the authors as well as peer reviewers. And there is more. -
Klapper at 20:01 PM on 17 May 2015Models are unreliable
@Rodger MA #919:
There is on point on my graph where the models do seem to make more sense than the empirical data, namely the early 90's when the model shows a sharp TOA forcing reduction due to a 2 W/m^2 spike in upwelling shortwave.
-
Klapper at 19:55 PM on 17 May 2015Models are unreliable
@MA Rodger #919:
"...with my noting that you are ignoring mountain glaciers..."
As you pointed out the montane glacier effect was insignificant to the graph I was producing, being 0.005 W/m^2.
"...The moderator response @911 suggested it was inappropriate for you to be posting such this work-in-progress down this thread..."
The moderator can delete my posts if it's inappropriate. I'll consider this project done and won't however post my next project which is to compare TOA net forcing with ENSO, the AMO and the PDO.
"... I ask this becuse you could well be setting yourself to support the opposite..."
I like to post numbers and let people decide for themselves. I still think the models run hot after this exercise. The average error on the over the last 35 years, model TOA forcing to OHC et al is +0.27 W/^2, so the models are definitely warmer in this analysis period.
In your #912 post you state OHC to 2000 metres weighs in roughly at 1 W/m2, but I disagree. The actual number is 0.89 for a trend centred on Nov 2012 and 0.80 for a trend centered on August 2012. However, I think the issue with your choice of period is that it starts with a strong La Nina and ends with an El Nino (which I intend to investigate further). So is it representative of longer term forcing elements?
Moderator Response:[JH] Please do not use the SkS comment threads as a "blackboard" for your next project.
-
MA Rodger at 18:48 PM on 17 May 2015Models are unreliable
Klapper,
I would caution you to slow down with your inputs into this comment thread and consider what you are responding to, rather than bash out the first rebuttal that come into your head.
As an example of this, your response @913 began @910 with my noting that you are ignoring mountain glaciers which you indicate @911 you are happy to do yet @912 I call it 'airburshing away part of the method.' Your response @913 sets out with this in mind but fails to deliver. Instead we get an account of what you see as failings in Hansen's analyses.
The moderator response @911 suggested it was inappropriate for you to be posting such this work-in-progress down this thread. Given these recent responses of yours are proving so inadequate, I am inclined to agree.
Perhaps then it would be better to ignore direct comment on your analysis and rather ask why you feel any result that were obtained has any bearing on what you call "my point was that the models run too hot."? I ask this becuse you could well be setting yourself to support the opposite.
-
Tom Dayton at 14:42 PM on 17 May 2015New study finds a hot spot in the atmosphere
Tom Curtis: Mike Mann read your most recent response, and replied:
After having read Tom's response to my response at SkS, I'm now not inclined to take the critique too seriously. First of all, his argument that there is little tropospheric IR signal in the Robock radiative forcing series is just wrong. The positive IR radiative forcing anomalies near 300mb (well into the troposphere) at the equator are similar in magnitude to the negative short-wave anomalies at the surface. This is not neglible. He has misinterpreted Figure 1 shown above--this is an adaptation of the key IPCC AR4 figure on fingerprint detection (based on simulations w/ PCM by Santer et al '03). I'm surprised he doesn't recognize it, since it is actually featured in main post at SkS on the hot spot. Over the shorter more recent interval shown in Santer et al '13, the volcanic surface forcing is indeed positive (that is a completely different interval and thus very different drend from the 20th century trend analyzed in Santer et al '03). But the sign of the net surface forcing, whether negative (for the 20th century trend) or positive (for the more recent trend), isn't the point. The point involves the vertical pattern of the response. And there is no way to reconcile that pattern of response w/ the GISS result Tom shows in his plot. Fully recognizing the complicating issue of the TMT/TLT vertical weighting functions (which Santer et al take some pains to deal with in their interpolation scheme) there are real discrepancies here. Just compare the GHG signal in Santer et al '13 (which shows a hot spot) and the volcanic (which doesn't, and shows a change of sign at 500 mb, which is very close to the 595 mb PEAK of the TMT weighting function--if there were a mid-tropospheric hotspot, it should be seen in TMT). That discrepancy cannot be explained away by the vertical weighting functions. So I think I'll go with the CMIP5 results shown in Santer et al '13 over the results of a single (GISS) model, which is certain to have its own peculiarities w.r.t. convective parameterizations, etc. Suffice it to say, I feel comfortable stating that my original post stands without need for any modification. And since Tom C chose to question my qualifications for talking about climate dynamics and climate models, I'll let the roughly 90 of my 170+ publications that deal with climate modeling and climate dynamics speak for themselves.
Prev 578 579 580 581 582 583 584 585 586 587 588 589 590 591 592 593 Next


