


 Arguments


Recent Comments
Prev 585 586 587 588 589 590 591 592 593 594 595 596 597 598 599 600 Next
Comments 29601 to 29650:
-
Klapper at 13:03 PM on 7 May 2015Models are unreliable
All @90x:
I have been reviewing Hansen et al 2011 (http://www.columbia.edu/~jeh1/mailings/2011/20110415_EnergyImbalancePaper.pdf), and think it would be a useful exercise to update this paper with the very latest data on sea ice (from PIOMASS), continental ice melt (from GRACE), atmospheric heat gain (but from TLT, not surface temperature), land heat flux (let's use HadCRUT4 as the delta T flux driver). Here's my first step, atmospheric heat gain (the easy one), using Hansen's method and replicating his work with one slight difference, I used monthly rather than annual data.

You can see the 2 methods don't give a significant difference (you can cross-check my work against Hansen's Figure 12) . You can also see for the recent years, the the atmospheric input is close to zero for both GISS SAT as the delta T and RSS TLT.
Any comments? This looks like a weekend project, but a great learning opportunity all the same.
-
suckfish at 06:02 AM on 7 May 2015Pause needed in global warming optimism, new research shows
Greg,
There are multiple possible causes of what you note.
One is that it is real effect, with the climate having a long term memory of the "hiatus".
Another is that it is purely by chance. It appears to be about 0.25 standard deviations on each line, so no big deal.
Finally, there may be selection bias. A model showing lower warming overall, may be more likely to "by chance" look like the "hiatus" (independently of the overall quality of the model).
I'm not a climate scientist, nor have I looked at the details of how the graphs are constructed, but my first bet would be on selection bias, unless that was specifically corrected for.
Ralph.
-
jimspy at 04:42 AM on 7 May 2015The DENIAL101x temperature tool
Absolutely, positively, completely blown away. Most useful tool since the Robogrip.
-
gregcharles at 04:07 AM on 7 May 2015Pause needed in global warming optimism, new research shows
That's a very interesting graph. I'm surprised, though, that the two models show small but significant differences in predicted temperatures far into the future ... past 2100 for the RCP 4.5 scenario, and until around 2090 for RCP 8.5. I think of the so-called hiatus as being caused by purely temporary phenomena ... basically all those called out in this article. I don't understand how any of those could have long-term effects on global temperatures.
-
Quick at 03:48 AM on 7 May 2015It hasn't warmed since 1998
Tom Curtis@327. I'm in an ongoing "exchange" with a skeptic who believes man's influence is there, but very minimal. He recently posted this:
"The 18 plus years of no warming, and the more than a decade of cooling, are factual data from the current version global satellite lower troposphere temperature anomaly datasets from both RSS and UAH(v6). Atmospheric temperature readings by satellite are NOT "surface station" temperature readings.
Go to woodfortrees dot org and plot the past 18 years, 5 months of RSS MSU/AMSU TLT global temperature and you will see not only has there been no warming for that period of time, but the past 14 years have been progressively cooler, and all are cooler than 1998."
I realize the 1998 cherry-pick, but could you please elaborate on these comments of your's?:
"the UAH trend from 2001 to current is 0.070 ±0.217 °C/decade. That compares to an IPCC projected trend over the interval of 0.2 °C/decade. That is, it is well within error of the IPCC projection. That the error margin on measurement is larger than the projected temperature rise, however, tells you that it is too short a period to test the theory."
What is the trend looking back further...how far previous to 1998 can you go with this UAH trend and what would it be?
"The RSS data should be ignored. It uses the same basic data as UAH but the processing results in values distinctly different not only to UAH, but also to all other temperature records. Until it is found out why that is, and a correction made, it must be regarded as inaccurate for short term trends."
Can you provide more detail on what is different about the data processing which results in distinctively different values for RSS vs. UAH?
-
Jim Hunt at 01:59 AM on 7 May 2015Arctic sea ice has recovered
Continuing an (off topic!) conversation from elsewhere, Cryosphere Today is finally back to normal after its long "hiatus". The "homebrew" calculation from the Arctic Sea Ice Forum was in error by 0.3k.
The official CT Arctic sea ice area is currently 11,796,725 km2 for day 124 of 2015. -
saileshrao at 22:36 PM on 6 May 2015Week 1 of Denial101x: 14,000 students from 159 countries
This is a useful course to understand all other denial phenomena as well. I've been applying the denial Framework to understand how the Animal ag industry has distorted our behaviors. For instance, human mother's milk has 5-6% protein content while the USDA recommends 30% protein in our diet - a Logical Fallacy, since mammalian infants require the MOST protein content in their diets.
Thank you, John Cook and all the faculty of Denial 101X!!! -
Kevin C at 20:23 PM on 6 May 2015The DENIAL101x temperature tool
Difference vs 61-90 average (like HadCRUT4).
I though I'd been so careful to eliminate the jargon term 'Anomaly' from all my graph axes, but there it is again! -
PhilippeChantreau at 16:35 PM on 6 May 2015Models are unreliable
Klaper at 903: BS. Tom Curtis and others make a number of substantive arguments backed by the litterature. If you don't want to address the arguments, it's likely because you can't do so without officially abandoning your pet theory. There is lots to be learned from lectures, by the way. And quantitative arguments have meaning only to the extent that we understand the quantities being argued. In this case, the quantities are physical. Physics always win, eventually.
-
uprightsquire at 13:31 PM on 6 May 2015The DENIAL101x temperature tool
Can it clarify what the anomaly is on the vertical axis? (i.e., 'difference to 1900-1980 avg' or whatever is actually is?)
-
DSL at 11:00 AM on 6 May 2015Heartland takes climate foolishness to a Biblical level
longjohn119, if you see it in the selection of modifications in the writing window, then it's ok.
On the off chance that your comment was void of irony, I'll point out that superiority of the spoken word has not led to its being adopted by science as the primary means of communicating ideas.
-
longjohn119 at 10:25 AM on 6 May 2015Heartland takes climate foolishness to a Biblical level
Are italics Politically Coerrect for emphasis of certian words or phrasse that deserve emphasis? Writing is such a poor way to convey ideas compared to orally
Moderator Response:[JH] The use of italics and/or bold font is acceptable.
-
MarkR at 08:54 AM on 6 May 2015Week 1 of Denial101x: 14,000 students from 159 countries
@5 Andy Skuce: although many would argue that it's has nothing to do with telling people about the course, but is an entirely natural phenomenon driven by a recovery from the non-internet age and anyway it doesn't exist because John Cook invented the data to hide the decline.
-
Rob Honeycutt at 05:27 AM on 6 May 2015The DENIAL101x temperature tool
The only thing that I would wish for relative to this would be to see a pre-industrial baseline and a way to show the 2C limit.
-
Tom Curtis at 04:54 AM on 6 May 2015The DENIAL101x temperature tool
Wow! And thankyou.
-
Andy Skuce at 03:55 AM on 6 May 2015Week 1 of Denial101x: 14,000 students from 159 countries
Alexandre, mid-April was when we started actively promoting the course in the press and on social media.
-
Alexandre at 03:50 AM on 6 May 2015Week 1 of Denial101x: 14,000 students from 159 countries
What caused the surge in enrolments by mid april?
-
MA Rodger at 03:45 AM on 6 May 2015Models are unreliable
Moderator Response @903.
I think accusing Klapper of being "insulting" is a bit strong. I would accept that refusing even to read a replying comment is outrageously discourteous. But my characterising Klapper's comments as "pretty-much wrong on every point" without explanation - now that could be construed as being insulting, although if asked I am happy to provide such explanation.
Klapper @901.
I do not see that I did put words in your mouth. You are on record as objecting to the statement "We have OHC data of reasonable quality back to the 1960s" by saying "I've looked at the quarterly/annual sampling maps for pre-Argo at various depths and I wouldn't agree that's true for 0-700 m depth and certainly not true for 0-2000 m. There's a reason Lyman & Johnson 2014 (and other stuides) don't calculate heat changes prior to 2004 for depths greater than 700 m; they are not very meaningful." If you are stating that pre-Argo 0-2000m data is certainly not of reasonable quality, that trying to use it would be not very meaningful, this can only suggest that you are saying it is not useful data and thus it is junk. And others elsewhere have inferred the same from less well defined statements of your position on pre-Argo OHC data, inferences that did not meet objection from you.
I have in the past seen the early OHC data point maps. Sparce data is not the same as no data, is it?
And if you don't read something, how can you know what it is saying? Indeed, was I "hectoring" @900?
-
bwilson4web at 03:22 AM on 6 May 2015Week 1 of Denial101x: 14,000 students from 159 countries
Any possibility of showing paid vs free registrations?
Like the pig and the chicken who met for a breakfasf of ham and eggs to discuss the farmer. The chicken was interested but the pig was committed.
Bob Wilson
-
Tom Dayton at 03:02 AM on 6 May 2015The DENIAL101x temperature tool
This is an awesome tool! Thanks so much, Kevin!
-
bozzza at 02:53 AM on 6 May 2015Heartland takes climate foolishness to a Biblical level
@10, don't forget 440ppm is locked in!
-
longjohn119 at 02:27 AM on 6 May 2015Heartland takes climate foolishness to a Biblical level
I take it this is mostly a non-US audience here .... Here's a little fact about American Politics that has been true since the 80's ...
During an election year (I'm from Iowa, the first in the nation caucus/primary and believe me the 2016 election is already in full swing mode here) ALL Conservative groups become Religious Based Groups. All you have to do is see who the Republican/Conservative candidates are talking to here in Iowa and it's 90% religous based organizations
When you say "radical right" today, I think of these moneymaking ventures by fellows like Pat Robertson and others who are trying to take the Republican Party away from the Republican Party, and make a religious organization out of it. If that ever happens, kiss politics goodbye.
- Barry "The Last Conservative" Goldwater, 1994 Washington Post interview
-
longjohn119 at 02:17 AM on 6 May 2015Heartland takes climate foolishness to a Biblical level
Corrextion KR
Not just Lobbyists but UNTAXED untaxed weakly Regulated Lobbyists .....
Moderator Response:[JH] The use of "all caps" constitutes shouting and is prohibited by the SkS Comments Policy.
-
longjohn119 at 02:16 AM on 6 May 2015Heartland takes climate foolishness to a Biblical level
Didja ever notice that those who **claim** to believe in Intelligent Design are usually the ones most likely to muck that Intelligent Design all up?
If you believe in Intelligent Design then how could you possibly justify mucking up the Intelligent Design that set CO2 levels for Human existance at ~270ppm by raising it to 400pmm, or in other words an imbalance of nearly 50% from the Intelligent Design?
-
Tom Curtis at 02:15 AM on 6 May 2015Models are unreliable
Klapper @902, science is not arithmetic. Specifically, in science the numbers represent actual states in the world. They have meaning. If you base your arguments on rejecting or ignoring those meanings, as evidently you do, it makes discussion impossible. In this case, you ignore the fact that empirical values must be set by observation, and consequently (apparently) are distressed that I cite observational papers in support of a claim that a particular number has a particular value (897:1); are distressed that I find it necessary to explain the basic meanings of certain scientific terms, and how that relates to a simple quantitative argument (897:2); apparently are distressed about my pointing to a simple observational proof about the meaning of some data (897:3); and are further distressed by my again having to explain some very basic facts about models and their relation to the world (897:4). If you were distressed by my explaining these simple facts, be assured I was extremely annoyed that your logic chopping responses made it necessary. In all my impression is that you are keen to seize on numbers that you think "refute AGW", and are both happy to misrepresent those numbers by willful invalid comparisons (ie, comparing non-equal time periods) to exagerate discrepancies), apparently to leave out numbers that weaken your case (eg, the post 2010 NODC data), and above all, to ignore the meaning of the numbers if understanding it will require you to let go of your argument. If you wish to stop wasting my time by discussing science you clearly do not understand on SkS, be my guest.
-
KR at 01:28 AM on 6 May 2015Models are unreliable
Klapper - After taking a look at your past comments, I would have to agree with scaddenp. You've apparently decided that CO2 warming, AGW, and all climate modelling are somehow incorrect, and have spent considerable time splitting hairs and decimal points attempting to find some reason to reject them.
Most recently you've been rejecting all OHC data before 2005, you've refused to consider recent volcanic activity that has presented a different actual forcing history than was run on the models, both accepted and rejected model drift in the same (contradictory) argument, making impossible claims for perfection by ignoring uncertainties, and have in essence dismissed the fact that models accurately project climate responses to forcings, which can be seen if you use historic forcings (Schmidt et al 2014, also discussed here).
In short, you've been rejecting every piece of evidence contrary to your conclusions while misinterpreting data you feel supports them. The best description I've seen of such confirmation bias is Morton's demon - IMO you are so afflicted, and quite frankly it's not worth the time to watch you run in circles.
-
RobH at 00:36 AM on 6 May 20152015 SkS Weekly Digest #18
Good grief! Monkton is now claiming that global warming is a "political issue" and as such, the Pope should not get involved. Why didnt Monkton tell us this before? I always though it was a matter of science!
-
Klapper at 23:02 PM on 5 May 2015Models are unreliable
@Moderator #902:
"...[JH] If you can't stand the heat, it's best you get out of the kitchen..."
I'm happy to respond/discuss quantitative arguments. They are the only ones from which you learn something. My point was hectoring lectures are a waste of time for both the lecturer and the lecturee. Ultimately our opinions about other people can't change the numbers, can they? Opinion has a place in these technical discussions since oftimes the the numbers are highly subject to interpretation but repetitive judgements on the motive of your opponent is a kind of opinion that doesn't move the discussion forward. If anything they move the discussion backward since you're less likely to pay attention to someone who hectors you.
I came here as a respite from the monotony of righteous opinion at the Guardian, however here it's not much different. In some ways it's worse in that the technical blogs like Skeptical Science tend to be echo chambers and technical opinion, such as you find it at the Guardian, tends to be more free ranging than here.
Hopefully this opinion will be allowed by the moderators.
Moderator Response:[JH] I believe it is time for you to move on to a different venue. You have exhausted our patience and have insulted both Tom Curtis and MA Rodgers. Posting on Skeptical Science is a privilege and not a right.
-
Klapper at 21:58 PM on 5 May 2015Models are unreliable
@Tom Curtis #896:
I did a similar exercise, but using the quarterly 0-2000 OHC from 2005 to 2014 inclusive, calculating a rolling 5 year trend of delta GJ/yr and converting to W/m^2. The average of the W/m^2 for the rolling 5 year trend was 0.69 (OHC to 2000 metres is 0.56 W/m^2, corrected by .58/.47), very close to your 0.71. The average of a rolling mean of the CMIP5 RCP4.5 ensemble energy imbalance was 0.98 W/m^2, the same as your number. So our numbers agree over the most recent period. They both show the models are on the hot side.
You are correct the most recent few years the gain in OHC has pickup up.
I didn't bother reading the last part of your very long winded post #897. It didn't seem to have much quantitative content and if I wanted long hectoring lectures I would be posting somewhere else.
Moderator Response:[JH] If you can't stand the heat, it's best you get out of the kitchen.
-
Klapper at 21:43 PM on 5 May 2015Models are unreliable
@MARodger:
"...to happily junk 90% of it because it doesn't meet some level of precision..."
You're putting words in my mouth I didn't say. What I did say and have said all along is that the new ARGO data are much much better. Have you looked at the 5 year data point maps in question? I didn't bother reading your whole post, just as I didn't bother reading the last part of Tom Curtis #897 for the same reason, it's a none quantitative hectoring lecture.
-
billthefrog at 18:46 PM on 5 May 2015Inoculating against science denial
Rob P & Philippe C
Rob, I've just seen your moderator comment saying enough about vaccines.
In the interim, however, I had emailed one of the Heads of Department at the London School of Hygiene & Tropical Medicine. As it was a Bank Holiday weekend in the UK, his reply only arrived about 30 minutes ago.
Obviously you can delete this, or, since it is verbatim from an authoritative source, you might care to let it stand...
Hi Bill
I'm sure that sanitation helped, but eradication is dependent on a vaccine. Measles is highly transmissable amongst the non-vaccinated, especially when immunisation rates falls below about 85-90%. Above this, herd immunity makes widespread transmission less likely. I had measles as a kid, but don't seem to remember that sanitation was any worse than at present (probably worse in my house at the moment!).
Best
John
Cheers Bill F
-
MA Rodger at 18:26 PM on 5 May 2015Models are unreliable
Klapper @898&899.
It is bizarre that you are happy to present a trace of ΔOHC 1959-2010 @886 then to happily junk 90% of it because it doesn't meet some level of precision that you have decided is required. Indeed, discussing your dismissal of pre-2005 OHC data isn't going to be very helpful if you cannot make a better case for so doing. For instance 'Many orders of magnitude of data density in deep oceans' (which sounds exagerated) can be translated into data uncertainty so it doesn't justify the use of the rubbish bin. Further, inclusion or otherwise of such data is an aside to the central point of this interchange which is the ability of the models to handle the global energy balance.
I am of the opinion that you are pretty-much wrong on every point being presently discussed (as per @891 for instance). I think scaddenp @895 has probably diagnosed the situation. As you continue to protest that you still hold a valid position, the explanations of why you are wrong become ever more detailed & technical but that will probably not be helpful.
There are two things required to establish your "The models run hot" assertion. Firstly that model output is higher than measured values. This is possibly true but not to the large extent that you are arguing. And secondly, that the inputs into the model are not the reason for those higher output values. It does appear that the inputs are the reason for the higher model output and to the extent that the models are probably running cool, the opposite of your position.
-
uncletimrob at 17:24 PM on 5 May 2015Week 1 of Denial101x: 14,000 students from 159 countries
@rocketeer very good, very good!
-
Klapper at 14:20 PM on 5 May 2015Models are unreliable
@Scaddenp #895:
"... (and why is 2014 in age of Argo relevant?)..."
I think you're referring to my comparison of the 5 year '68 to '72 inclusive data density map at 1500 m. I could have given you any 5 year period from 2005 on for the ARGO (i.e. 2005 to 2009 inclusive), but it's not important whether I used 1 year or 5 from the ARGO era, or whether it was 2011 or 2014 or whatever. The point is the data density now in the deep ocean is many orders of magnitude better than the 60's to 90's.
-
Klapper at 14:16 PM on 5 May 2015Models are unreliable
@Rob Honeycut/scandenp #894/#895:
You're complaining not because I didn't utilize the data, which I did, but I think because I don't embrace it as much as I should. It is what it is and I accept that, however, it's not only myself that has doubts about reliability of the data. See these comments from Kevin Trenberth et al 2012:
"...(XBTs) were the main source from the late 1960s to 2004 but, because depth or pressure of observations werent measured, issues in drop rate and its corrections plague these data and attempts to correct them result in varied outcomes.”
Certainly the data are far better with the ARGO collecting system was my key point and that analyses using these later systems should carry more weight than '60s/70's/80's analyses.
-
Tom Curtis at 13:50 PM on 5 May 2015Models are unreliable
Klapper @891:
1)
""...because of recent small scale volcanism (also not included in the models).."
I don't accept that argument."
I really don't care about your propensity for avoiding inconvenient information. Recent papers show that the volcanic effect has influenced temperature trends and and TOA energy imbalance. Thus we have Santer et al (2014):
"We show that climate model simulations without the effects of early twenty-first-century volcanic eruptions overestimate the tropospheric warming observed since 1998. In two simulations with more realistic volcanic influences following the 1991 Pinatubo eruption, differences between simulated and observed tropospheric temperature trends over the period 1998 to 2012 are up to 15% smaller, with large uncertainties in the magnitude of the effect."
"Using an ensemble of HadGEM2-ES coupled climate model simulations we investigate the impact of overlooked modest volcanic eruptions. We deduce a global mean cooling of around −0.02 to −0.03 K over the period 2008–2012. Thus while these eruptions do cause a cooling of the Earth and may therefore contribute to the slow-down in global warming, they do not appear to be the sole or primary cause."
And most directly of all, Solomon et al (2011):
"Recent measurements demonstrate that the “background” stratospheric aerosol layer is persistently variable rather than constant, even in the absence of major volcanic eruptions. Several independent data sets show that stratospheric aerosols have increased in abundance since 2000. Near-global satellite aerosol data imply a negative radiative forcing due to stratospheric aerosol changes over this period of about –0.1 watt per square meter, reducing the recent global warming that would otherwise have occurred. Observations from earlier periods are limited but suggest an additional negative radiative forcing of about –0.1 watt per square meter from 1960 to 1990. Climate model projections neglecting these changes would continue to overestimate the radiative forcing and global warming in coming decades if these aerosols remain present at current values or increase."
If you add the -0.1 W/m^2 additional aerosol load after 2000 to the approximately -0.1 W/m^2 from the the discrepancy between modeled and observed solar forcing, you get a CMIP5 absolute value energy imbalance of 0.72 W/m^2 from 2000 to 2010, ie, only 16% greater than observed (Smith et al), and using drift corrected figures the modelled TOA energy imbalance becomes 14.5% less than the observed values. Forster and Rahmstorf used values from prior to these analyses and so cannot be expected to have incorporated them. Therefore citing Forster and Rahmstorf is not a counter argument. It is merely an appeal to obsolete data.
2) With regard to the SORCE data, the situation is very simple. The SORCE reconstruction is essentially an earlier reconstruction that was benchmarked against PMOD which has been rebenchmarked against the SORCE data. The effect of that it to shift the entire reconstruction down by the difference between the TSI as determined by PMOD, and that as determined by SORCE. Consequently the TOA shortwave down radiation is shifted down by a quarter of that value over the entire length of the reconstruction. Because that shift occures over the entire length of the reconstruction, it means the difference between twentieth century values of the solar forcing and preindustrial values(ie, rsdt(y) minus rsdt(pi), where rsdt(y) is the downward short wave radiation at the tropopause in a given year, and rsdt(pi) is the downard short wave radiation at the tropopause in 1750) does not change, because both the twentieth century values and the preindustrial values have been reduced by the difference between PMOD and SORCE. Ergo there is no appreciable change in the solar radiative forcing in the twentieth century as a result of the difference.
In contrast, for twenty-first century values, the models use a projection so that the difference between (model rsdt minus SORCE value) and the mean twentieth century difference is significant because it does represent an inaccurate forcing in model projections.
The tricky bit comes about in a direct comparison of TOA energy imbalance. In determining the "observed" energy imbalance, Smith et al following Loeb et al adjust the satellite observed rsdt, rsut and rlut so that the net value matches the calculated increase in OHC from 2005-2010, and so as to maximize the likilihood of the adjustments given the error margins of the three observations. Consequently, in all likelihood, they have adjusted the rsdt upward from the SORCE estimate. Therefore when comparing observations to models we are dealing with two adjustments to rsdt. First we have an implicit adjustment in the models that results in the radiative forcing being preserved in the models. This implicit adjustment is equivalent to the average difference between the model rsdt and the SORCE reconstruction. Secondly, we have another smaller adjustment to the SORCE value that results from the benchmarking of the empirical values. Because this adjustment is smaller than the first, it generates a persistent gap between the observed and modelled rslut resulting in a persistent difference in the energy balance.
From the fact that this gap is persistent, the size of the TOA energy imbalance and that temperatures were rising from 1861-1880, it is evident that the gap (and hence the persistent bias) is less than 0.2 W/m^2. I suspect, however, that it is at least 0.1 W/m^2 and probably closer to 0.2 than to 0.1 W/m^2.
3)
""....KNMI climate exporer (sic) are strictly speaking top of troposhere"
What makes you think that?"
The fact that the graph of rsdt shows a clear downward spike in 1992 (Pinatubo) and another smaller one in 1983 (El Chichon). That makes sense with increases in stratospheric aerosols, but is impossible if the data is trully from the TOA (rather than the TOA by convention, ie, the tropopause).
4)
""...CMIP5 forcings are known to be overstated by 0.2-0.4 W/m^2..."
"...Ergo it is jumping the gun to conclude from this that the models are in error."
Both above statements cannot be true. The models according to you are (currently at least) in error. If the models are not in error why do they need to correct the TOA imbalance numbers for model drift?"
By "both of these statements cannot be true", you really only indicateing that you don't understand it. In fact, everytime you said it in the post above, you were wrong.
So, lets start from basics. Climate models are models that, given inputs in the form of forcings produce outputs in the form of predictions (or retrodictions) of a large number of climate variables. When you have such a model, if you feed it non-historical values for the forcings, it is not an error fo the model if it produces non-historical values for the climate variables. So, when we discover that forcings have been overstated for the first decade and a half of the twentyfirst century, we learn absolutely nothing about the accuracy of climate models. We merely rebut some inaccurate criticisms of the models. It follows that the first sentence does not contradict, but rather provides evidence for the second.
With regard to model drift, had you read the relevant scientific paper (to which I linked) you would have learnt that it is impossible to determine without exhaustive intermodel comparisons whether or not drift is the result of poor model physics, too short a run up time or poor specification of the initial conditions. Only the first of these counts as an error in the model. Ergo, you cannot conclude from this that because of model drift, the models are flawed. All you can conclude is that, if you accept that the model drift exists, then you ought to correct for it and that uncorrected model projections will be rendered inaccurate by the drift. Now here you show your colours, for while you steadfastly refuse to accept the dift corrected TOA energy imbalance figures as the correct comparitor, you want to count model drift as disproving the validity of models. That is an incoherent position. Either the models drift and we should compare drift adjusted projections to emperical observations, or they don't drift in which case you can't count drift as a problem with the models.
-
Tom Curtis at 10:50 AM on 5 May 2015Models are unreliable
Klapper, I was looking at the NODC 0-2000 OHC data as a check on the empirical data. Year by year, here is the comparison, with "world" equalling the 0-2000 meters adjusted by a scaling factor based on Smith et al. (The scaling factor is to multiply by 0.58/0.47, or equivalently, divide by 0.81.)
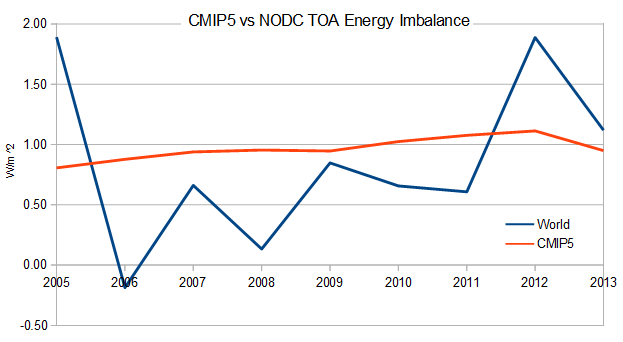
For reproducibility, the 2005 value is based on the difference between the 2005.5 and 2006.5 OHC, which represents therefore the gain in OHC between those periods (ie, the gain in OHC for 2005). Overall, there is an average difference between the models and observation in this period of 0.12 W/m^2.
For comparison, here are the five year means over that period shown in the graph:
Period_____ | CMIP5 | Obs | Diff
2005-2010 | 0.91 | 0.67 | 0.24
2006-2011 | 0.95 | 0.42 | 0.53
2007-2012 | 0.99 | 0.58 | 0.41
2008-2013 | 1.02 | 0.83 | 0.20
2009-2014 | 1.02 | 1.02 | 0.00
Mean______ |0.98 | 0.71 | 0.27The means of the five year means exagerate the discrepancy because they count the middle (low) values more often than the high endpoints.
In any event, it is clear that when you say "The discrepancy from observations to models is currently 48% (0.90 to 0.62 W/m^2 TOA energy imbalance)" it is not true. The discrepancy, if we take the latest five year mean is in fact 0%. Of course, a better observational basis may restore that discrepancy.
-
scaddenp at 08:20 AM on 5 May 2015Models are unreliable
Klapper - all measurement systems have issues. The question to ask is what can be determined from measurements available and to what accuracy. This is dealt with in a number of papers, particularly here. See also supplimentary materials in the Levitus papers on OHC content. What do you perceive to be the errors in this analysis?
Your earlier response on dismissing pre-Argo, simply pointed to sparcity of deeper data (and why is 2014 in age of Argo relevant?). To dismiss 0-700 warming because 700-2000 is sparce however means having a plausible mechanism for 700-2000 cooling while 0-700 heats.
Looking over your posting history, it appears to me that you have made an a priori choice to dismiss AGW and seem to be trying to find something plausible, anything!, for dismissing inconvenient data rather than trying to understand climate. If this is correct, then do you have an idea of what future data might cause you to revise your a priori choice?
-
rocketeer at 07:23 AM on 5 May 2015Week 1 of Denial101x: 14,000 students from 159 countries
The enrolment hockey stick!
-
Rob Honeycutt at 07:21 AM on 5 May 2015Models are unreliable
Klapper... Don't throw the baby out with the bathwater just because he's not reached puberty yet.
-
CBDunkerson at 05:00 AM on 5 May 20152015 SkS Weekly News Roundup #18B
Arctic researchers missing, presumed dead.
Apparently, they (Marc Cornelissen & Philip de Roo) were on a trip to survey the remaining multi-year ice north of the Candaian arhcipelago (projected to eventually be the 'Last Ice' remaining in the Arctic) when they encountered unexpectedly thin ice and their sled broke through and sank.
-
Klapper at 04:17 AM on 5 May 2015Models are unreliable
@CBDunkerson #892:
I used datasets compiled using XBD inputs. As you can see my graph shows ocean heat content changes going back to 1959 (pentadal dataset starts 1957, so a centred 5 year trend first occurs in 1959. However, given the XBT have problems with depth resolution, based on sink rates, they are nowhere near as good as the ARGO floats. Unfortunately the ARGO network only reach a reasonable spatial density in 2004 or 2005.
-
CBDunkerson at 22:37 PM on 4 May 2015Models are unreliable
Klapper wrote: "I don't want 'perfect data', I want the best data."
Great! So what pre-Argo data is there which is better than the XBT results? None? Then guess what "the best data" for that time period is. :]
-
uncletimrob at 21:07 PM on 4 May 20152015 SkS Weekly News Roundup #18A
Of course I can only speak by relaying the conversations I have with my colleagues who are tertiary educated, have families, are articulate and concerned about what they will leave for their children and grandchildren, but the concensus at my workplace - a school - is that Tony Abbott has it wrong, and that the carbon tax whilst unpalatable was a better bet.
Of course the mining industry here in OZ - coal and iron ore principally - has a large input to the economy, so one (coal) is a direct fail for Abbott and "direct action", and the other (iron ore) probably drives the downturn in coal (if I read the various indices correctly).
Just a cheapie from a grandparent, so take it as you will ....
Tim
-
Klapper at 17:13 PM on 4 May 2015Models are unreliable
@Tom Curtis #889 & 890:
"... It follows that minor discrepancies over more recent periods between model predictions..."
I don't think they are minor, I think they help explain the recent lack of surface temperature gain in the observations compared to that projected by the models. The discrepancy from observations to models is currently 48% (0.90 to 0.62 W/m^2 TOA energy imbalance).
"...because of recent small scale volcanism (also not included in the models).."
I don't accept that argument. Forster and Rahmstorf 2011 did multivariate regression on the effects of TSI, ENSO and AOD, albeit against surface temperature, not TOA imbalance, but their Figure 7 shows essentionally no significant effect form aerosols after the mid-nineties (as least compared to ENSO and TSI). You'd be better off to include ENSO in your arguments than small volcanoes as I doubt the latter come close to the effect of the former. I suspect that's your next argument, ENSO deflated the observed TOA imbalance in the first decade of the 21 first century, which the models didn't include.

"...Slight changes in a forcing consistently applied over the whole duration will not effect the anomaly and therefore are not relevant.."
That's a rather astounding statement given it's untrue if you mean that changes in forcing won't affect the delta in the temperature anomaly.
"...You will notice that the multi-model mean is about 0.2 C less than (ie colder than) the observed values..."
Irrelevant. The forcing changes the warming rate, not the baseline which is dependent on the starting temperature/starting heat content. The warming rate in the models is essentially the same as the observations for surface temperature, yet the magnitude of the solar input appears to be approximately 0.85 W/m^2 too high (if we can believe the SORCE TSI reconstruction), in the CMIP5 model inputs. This is a serious issue you chose to treat as if it's not important but it is. Either the models are using the wrong input, or the SORCE 20th century TSI reconstruction is wrong.
"...Further note with respect to your "models always run hot" comment on another thread, in this and many other cases, they run cold..."
Calculate the SAT trend in all of the models and tell me what percentage run "hot" and what percentage run "cold"? Not many of them run cold and we shouldn't waste our time on sematic arguments when the ensemble mean is consistantly above the observations for TOA imbalance. Look at your own table above. The model forcing is higher than the observations in all but 1 of 10 period comparisons to the observations (5 CMIP5, 5 CMIP5 "adjusted").
"....KNMI climate exporer (sic) are strictly speaking top of troposhere"
What makes you think that? Maybe there's an issue with translation from Dutch but the description in the CMIP5 "standar output" document for the "rlut" variable is:
"at the top of the atmosphere (to be compared with
satellite measurements)"And if the "rsdt" varible was Top of the troposphere, it should be lower than the TSI reconstruction, not higher, as some incoming LW would not make the tropopause due to absorption in the stratosphere.
"...(Note again, such a constant offset of a forcing would not affect appreciably changes in anomaly temperature values.)..."
Once again, we are not talking about offsetting forcings, I agree it doesn't matter, we are talking about a difference in the net between input and output TOA, which do affect anomaly values. It is not true the net forcing in the models is the same as the observations.
"...CMIP5 forcings are known to be overstated by 0.2-0.4 W/m^2..."
"...Ergo it is jumping the gun to conclude from this that the models are in error."
Both above statements cannot be true. The models according to you are (currently at least) in error. If the models are not in error why do they need to correct the TOA imbalance numbers for model drift?
I think my next step will be to compare the CMIP5 model TSI input to the ACRIM TSI reconstruction.
-
Tristan at 16:40 PM on 4 May 2015Inoculating against science denial
cormagh - What is the myth, and what is the fallacy?
-
cormagh at 16:14 PM on 4 May 2015Inoculating against science denial
If you're trying to discover what myths might distort the science, why don't you start with The Apocalypse. This comment is directly referencing the article's position, "explain the fallacy employed by the myth."
-
Tom Curtis at 11:20 AM on 4 May 2015Models are unreliable
For completeness, here are the absolute discrepancy at top of Troposphere, the Smith et al corrected values and the Smith et al observed values for the periods listed in Smith et al for comparison:
Period | CMIP5 | CMIP5 (Smith) | Obs (Smith
1861-1880 | 0.29 | xxxx | xxxx
1961-2010 | 0.56 | 0.36 | 0.33
1971-2010 | 0.67 | 0.46 | 0.48
1993-2010 | 0.91 | 0.68 | 0.59
2000-2010 | 0.92 | 0.73 | 0.62
2005-2010 | 0.90 | xxxx | 0.58The factors in play explaining why there is a difference between the Smith et al CMIP5 values and the CMIP 5 absolute values are:
1) The CMIP 5 values as downloaded from the KNMI climate exporer are strictly speaking top of troposhere (or tropopause) values where as Smith et al may have obtained actual Top Of Atmosphere values. The primary differences between top of tropopause and TOA values is that TOA solar values would be slightly higher, as would outgoing longwave radiation (due to the effect of the stratosphere).
2) Smith et al are corrected for model drift.
The primary factors relating to the difference between observed values and the absolute CMIP5 values are:
a) CMIP5 forcings are known to be overstated by 0.2-0.4 W/m^2 relative to anomaly values from the late 1990s onward due to low solar and background volcanic effects.
b) CMIP5 absolute values of solar forcings are known to be overstated relative to observations by an unknown (by us) amount. The amount is unknown in that in benchmarking values for the observations, all three relevant factors may have been adjusted, so that the solar values may have been greater than those from SORCE TIM, but would not have been less than the unadjusted SORCE-CMIP5 discrepancy of about 0.8 W/m^2. This could account for the ongoing high bias of CMIP-5 absolute values. (Note again, such a constant offset of a forcing would not affect appreciably changes in anomaly temperature values.)
c) CMIP5 absolute values apparently need correction for model drift, although I cannot do more than note the stated necessity by relevant experts and refer you to the relevant literature on this point.
Combining these three factors we have an explanation for the increased discrepancy in the 21st century that explains from half to all of the discrepancy observed. We have a further explanation that potentially over-explains the persistent high bias of CMIP-5 absolute values. Finally we have a factor that essentially eliminates the discrepancy prior to the 21st century. If anything, given all this, the models are running too cold relative to known discrepancies.
The important point is not that we have these explanations. With further refinement of observations, the correction factors they imply are likely to shift so that the models are running hot again, or colder. The important point is that the models have run within error of observations, and that there are factors that can explain both short term increases in the discrepancy and long term persistent features. Ergo it is jumping the gun to conclude from this that the models are in error.
-
Tom Curtis at 10:46 AM on 4 May 2015Models are unreliable
Klapper @888:
1) Why are you focusing on the least germain part of my comment? Surely the important thing here is the change in the RSDT discrepancy over the last 15 odd years. The discrepancy over the full period is relevant only in illustrating that models uses observational data of forcings that are approximately 10 years out of date (of necessity given the time it takes to set up and run models, and delays related to publication time). It follows that minor discrepancies over more recent periods between model predictions and up to date data is as likely to be due to the updating of the data as to any problem with the models. In particular, over the last decade or so, we know that model forcings are too large relative to recent observations because of an unpredicted very low solar minimum and recent low solar activity, and because of recent small scale volcanism (also not included in the models). That you have run this entire argument without ever acknowledging this fact, even when it is pointed out to you shows deliberate avoidance.
2)
"How do you explain with this alleged massive error over the whole of the 20th century, they manage to replicate surface temperature as well as they do?"
More specifically with relation to comment my point (1), models predict changes in temperature anomalies. Slight changes in a forcing consistently applied over the whole duration will not effect the anomaly and therefore are not relevant. They are relevant to absolute temperature values, as shown in the side box to this graph:
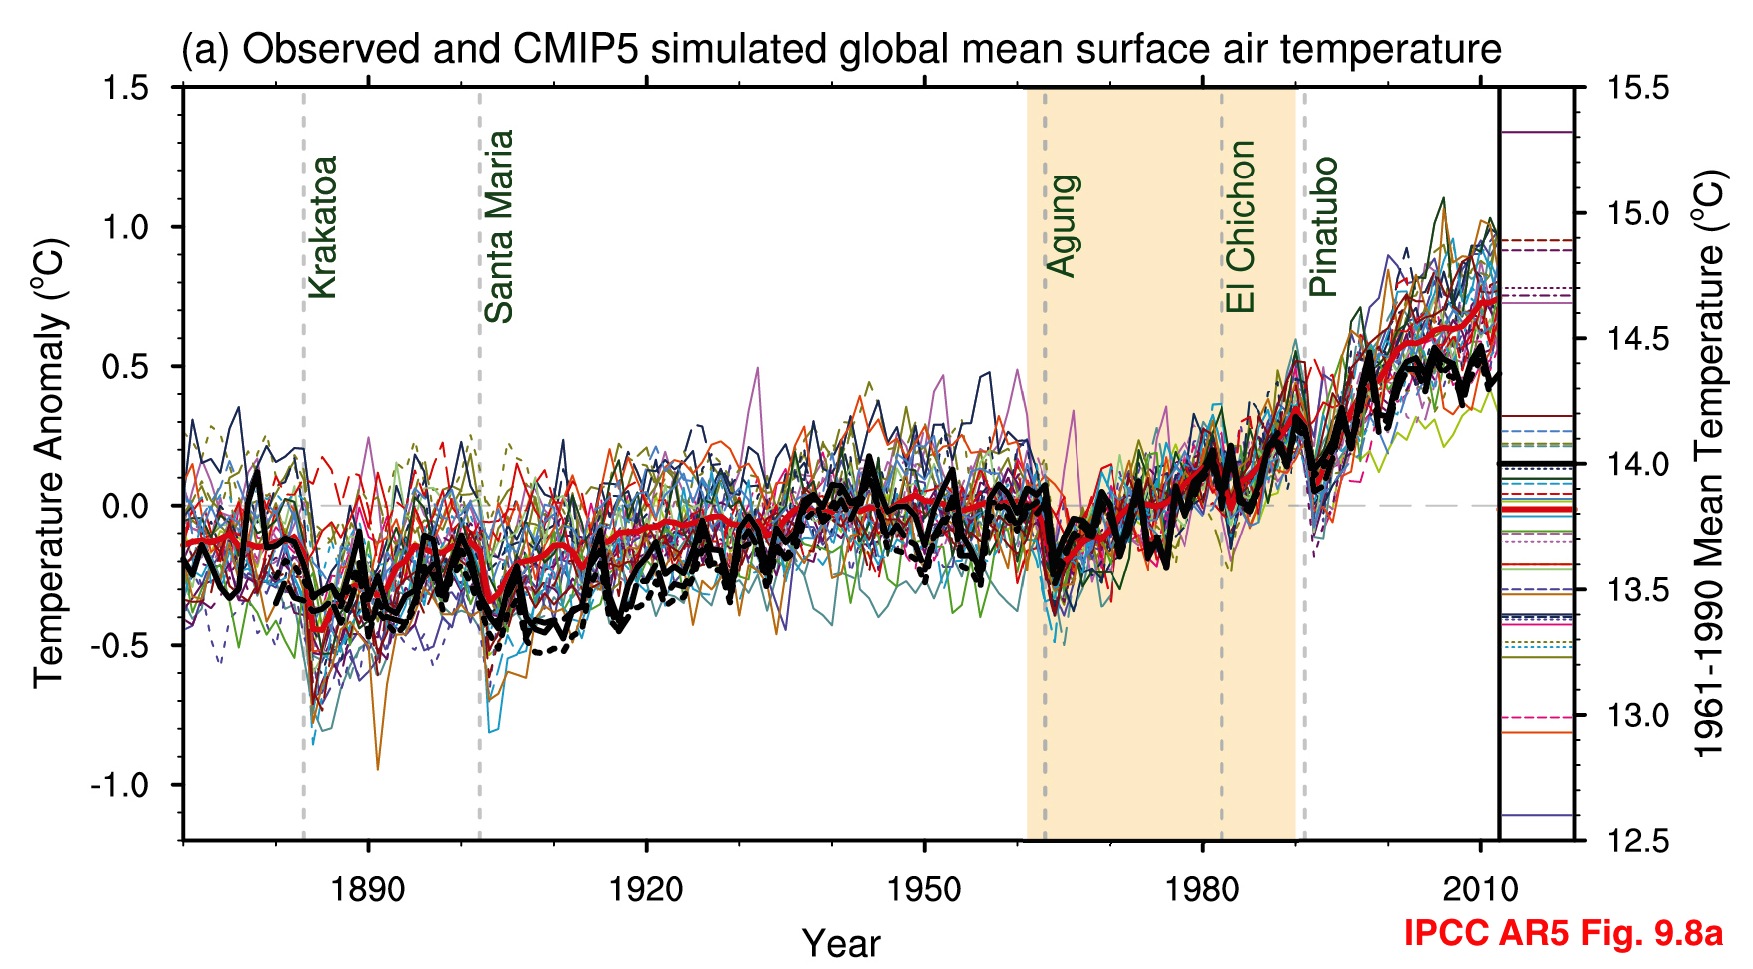
You will notice that the multi-model mean is about 0.2 C less than (ie colder than) the observed values. The primary effect of the 0.8 W/m^2 difference in solar insolation would be to reduce that further by a small amount. (Note as an aside that the absolute value of the GMST is not well constrained by observations. I have seen values of 14 C and 15 C quoted based on different temperature series. Further note with respect to your "models always run hot" comment on another thread, in this and many other cases, they run cold. It is only that deniers cherry pick only those cases where the models "run hot" for their criticisms.)
3) I have clearly linked to Smith et al, who in turn clearly cited Sen Gupta et al on climate drift. I am not going to try to explain it further as I do not understand it well enough. I am going to acknowledge that the relevant experts think it a significant factor and correct for it, and note the corrected values. You on the other hand seem intent on holding it dubious because you couldn't bother doing your own homework.
-
Klapper at 09:53 AM on 4 May 2015Models are unreliable
@Tom Curtis #887:
"... In the late nineteenth century, the discrepancy is about 0.8 W/m^2"
"...Even if we align the two estimates over the late 20th century..."
Yes, the models use a TSI history that is consistently 0.8 to 0.9 W/m^2 higher measured at the earths surface (or 3.2 to 3.6 watts/m^2 of total solar flux) compared to the Source TIM-adjusted reconstruction. How do you explain with this alleged massive error over the whole of the 20th century, they manage to replicate surface temperature as well as they do?
Is this the reason behind the "model drift correction" employed by Smith et al you alluded to earlier?
Prev 585 586 587 588 589 590 591 592 593 594 595 596 597 598 599 600 Next


