


 Arguments


Recent Comments
Prev 629 630 631 632 633 634 635 636 637 638 639 640 641 642 643 644 Next
Comments 31801 to 31850:
-
Tom Curtis at 01:28 AM on 8 April 2015We must defend science if we want a prosperous future
ryland @18, Abbot proudly proclaims his religion, and seek political advantage from doing so. It is only right that he be accordingly judged on the complete inconsistency between Christian ethics, and those of his government's policies.
Moderator Response:[JH] I have deleted Ryland's response to this comment because this "off-topic" discussion has run its course. It's time for both of you to cease and desist.
-
Composer99 at 00:01 AM on 8 April 2015A revealing interview with top contrarian climate scientists
Hmph. Spencer has some nerve white-knighting for the global poor, seeing as atmospheric pollution from coal (beyond greenhouse gas pollution) has terrible effects on health and productivity, and of course the consequences of global warming will fall hardest upon the poor, as described previously here at Skeptical Science.
-
ryland at 23:38 PM on 7 April 2015We must defend science if we want a prosperous future
Tom Curtis. Thank you for your lengthy reply which I will not emulate. Regarding your comment "slamming the Labor party" that is merely a matter of view. What you regard as slamming I regard as providing true facts that can be verified. With regard to the GFC there are many reports that claim Rudd did not save Australia. Below are three references (I can obtain many more of course) to such reports
http://tinyurl.com/lsoe65c; http://tinyurl.com/kee7kq9 and http://tinyurl.com/kn6lfdc. The last one of these is particulary noteworthy as it is from the Guardian a publication that certainly does not support the LNP.
Due to OT concerns I will not address the rest of your comments except to note your bringing Abbott's religion into the discussion is somewhat tacky
-
billthefrog at 22:31 PM on 7 April 2015A revealing interview with top contrarian climate scientists
In comment #2, Phillippe makes reference to a certain Frank Lutz. This is a name that will be familiar to many readers of SkS.
For those newer to the game, Lutz is (was?) a political advisor, amongst whose illustrious contributions to the welfare of the planet, was the infamous "Lutz Memo". This, basically, was a playbook for the Grand Old Party advising how to deal with questions pertaining to the environment.
For those wishing to take a quick dekko, it can be seen here.
Happy reading
cheers bill f
-
CBDunkerson at 21:52 PM on 7 April 2015A revealing interview with top contrarian climate scientists
BojanD, ummm... the "50 years" bit is a quotation >of< Christy.
So yes, you are correct... the study actually said 150 years, but it was Christy who got it wrong, not Dana.
-
BojanD at 20:51 PM on 7 April 2015A revealing interview with top contrarian climate scientists
"Is man the dominate controller of climate over the last 50 years"
Actually the question was about the last 150 years, which makes quite a difference as far as attribution statement is concerned. The authors of the study suspected that this was the reason for some of the discrepancy. Interesting that Dana has missed this. Not surprising that Christy hasn't.
-
MA Rodger at 18:42 PM on 7 April 2015A revealing interview with top contrarian climate scientists
Christy does leave one statement hanging in the air. He says:-
"People who come out with different views in their organizations (ie the NASA, NOAA, EPA, DOE) are found to be squashed."
If they are "found", we can give them names. Who are these "people"? Do tell us John Christy!! Demonstrate you speak grown-up words and not puerile nonsense!!
-
OfNoAccount at 17:54 PM on 7 April 2015We must defend science if we want a prosperous future
I am old enough to have passed the obstacle of counter-intuitive propositions being closer to the way things are than the common sense consensus establishes.
The observations and deductions made from them and the mathematical modelling of them was bread and butter for my generation. Heliocentrism, elliptical orbits and so forth were scientific orthodoxy. But they are all wrong in fact. The sun is moving rapidly, the planets are going around it corkscrew wise and none are actually undergoing Newtonian motion at all. The material universe is not matter, energy and space. If we exist at all it is in a space/time continuum pervaded by the presence of stuff of which we are made and which can only be located by probability functions and field vectors and these omit the vast majority of the existent which we think of as having fallen into black holes or have to use poetry to name as dark matter and dark energy.By now, however, I have a different problem. I am not confident that what is being published as science is truthful. A vast proportion of the purported science is opinion and/or interpretation which fails to be matched by the data and analysis which is used as the reason justifying publication and demanding serious consideration.
In my youth, original science was done in Universities and pathways were followed for the intrinsic interest or importance by passionate investigators who distinguised between findings and theories easily and automatically. Now it is done by Santa's little helpers in the employ of impersonal institutions who have ulterior motives for directing which questions to pursue and vested interests in either positive or negative results depending on the significance of their economic interests or academic status or public esteem.
Good work is hidden as commercial in confidence secret or so geopolitically sensitive as to be state secrets - (military mathematicians disappear from the maths community never to be heard of again, a personal experience).
One comentator wonders if climate denial should be outlawed as immoral, I match that by recommending the opposite that human induced biosphere threatening global warming from use of fossil fuel urgency is like calling out fire in a darkened cinema.Where does responsibility for this lie and how might this be addressed?
Moderator Response:[PS] Welcome to skeptical Science. Please take some time to read the Comments policy, and in particular note the prohibition on accusation of fraud or dishonesty. I frankly find your views somewhat extraordinary and rather than speculate on what informs your opinion, I would kindly ask you to provide evidence to back your assertions. Since this is a science site, then perhaps you could in particular provide an example of "purported science is opinion and/or interpretation which fails to be matched by the data and analysis" and do so on an appropriate thread.
Please note that posting comments here at SkS is a privilege, not a right. This privilege can be rescinded if the posting individual treats adherence to the Comments Policy as optional, rather than the mandatory condition of participating in this online forum.
Please take the time to review the policy and ensure future comments are in full compliance with it. Thanks for your understanding and compliance in this matter.
-
Glenn Tamblyn at 17:03 PM on 7 April 2015It hasn't warmed since 1998
Further to an earlier comment by Peter99
"Seems to me that AGW is unfalsifiable. When temperatures were rising in the 1990's that was proof of AGW, but now that temperatures have plateaud so far this century, the "proof" of AGW moves elsewhere."
You seem to be misunderstanding falsifiability. Key to it is the making of reasonable predictions, understanding the accuracy with which the prediction can be made. Then evaluating all the available data to compare with the prediction. Several key things need to be considered:
Is the theory making a simple black and white prediction; is that a valid statement of the theory? Or is it predicting results within a range of values?
What range of results constitute validation of a theory? What range of results an invalidation? Is there a black-and-white distinction between the two or shades of grey?
Is the nature of the theory such that a failure to completely meet every prediction should be taken as an indication of the total failure of the theory. Or are there degrees of failure and degrees of prediction.
Falsifiability is a great idea but when treated as too black-and-white a criterion it becomes practically useless in many real world scientific contextx. Very few situations lend themselves to black-and-white arguments
So to your question: "One last question...If global temperature increase stays at the present near zero rate until 2100, will the theory of AGW need revision?"
Yes.
But which part of the theory? The part of the theory dealing with Radiative Heat Transfer, Planetary Energy Balance, the Greenhouse Effect etc.? Or the part of the theory dealing with Oceanography, heat distribution in the ocean, ocean overturning time etc?
What if air temperatures don't rise by 2100 but ocean heat content, sea level etc. do rise? Which part of the theory needs to be revised?
You seem to be trying to reduce a complex question down to the idea of the simple black-and-white falsifiability of a single, indivisible theory. When the reality is of a set of multiple intersecting theories, each contributing to the overall conclusion, and complex layered observations that they are being tested against.
Popperian Falsifiability is an important ideal in science; as an ideal! Highly applicable in simple contexts, less useful in more complex situations.
As with most areas in life, basic principles derived from a black-and-white world view only become useful when translated into a shades-of-grey world view. Till then they remain mere idealisations.
-
Glenn Tamblyn at 16:37 PM on 7 April 2015It hasn't warmed since 1998
Peter99
You left off some other quotes from the piece:
"Scientists at NASA's Jet Propulsion Laboratory (JPL) in Pasadena, California, analyzed satellite and direct ocean temperature data from 2005 to 2013 and found the ocean abyss below 1.24 miles (1,995 meters) has not warmed measurably. Study coauthor Josh Willis of JPL said these findings do not throw suspicion on climate change itself.
"The sea level is still rising," Willis noted. "We're just trying to understand the nitty-gritty details."
"Coauthor Felix Landerer of JPL noted that during the same period warming in the top half of the ocean continued unabated, an unequivocal sign that our planet is heating up. Some recent studies reporting deep-ocean warming were, in fact, referring to the warming in the upper half of the ocean but below the topmost layer, which ends about 0.4 mile (700 meters) down. "
Note that these quotes are attributed to the study authors. Your earlier quotes in contrast are commentary by the author of the NASA news release with no attribution to the actual study authors.
You said there was a NASA report. Rather it looks like there was a study conducted by scientists from NASA and published in the scientific literature in the normal way. Then the NASA media unit published a news report highlighting the study. Not a NASA report. And maybe the NASA journalist got some stuff wrong!Like in particular, that the common suggestion of warming occurring 'deeper' has always referred to the lower levels of the upper half of the ocean. Specifically below 700 meters but above 2000 meters. There has been no significant suggestion that meaningful warming is occuring in the lower half of the ocean, below 2000 meters. And this study provides support for that view.
-
Tristan at 15:25 PM on 7 April 2015It hasn't warmed since 1998
It doesn't really matter whether or not you think my explanation is 'one of sixty or so'. There are numerous oscillatory systems at play in weather, from the very short term (day/night) through seasonal differences and the decadal scale PDO (which is responsible for a lot of the year to year climate variation).
You need to learn the meaning of statistical significance before you start making claims about it, lest you look silly.
The trend (GISTEMP) for 1995-2010 is
+0.138 +/- 0.147 c/dec. Because the number after the +/- (the 2 sigma error) is larger than the number before it (the trend), you cannot statistically exclude zero.
The trend (GISTEMP) for 1995-2015 is
+0.113 +/- 0.092 c/dec. Because the error is smaller than the trend, you can statistically exclude zero.
Hence. To 2010 there is not 'statistically significant warming' and to 2015 there is.
-
PhilippeChantreau at 13:39 PM on 7 April 2015A revealing interview with top contrarian climate scientists
Nothing new under the sun. In the old Soviet Union, when asked some questions about a certain incident, leaders responded "in our camp, airplanes don't crash." In the denial camp in the US nowadays, it's "you can't say the word se-level rise." Exactly identical attitude, but even worse. It's not like saying "airplanes don't crash", it's more it "you can't say the word plane-crash." Beyond insane.
It is especially ironic that, after all the grief climate scientists received in the Bush administration, the failed attempts from Cuccinelli to intimidate Mann and the nonsense from certain coastal states, S&C have the nerve to say that skeptics are being slienced. This is another tried and true method from the Lutz/Rove manual of practical BS for mass manipulation. Accuse your opponent of doing exactly what you're doing, preferably send the accusation first; if not, just be really loud and whiny about it. Works every time. The BS wars in the US have got to the point where it takes a fair level of sophistication, research and time to figure out the reality, none of which is within reach of the vulgum pecus. The natural result is a reinforcement of the existing tendency to take refuge in what we prefer to believe anyway. Reality has no chance in a debate these days. It will win eventually, in the most painful fashion.
-
citizenschallenge at 13:34 PM on 7 April 2015We must defend science if we want a prosperous future
If you found this interesting you'll want to read Lawrence Torcello I believe he does a better job of cutting to the chase:
March 13, 2014 also at The Conversation
"Is misinformation about the climate criminally negligent?"
https://theconversation.com/is-misinformation-about-the-climate-criminally-negligent-23111
Climate denial funding
We have good reason to consider the funding of climate denial to be criminally and morally negligent. The charge of criminal and moral negligence ought to extend to all activities of the climate deniers who receive funding as part of a sustained campaign to undermine the public’s understanding of scientific consensus.
Criminal negligence is normally understood to result from failures to avoid reasonably foreseeable harms, or the threat of harms to public safety, consequent of certain activities. Those funding climate denial campaigns can reasonably predict the public’s diminished ability to respond to climate change as a result of their behaviour. Indeed, public uncertainty regarding climate science, and the resulting failure to respond to climate change, is the intentional aim of politically and financially motivated denialists.
My argument probably raises an understandable, if misguided, concern regarding free speech. We must make the critical distinction between the protected voicing of one’s unpopular beliefs, and the funding of a strategically organised campaign to undermine the public’s ability to develop and voice informed opinions. Protecting the latter as a form of free speech stretches the definition of free speech to a degree that undermines the very concept.
What are we to make of those behind the well documented corporate funding of global warming denial? ... Lawrence Torcello
http://whatsupwiththatwatts.blogspot.com/2015/04/premeditated-climatescidenial.html
-
Tom Curtis at 08:04 AM on 7 April 2015We must defend science if we want a prosperous future
ryland @12, I almost did not respond to chriskoz because doing so was a clear violation of the comments policy requirement of "no politics". Responding to you will clearly violate that rule even further, especially if I give the sort of detailed response that is appropriate. None-the-less I feel compelled to respond to your claims lest my lack of response falsely indicates an inability to respond. Out of respect to the comments policy, however, I will limit myself to bullet points rather than a full rebutal:
- As Tristan has already noted, you ignore the content of my claims so that you can slam the Labor party. You also ignore that I spoke regarding policy rather than administration of policy (where I do not rate the Rudd/Gillard governments highly, though that are better than the Abbot government in that regard).
- The cash handout was a direct response to the GFC, being designed to maintain consumer confidence in the face of the GFC to avoid a collapse of retail sector employment. It was successful in its aims. Suggestions that the mining boom helped in that specific aim are absolutely refuted by the fact that after the GFC, the mining boom created pressure on the retail sector due to the "two speed economy".
- The "Pink Batts" scheme represented only 10% of a larger scheme that was a resounding success overall. Further, the "Pink Batts" scheme is considered a disaster largely due to the deaths of four people, purportedly due to maladministration by the Federal Government (despite the WHS aspect already being covered by state legislation). Of those deaths, the first occurred when an experience electrician electrocuted himself. Given that he was an experienced electrician, the claim that his death was due to insufficient training is absurd. The second was when an apprentice carpenter ignored regulations requiring the use of plastic (non-conductive) staples and electrocuted himself by using his own metal staples. When somebody ignores regulations and training and thereby gets themselves killed, that is not the fault of the regulatory body. The third was a person electrocuted because they made contact with a screw that prior workers (ie, prior to the installation he was involved in) had driven into electrical wires, ie, of an unfortunate happenstance that training would not have helped avoid. The forth was of a person "filling in for his mate" who therefore did not have the training the scheme required, who having suffered heat problems and being asked to wait outside of the roof cavity by his supervisor because of it, went back into the cavity unknown to anybody and died of hyperthermia. The only way the Federal government could contributed to avoiding these deaths would have been by duplicating state regulations, and intensively regulating the activity - both policies their critics strongly object to - objections, however, that seem to evaporate when they had an opportunity to make political hay out of the Pink Batts scheme. This is not to suggest the scheme was perfectly administered (it was not). However, claims that it was an "unmitigated disaster" depend either on ignorance, or unprincipled ignoring of their fundamental political principles by those critics.
- The Building the Education Revolution (BER) scheme was a scheme to maintain employment in the building sector durring the GFC. Benefits to education were explicitly a secondary consideration, and opportunistic. Despite that, over 98% of the facilities built under the scheme were welcomed by the schools in which they were built, and improved the facilities available at the shool. In about 1% of cases this was not the case. That 1% was focussed on by critics, who ignored the successes in what was overall an exemplary scheme. Further ignored by critics was that even the failures came about because of cumbersome state based administration of the scheme, especially in NSW. Again, the Federal government could have avoided those problems only by microregulation and duplication of state based regulation and bureacracy.
- Finally, the assylum seeker policies inheritted by the Abbot government were less onerous versions of those inherited by the Rudd government from the Howard government (in which Abbot was a minister). Your little sally without mentioning that fact is somewhat duplicitous. Further, I do not consider increasing deaths of persecuted people in the land of their persecution a preferrable outcome to the lower number of deaths by drowning resulting from people attempting to find refuge in Australia. Nor (and this is a value judgement) do I rate the importance of the suffering of people on a scale depending on the colour of their skin, or the remoteness from our shores. Therefore I consider the current international system in which the vast majority of refugees are left to rot in third world countries in inadequate facilities acceptable. For that reason I applaud the Abbot governments increase of the standard refugee intake (inadequate as it still is), but deplore the assylum seeker policy of both major parties.
I will not further respond on any of these issues due to the comment policy.
-
Tom Curtis at 07:18 AM on 7 April 2015Climate sensitivity is unlikely to be less than 2C, say scientists
Theo168 @7, you are assuming that the authors are more influenced by political expediency than by scientific merit. If they are more influenced by the later, it is the scientific merit of the comments they recieve that will influence them the most.
You are also neglecting that my comment @6 was a rebutal of a claim that governments control the contents of the IPCC reports, and also that I had previously rebutted (@4) the idea that the reports significantly differ from the consensus position of relevant experts.
-
jackdale at 07:09 AM on 7 April 2015A revealing interview with top contrarian climate scientists
Some more telling statistics on the AMS survey.
only 4% of the participants said global warming is not happening
only 5% of the participants attributed global warming to mostly natural causes
-
Stephen Baines at 04:55 AM on 7 April 2015Sea Level Rise is Spiking Sharply
What is more interesting is that the Equatorial heat content has risen now to a level similar to that seen last year. NOAAs says there is a greater than even chance the El Nino holds through the summer. In fact, this uncertainty reflects a strong split between statistical models, which suggest a return to neutral conditions, and dynamic models, which generally predict emergence of strong El Nino conditions late spring to early summer.
-
Stephen Baines at 04:42 AM on 7 April 2015Sea Level Rise is Spiking Sharply
OK...now NOAA is officially categorizing this as an El Nino period...by the skin of it's equatorial teeth.
-
Theo168 at 03:35 AM on 7 April 2015Climate sensitivity is unlikely to be less than 2C, say scientists
Tom Curtis, you are confusing influence with control.
The response to feedback from a Govt body will more than likely be different than from a random self identified "expert". You don't have to be 'in-control' to get what you want.
-
DSL at 00:41 AM on 7 April 2015It hasn't warmed since 1998
Peter, you're also letting others lead you on. Read the full discussion surrounding those quotes:
1. Trenberth, when using the word "travesty," was engaged in discussing his recent paper "An Imperative for Climate Change Planning: Tracking Earth's Global Energy" (Trenberth 2009). Here's the abstract:
"Planned adaptation to climate change requires information about what is happening and why. While a long-term trend is for global warming, short-term periods of cooling can occur and have physical causes associated with natural variability. However, such natural variability means that energy is rearranged or
changed within the climate system, and should be traceable. An assessment is given of our ability to track changes in reservoirs and flows of energy within the climate system. Arguments are given that developing the ability to do this is important, as it affects interpretations of global and especially regional climate change, and prospects for the future."
In other words, Trenberth was calling our ability to track energy in the climate system a "travesty." We need better measures of deep ocean heat content, for example. If you just read the quote from some "skeptic" site, then shame on you for not digging for context.2. Phil Jones. He was answering honestly. The trend was not statistically different from zero. It was also not statistically different from the expected trend. Guess how it was portrayed by those who wish to turn doubt into profit? Again, if you took it hook, line, and sinker, without checking out what "statistically significant" means, and without taking Jones at his word in response to the flabber that followed, then shame on you.
3. Hansen. Be careful: "slowdown in the growth rate of net climate forcing" is not equal to "global warming has stopped/slowed." It may mean that forcing from greenhouse enhancement remains steady but aerosol forcing has increased. What does it mean to you, after having read Hansen's full statement? Or have you read it . . .
4. Von Storch has already been addressed.
-
DSL at 00:27 AM on 7 April 2015It hasn't warmed since 1998
And yes, Tom, I know we can argue about what exactly is contained within the "theory of AGW," but I don't think it applies in this case. I think it's best to establish that the greenhouse effect is pretty solid, and that we are enhancing that effect. If Peter will oblige us by accepting those two propositions, we can move much more quickly into areas with greater uncertainty (e.g. modeling). I would like Peter to do what many "skeptics" find so hard to do: recognize and accept the basic science.
-
DSL at 00:21 AM on 7 April 2015It hasn't warmed since 1998
Peter: "So my question is, if the pause continues, how many years must pass before it’s conceded that “something is fundamentally wrong with our climate models”? In other words, if the pause continues for n years then can that then be classed as a falsifiable criterion for AGW?"
Peter, let's not be ham-fisted about this, eh? The greenhouse effect is extremely well-established. It's been directly measured from the surface. And I don't think you want to argue that humans aren't responsible for most, if not all, of the increase in atmospheric CO2 over the last century. The general theory of AGW is not going to be falsified by the trend in surface temperature. CO2 does what it does. We have done and are doing what we've done and are doing.What the trend in surface temp tells us is how well we've modeled energy circulation for Earth's climate system. It also helps us understand climate sensitivity past and present. If the surface trend goes flat or negative for thirty years, then it will indicate that we are missing a major factor in the climate process. If ocean heat content also goes flat for thirty years, then we've likely completely misunderstood the process.
Note that OHC (in the link I posted earlier) in no way shows a "pause." The oceans are still rapidly accumulating energy, and the oceans are 93%+ of the thermal capacity of the climate system.
As Tom has pointed out, and as several of your quotes--in fuller form--point out, drawing conclusions from a surface trend is tricky business. When does the thirty-year trend start? 1998? Not statistically sound, as Tom has pointed out. Trend is negative from x to y (a period of between 6 and 10 years)? So what? Happened before, as I pointed out. Trend is not statistically significant? Ok, but what exactly does that mean? Does it mean that the trend is not statistically distinguishable from zero, or does it mean that it's not statistically different from well above the expected trend? Both. It doesn't mean there's no trend (i.e., it doesn't mean what you think it means).
Your interest seems to be "falsifying AGW" rather than understanding the science. You shouldn't attack something you don't understand. Understanding the theory of anthropogenic global warming by working backward from the surface trend is a bad idea. You should start with the basics. When you start with the basics, you'll know what is "settled science" and what is still being actively researched.
In this latest comment, you're basically repeating the same argument. Tom has answered the question you just asked, and in detail. If you repeat it again, without recognizing what has been said in response, your posts will be in violation of the SkS posting policy.
-
Tristan at 23:48 PM on 6 April 2015It hasn't warmed since 1998
Peter, there is no 'pause' in any meaningful sense. CO2 hasn't magically stopped re-radiating thermal radiation.
Tom's graph demonstrates the illusory nature of the pause. Things can look like 'pauses' when you have an oscillation (weather) overlaid on a gradient (climate). Just because you can draw flat or negative lines starting from certain peaks to certain troughs doesn't mean that the underlying gradient has changed.
You will note that if you asked that exact question of Phil Jones today, he would be able to answer "since 1995 there has been statistically significant warming in the Surface Temperature Records". At some point within the next 5 years, you'll be able to say the same thing about 1998, and then the so-called skeptics will have to completely reject the surface temperature records, as they will no longer be convenient. Is that the team you want to be on, Peter? -
wili at 22:11 PM on 6 April 20152015 SkS Weekly News Roundup #14B
"Climate sensitivity is unlikely to be less than 2C, say swientists"
Please correct this article title (unless you're talking about people who study 'swien'!?).
Moderator Response:[BW] Thanks, Fixed!
-
Peter99 at 21:59 PM on 6 April 2015It hasn't warmed since 1998
Global temperatures seem to have plateaud. It is not only skeptics saying this, but many prominent warmists such as…
Dr. Kevin Trenberth – CRU emails – 12 Oct. 2009
“Well, I have my own article on where the heck is global warming…..The fact is that we can’t account for the lack of warming at the moment and it is a travesty that we can’t.”Dr. Phil Jones – BBC – 13th February 2010
[Q] “Do you agree that from 1995 to the present there has been no statistically-significant global warming”
[A] “Yes, but only justDr. James Hansen – NASA GISS – 15 January 2013
“The 5-year mean global temperature has been flat for a decade, which we interpret as a combination of natural variability and a slowdown in the growth rate of the net climate forcing.”Notice they all acknowledge the pause and Hansen gives his “pause” interpretation. But apart from Hansen’s theory, there have been over 60 other different theories/reasons trying to explain where the “missing heat” has gone. But which one is correct? If the science is settled why are there so many and varied theories?
Hans von Storch is no AGW lightweight and to dismiss his quote above as “careless” is a bit presumptuous. Let me repeat the quote…
Dr. Hans von Storch – IPCC lead author - Spiegel – 20 June 2013
“…the increase over the last 15 years was just 0.06 degrees Celsius (0.11 degrees Fahrenheit) — a value very close to zero….If things continue as they have been, in five years, at the latest, we will need to acknowledge that something is fundamentally wrong with our climate models….”“So far, no one has been able to provide a compelling answer to why climate change seems to be taking a breakDid a very senior IPCC author get it wrong? If the pause continues for another 5 years will it be acknowledged that climate models have a fundamental problem as he claims? He obviously doesn’t think any of the 60 or so “missing heat” theories are “compelling”.
So my question is, if the pause continues, how many years must pass before it’s conceded that “something is fundamentally wrong with our climate models”? In other words, if the pause continues for n years then can that then be classed as a falsifiable criterion for AGW?
Moderator Response:[JH] You are now skating on the thin ice of excessive repitition which is prohibited by the SkS Comments Policy.
Please note that posting comments here at SkS is a privilege, not a right. This privilege can be rescinded if the posting individual treats adherence to the Comments Policy as optional, rather than the mandatory condition of participating in this online forum.
Please take the time to review the policy and ensure future comments are in full compliance with it. Thanks for your understanding and compliance in this matter.
-
Tristan at 14:28 PM on 6 April 2015We must defend science if we want a prosperous future
ryland@12
TC's posit was that "[on certain recent issuses] evidence from experts clearly favours the position adopted by the ALP, or more left wing parties (in the case of refugees)"
To refute that, you need to show that expert opinion on global warming, NBN and the response to the GFC is counter to ALP policies, and that expert opinion on handling asylum seekers is counter to the Greens policies.
-
amhartley at 05:47 AM on 6 April 2015We must defend science if we want a prosperous future
Mbryson,
You seem to have some inkling of what I’m talking about with the non-inferential nature of standard statistical results, although since you express interest I’ll be more specific.
Most people, both statisticians & others, interpret a p-value (p) as the post-experimental probability of the tested hypothesis; if that interpretation were accurate, it would be inferential, because it’s a statement about the hypothesis based on data. However, the p-value is defined as
The probability, in a hypothetical repetition of the experiment that was performed, of results at least as extreme as those observed, assuming the boundary between the tested hypothesis & the alternative hypothesis.
So, strictly speaking, p is a probability about data, not about a population or a hypothesis.
Only sometimes does p come close to providing an inferential probability. Unfortunately, those conditions are not widely known.
I don’t think we should go too far afield, though, in this thread, from the Jones article; would you like to take a discussion about statistical inference off-line?
-
ryland at 03:25 AM on 6 April 2015We must defend science if we want a prosperous future
Tom Curtis. I am surprised at some of the examples you give to illustrate that left is best. In Australia the actions of the Rudd government in indiscriminately handing out $900 cheques to all and sundry including back packers, deceased Aurtralians and Australians living overdeas, benefitted China much more than Australia. The "Pink Batts" scheme was an unmitigated disaster. The BER spent tens of millions of dollars of taxpayer funds long after the GFC had passed . The cost benefit of NBN was never published (was there ever one?) and as has been very clearly shown by the current managementm the roll out was minimal and marred by extremely poor management. Who can ever forget Steven Conroy and his remarkable red underpants comment?
As for asylum seekers the detention policies currently in force were instituted not by the Abbott government as you imply but by the Rudd government in July 2013. The much maligned and excoriated "Stopping the boats" policy has reduced the number of asylum seeker deaths at sea to three from December 2013 to the present to three. Compare this with the 208 deaths at sea from December 2012 to September 27th 2013 (20 days afterAbbott was elected), the 242 in 2012, the 330 in 2011, the 71 in 2010 and the 171 in 2009. And of course the Abbott government has reduced the number of asylum seeker children in detention from just under 1400 when elected to about 200 now. By any standards these figures show the policy of the "right wing Abbott" government has done far more to reduce asylum seeker death and detention than anything the Rudd/Gillard/Rudd governments ever did. It is very unlike you not to base your arguments on fact and I am rather surprised that you have done so here.
-
mbryson at 03:20 AM on 6 April 2015We must defend science if we want a prosperous future
@amhartley: There's nothing wrong with statistical inference if our samples are representative of the population to the degree statistics requires (that is, if we can fairly treat the sample as if it were a truly random selection from the target population). There are conditions under which this assumption has proven extremely reliable— and, of course, conditions under which it isn't. Serious scientists, whether in medicine, physics, biology or psychology, are aware of this and deal with it. You claim statistical reasoning is "not inferential" (an odd phrase, which I can only intepret as a very general claim that the premises of such reasonings (facts about a sample) don't really support the conclusions (statisitical claims about the probable level or distribution of certain traits in the population). But there is no justification for such a generally dismissive view short of Hume's skepticism about induction--a result Hume himself forthrightly acknowledged would never lead us to stop relying induction.
-
amhartley at 03:01 AM on 6 April 2015We must defend science if we want a prosperous future
This piece seems to hold up (respect for) science as the solution to global warming skepticism, lamenting the attacks (in Australia, but elsewhere too) on “the Enlightenment tradition.” The last subtitle, “Science at the Core,” could be interpreted in a variety of ways, but any implication that science can serve as the core guiding principle must be avoided. A danger lurks in expecting too much from science & that Enlightenment tradition; in Dutch theology, this expectation has been called “scientism.” Any “ism” exaggerates the place & influence that an activity can take in understanding & solving problems; scientism, in particular, exaggerates the roles science can file.
In a book in 2008, “Christian and Humanist Foundations for Statistical Inference,” I showed that scientism has led to unrealistic, even mathematically unjustified expectations regarding statistical results such as p-values & confidence intervals (CIs). Mathematically, these results are statements about observable data, whereas statistical inference requires us to extend conclusions beyond data to larger groups (“populations”) & general hypotheses. Therefore, they are not inferential. Yet, the Enlightenment spirit drives the generators & consumers of p-values & CIs to take these results as inferential. The syllogism, implied in standard statistics courses, is that
1. statistical inference is an objective exercise,
2. p-values & CIs are objective statistical results,
3. therefore, p-values & CIs are inferential
In other words, if one has only a hammer, then when one encounters a screw, the hammer starts looking like a screwdriver.
We must guard against expecting too much from science in stemming global warming, or even GW skepticism, as well. Science is not the solution; it is incomplete on at least three fronts. First, by itself (without any defensible call for compassion, justice & so on), it gives the present-day First World countries, who benefit most from CO2 emissions, no reason to reduce those emissions. Secondly, it’s impotent to transfer the loyalties of those Kahan et al. (“The polarizing impact of science literacy and numeracy on perceived climate change risks,” Nature Climate Change 2012) called “hierarchical individualists” from the communities with whom they hold close ties, to any larger group (such as poor countries or future generations) or to acceptance of scientific findings. Thirdly, & most importantly, by itself, science cannot decouple, in people’s views of themselves, the perception of prosperity from economic growth. According to the consumerist worldview that controls most of us, perceived prosperity (my impression that I’m happy, well, successful & so on) demands that growth, & (absent marked improvements in eco-efficiency) thereby leads inexorably to increases in CO2 emissions.
I agree with Dr Jones that, at present, postmodernism & deconstructionism pose great impediments—perhaps greater than scientism & the “Enlightenment tradition”—to stemming climate change. Yet, if we try to rely only on science alone, we will be disappointed.
-
Rhoowl at 00:59 AM on 6 April 2015Models are unreliable
ask yourself what is the purpose of climate models. As I see it the purpose is to predict the future of climate. However, the future of climate can not be predicted because it is a non linear chaotic system. The idea of increased co2 in the atmosphere causing increased temperature is a linear concept. Increasing the temperature causing sea level rise is a linear concept. In fact increasing temperate may set off a series of events that leads you into an ice age. Can the models predict these occurances, no they can not. in fact the use of models already have proven to be ineffective for prediction of global temperatures. they are unable to deal with chaotic events such as el ninos, volcanic eruptions, etc.
in fact we don't really know what the future will bring and therefore it is easier to adapt to the change than to prepare for and event that is not likely to occur,
Moderator Response:[TD] See the response to the myth "Climate is Chaotic and Cannot Be Predicted." After you read the Basic tabbed pane there, read the Intermediate tabbed pane. If you have questions or comments about chaos, please make them on that thread, not this one. Everybody who wants to respond to that particular aspect of Rhwool's comment please do so over there, not here. Other aspects of Rhwool's comment are legitimately responded to on this thread.
[TD] Rhwool, please read the original post at the top of this thread, which presents empirical evidence of the success of climate models. After you read the Basic tabbed pane, read the Intermediate one. Please restate your claims that climate models cannot predict, in specific, concrete ways that confront that empirical evidence. Vague, evidence-free, and especially evidence-contradictory, claims have no place in a scientific discussion and therefore no place on this Skeptical Science site.
-
Bob Loblaw at 00:52 AM on 6 April 2015It hasn't warmed since 1998
Peter:
You've already had Tom and DSL give you fairly lengthly replies. I will not add to much to the fray, as one of this site's policies is to try to prevent "dog-piling" - a case where an individual gets a large number of responses from many people, which can be overwhelming.
...but, in comment #326, you said "Selecting 2001 as a start date seems to me to be a fair compromise". Taking a skeptical approach, what does the following suggest to you:
- picking 1998, 1999, 2000, or 2001 as the starting year makes a large difference in the trend that is calculated.
Should this not be a warning signal that you should not put a lot of trust into any of these numbers, when trying to examine a long-term warming signal?
-
DSL at 23:04 PM on 5 April 2015It hasn't warmed since 1998
Further, Peter, you claim to be an "AGW skeptic," but your argument is in regards to climate modeling. The theoretical basis of AGW does not emerge from climate modeling. The theory of AGW is simply that humans have enhanced the greenhouse effect, causing greater-than-natural warming. Climate modeling--and here I'll refer specifically to comprehensive general circulation modeling--projects climate change on the multidecadal scale and at fairly low resolution. The resolution is getting better (in some ways) in both time and space, but accuracy is not at the subdecadal scale yet.
All models of real world phenomena are inaccurate. Are they also then failures? If you take a step back and look at where the observed trends could have reasonably gone based simply on past history (a layperson's heuristic), you'd be forced to come to the conclusion that climate modeling has done remarkably well with projecting temp, sea level rise, OHC, etc. (not Arctic sea ice area/extent).
Consider this. Here's the key quote from Easterbrook:
"I find these similarities remarkable, because none of these patterns are coded into the climate model – they all emerge as a consequence of getting the basic thermodynamic properties of the atmosphere right. Remember also that a climate model is not intended to forecast the particular weather of any given year (that would be impossible, due to chaos theory). However, the model simulates a “typical” year on planet earth. So the specifics of where and when each storm forms do not correspond to anything that actually happened in any given year. But when the model gets the overall patterns about right, that’s a pretty impressive achievement."Anyway, any further discussion of modeling should be taken to one of the modeling threads. You can see all new comments across all threads by clicking on the "comments" link below the middle of the SkS header.
-
Tom Curtis at 19:09 PM on 5 April 2015Climate sensitivity is unlikely to be less than 2C, say scientists
bozza @5, the IPCC acceptance procedure is outlined in the figure below:

The key involvement of government is that they, along with "experts" can review and comment on the first order draft. As experts can also review and comment on the first order draft, and to be an expert so far as the IPCC is concerned, you merely need to register as one, that is not a channel of unusual government influence. This is particularly the case in that authors can respond to comments simply by noting why they think they are wrong, or ill informed. Governments also get to vote to accept the WG1, WG2 and WG3 reports. However, they do not get to reject part of the report, or rewrite it in any way. They either accept the report as a whole, or reject it as a whole. That severely limits any influence they can have on the reports, and in particular on individual items within the report. Finally, governments do get to vote on and accept the Summary for Policy Makers line by line. As, however, that is a summary of the report which stands independently of whatever they do to the Summary for Policy Makers, it can have no influence on the report outside of that summary. Finally, all such votes are very public affairs. Fighting too hard against the scientific consensus as reported in the report itself will come at a diplomatic cost.
The idea of political interference making IPCC reports too conservative may be convenient but it does not have much evidentiary support.
-
bozzza at 18:08 PM on 5 April 2015Climate sensitivity is unlikely to be less than 2C, say scientists
'Bias' might indeed be a suitable word because it is actually well assumed that all figures in IPCC reports are 'conservative' due to the process of all participating governments first having to agree as to what is included.
-
Tom Curtis at 15:21 PM on 5 April 2015It hasn't warmed since 1998
Petter99 @324, the UAH trend from 2001 to current is 0.070 ±0.217 °C/decade. That compares to an IPCC projected trend over the interval of 0.2 °C/decade. That is, it is well within error of the IPCC projection. That the error margin on measurement is larger than the projected temperature rise, however, tells you that it is too short a period to test the theory.
The RSS data should be ignored. It uses the same basic data as UAH but the processing results in values distinctly different not only to UAH, but also to all other temperature records. Until it is found out why that is, and a correction made, it must be regarded as inaccurate for short term trends.
Beyond that, by shifting forward the start point to 2001, you eliminate the large El Nino at the start of the series, but increase the impact of the large La Nina at the end of the series. Ergo, based on what we know about climate states about the world, we know that that trend is low due to short term variability rather than due to a low value in the underlying trend. Indeed, without AGW, we would have expected the trend to be strongly negative. (That still makes it an improvement over the previous post. The claim based on 1998 can be refuted by statistics alone. With regard to a 2001 start, you need to know something more about the climate system than is contained in the temperature data itself.)
If you want to know what the trend is like without the impact of ENSO states, the simplest method is to compare the trends for El Nino year, La Nina Years, and neutral years:
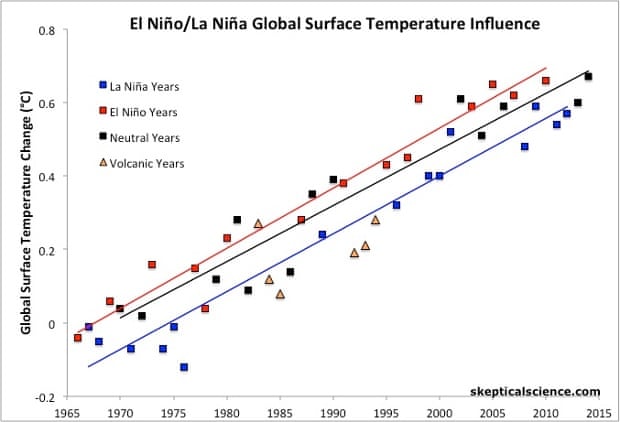
As you can see, they are very similar, quite close to the IPCC projection, and have not changed in recent years. What has changed is that we have got more than usual La Nina years of late following on froma period of slightly more than usual El Nino years.
As to why we shoud not simply project the recent temperature trend, the forcing from GHG is not expected to remain constant, or increase linearly over the 21st century. Ergo it is silly to expect temperature trends to continue as though they are going to increase linearly. Particularly if you take a short term trend known to be reduced by a late occuring La Nina to project it. If you are going to project statistically from the temperature record, you should determine the relationship between forcings and that temperature record and then project according to the assumption that the relationship between forcings and temperature record will remain fairly constant. Dr Cowtan has a model that allows you to do this. You can even scale the forcings to see if you can get a better fit to temperatures than that embodied in the assumption that temperatures respond equally to all forcings. Good luck finding a fit that doesn't either obviously fail relative to the intuitive assumption of equal effect from different forcings over past temperatures, or else more or less reproduce IPCC projections.
-
Peter99 at 14:49 PM on 5 April 2015It hasn't warmed since 1998
Sorry again as I've been rushing this as I have to go out just now. The start date I chose was 2001 becasue to pick 2000 would have been cherry picking for AGW as there was a steep decline after the El Nino. Selecting 2001 as a start date seems to me to be a fair compromise if you look at the graphical trend.
-
Peter99 at 14:37 PM on 5 April 2015It hasn't warmed since 1998
Sorry, another typo...."2000 and end date of 2105" should be "2000 and end date of 2015" -
Peter99 at 14:35 PM on 5 April 2015It hasn't warmed since 1998
OK, points above taken. Let's eliminate the 1998 El Nino and only do a calculation for this century. I used your calculator and put in start date of 2000 and end date of 2105 for both RSS and UAH.RSS gave -0.0048/year and UAH gave +0.0066/year.Let's use the high figure of 0.0066/year which of course means 0.66 DegC rise for 2000 to 2100. Let's add that to the 0.8DegC rise up to 1999 and that gives 1.46 DegC rise from 1900 till 2100.Of course the above assumes that the current rate so far this century will continue. But getting back to the point I made in my original comment, this will be significantly less than the IPCC target of 2.0DegC. So should this target be retained or changed to reflect heat entering the ocean? -
Tom Curtis at 14:12 PM on 5 April 2015It hasn't warmed since 1998
Peter99 @316, you are not a skeptic of the theory until you apply as much skepticism to criticisms of the theory as you do to the theory itself. Had you done so, and using the HadCRUT4 data, you would have noted that the temperature trend from 1975 to 1997 was 0.16 C per decade, while the temperature trend from 1975 to current is 0.17 C per decade. That is, the seventeen years of "temperatures [being] plateaued" has increased the trend by 6.25%.
This must be the first time in history that a decrease in the slope (the temperature plateauing) has actually increased the slope.
The reason for this unusual result is not hard to find. It is that you have been conned. Specifically, if you take a series with no overall trend and random fluctuations about the mean value, and look only at those segments which start at a local peak value above the mean, on average those segments will have a negative trend. If you only look at those segments that start well above the mean value and finish well below the mean value you might even find segments that show a statistically significant negative slope. That will not prove that the line does not exhibit no trend. It will only prove that you have cherry picked your start and end points.
That is exactly what the purported "skeptics" of AGW have done. They take an interval starting with a random fluctuation above the trend value due to the strongest or second strongest El Nino event on record (depending on which index you use). You then take the interval to a period containing one of the strongest La Nina events on record (2011/12), and which is consequently below trend values. They then treat that segment as important, even though the trend in that period is not statistically different from IPCC projections, let alone the ongoing long term trend.
On top of that they add a little verbal legerdemaine. They start by saying that in that period the trend is not statistically different from zero; and end by talking about a period with no trend ("trend has plateaued", "global warming has stopped"). The trend, however, is not statistically distinguishable from IPCC projections, so that it is no more true to say the trend has plateaued than to say it matches IPCC projections. This they are carefull not to mention.
So, please prove that you are in fact a skeptic about AGW, and apply your skepticism both ways. If you do so, you will stop buying the rubbish you just tried to propogate here and start wondering why the arguments of so-called AGW skeptics are so often indistinguishable from bald-faced lies.
-
DSL at 14:10 PM on 5 April 2015It hasn't warmed since 1998
The full quote from the Met in response to David Rose:
Q.1 “First, please confirm that they do indeed reveal no warming trend since 1997.”
"The linear trend from August 1997 (in the middle of an exceptionally strong El Nino) to August 2012 (coming at the tail end of a double-dip La Nina) is about 0.03°C/decade, amounting to a temperature increase of 0.05°C over that period, but equally we could calculate the linear trend from 1999, during the subsequent La Nina, and show a more substantial warming.
"As we’ve stressed before, choosing a starting or end point on short-term scales can be very misleading. Climate change can only be detected from multi-decadal timescales due to the inherent variability in the climate system. If you use a longer period from HadCRUT4 the trend looks very different. For example, 1979 to 2011 shows 0.16°C/decade (or 0.15°C/decade in the NCDC dataset, 0.16°C/decade in GISS). Looking at successive decades over this period, each decade was warmer than the previous – so the 1990s were warmer than the 1980s, and the 2000s were warmer than both. Eight of the top ten warmest years have occurred in the last decade.
"Over the last 140 years global surface temperatures have risen by about 0.8ºC. However, within this record there have been several periods lasting a decade or more during which temperatures have risen very slowly or cooled. The current period of reduced warming is not unprecedented and 15 year long periods are not unusual."
-
DSL at 14:06 PM on 5 April 2015It hasn't warmed since 1998
The "testing" comment could have been read as impatience. I was signaled to read it that way by your substantial comment. In that comment, you focus on the language being used and do not show how the language is at odds with the science. You simply pit the language of those linked against the language of SkS. If you were truly skeptical, you'd be checking the language used against the actual science.
I did not claim there was no "pause." Indeed, I pointed out that there were others. However, my claim was that the pause was in global mean surface temperature and not in the overall (well, sub-stratospherical) climate system.Hans Von Storch is simply wrong in applying "pause" to "climate change." Climate change and global warming aren't even the same thing (rather obviously, as there is more to climate than temp). Even if the enhanced greenhouse effect was done being enhanced, climate change would still be taking place--and would until the entire system came to equilibrium with the new level of forcing. Von Storch was being careless.
As for the Met Office quote, I can only assume that you snagged the quote from somewhere other than the Met blog post, as the post explains everything in detail.
-
Peter99 at 13:56 PM on 5 April 2015It hasn't warmed since 1998
DSL,
Bit puzzled by your incredibly hostile and accusatory tone. This is my first time at your site and he two "testing" comments were because I was on page one and didn't see my comment appear as it was on page 7. Bit thick of me but why do you instantly attack me.
You say I have got the pause wrong but I quoted the UK met office and Hans Von Storch of the IPCC saying that the pause is real. Why attack me for their quotes?
Instead of personal attacks on me, could you please address specifically what I said in my first comment. Thanks.
-
DSL at 13:41 PM on 5 April 2015It hasn't warmed since 1998
Correction: elevator > escalator. Also, ocean heat content: http://www.nodc.noaa.gov/OC5/3M_HEAT_CONTENT/heat_content2000m.png
And sea level rise (supporting OHC measures): http://sealevel.colorado.edu/ -
DSL at 13:36 PM on 5 April 2015It hasn't warmed since 1998
Peter, your account will be deleted if you persist with the "testing" garbage.
You're going to get plenty of response, and hopefully you'll engage honestly in dialogue. Here's the short version of what you're going to get:
1. Regardless of the language people are using, 93%+ of the thermal capacity of the climate system is wrapped up in the oceans.2. Surface temp is noisy. As you can see from the "elevator," there have been many 6-8 year periods of insignificant or even negative trend over the last forty years.
3. 1998 is a cherry pick with regards to statistial significance. If you start a trend on a massive outlier, statistical significance is going to be hard to establish for a while.
4. Even so, look at the surface trend from 1970-2008. It's 0.178C per decade, right about the expected trend. How can that be! How can it be thus if there has been no significant warming for 17 years! It can be thus because the actual "pause" is not 17 years but more like seven years.
5. Start with the physics, like a real skeptic. Do you understand the greenhouse effect?
-
Peter99 at 13:33 PM on 5 April 2015It hasn't warmed since 1998
Correction above...."atmospheric CO2 concentrations to within 2Deg C of preindustrial levels" should be "atmospheric temperatures to within 2Deg C of preindustrial levels
-
Peter99 at 13:23 PM on 5 April 2015It hasn't warmed since 1998
I am a recent convert to AGW skepticism but am still trying to keep an open mind.
Following are two quotes by prominent global warmists accepting that atmospheric warming has had no statistically significant increase since the El Nino of 1998
Met Office Blog – Dave Britton (10:48:21) – 14 October 2012
“We agree with Mr Rose that there has been only a very small amount of warming in the 21st Century. As stated in our response, this is 0.05 degrees Celsius since 1997 equivalent to 0.03 degrees Celsius per decade.”
Source: metofficenews.wordpress.com/2012/10/14/met-office-in-the-media-14-october-2012Dr. Hans von Storch – IPCC lead author - Spiegel – 20 June 2013
“…the increase over the last 15 years was just 0.06 degrees Celsius (0.11 degrees Fahrenheit) — a value very close to zero….If things continue as they have been, in five years, at the latest, we will need to acknowledge that something is fundamentally wrong with our climate models….”“So far, no one has been able to provide a compelling answer to why climate change seems to be taking a break.”
But your article above is saying that we should be looking at the heat going into sea to determine "global warming".
However the IPCC's sole target is to keep atmospheric CO2 concentrations to within 2Deg C of preindustrial levels and if we add the 0.8DegC that the planet warmed prior to this century(0.8 degC), to the projected increase based on Hans Von Storch's figure above of 0.06 per 15 years then that gives us 0.8 + 0.06* 100 / 15 = 0.8 + 0.4 = 1.2 DegC which is well within the 2.0 DegC limit.
Seems to me that AGW is unfalsifiable. When temperatures were rising in the 1990's that was proof of AGW, but now that temperatures have plateaud so far this century, the "proof" of AGW moves elsewhere.
One last question...If global temperature increase stays at the present near zero rate until 2100, will the theory of AGW need revision?
-
Tom Curtis at 09:50 AM on 5 April 2015We must defend science if we want a prosperous future
chriskoz @5, what I primarilly had in mind is that on certain key issues in recent Australian federal politics (refugees, global warming, NBN, response to the GFC) the evidence from experts clearly favours the position adopted by the ALP, or more left wing parties (in the case of refugees). The same applies to certain "cultural wars" where, for instance, the dispute between the so-called "black arm band" view of history, and that favoured by the right amounts the right refusing to accept evidence other than from written documents as regards the treatment of aborigines in the past; and the refusal to teach events that do not bring credit to Australia in Australia's past. (I believe Australia's history is very creditable, with more in its favour than against it. I do not think, however, that is an excuse to not teach that Queensland practised slavery (call blackbirding to create a legal fiction) up until federation, or to not teach that the last official (as in carried out by a policeman, and condoned by a later official enquiry) massacre of aborigines occurred in 1928, or the host of other facts inconvenient to Australian triumphalism.
However, I think you can go further than that. Specifically, certain areas of knowledge (and Economics in particular) are, IMO, clearly value ladened, despite a claim to be value neutral. That value laddened nature is used by the right in support of a lot of their economic policies, whereas a value neutral economics would more strongly favour a left wing (but not Marxist) perspective. Further, I believe that you can have an objective ethics, which pretty much rules out a right wing perspective in politics. However, while I think these points are evidence based, the emperical evidence that they are valid would rely on their actually being practised, and even then would be unlikely to be acknowledged by most of those favouring a right wing perspective (for the obvious reason that while society would be better of, the rich would not necessarilly be better of).
Finally, beyond, that - I think it is trivially easy to show that may right wing politicians act in direct contradiction of their purported values. This is not directly evidence based as it accepts the purported values at face value. It is based, however, on reason. As one example, most right wing politicians in Australia purport to be Christians, and certainly Tony Abbot and John Howard do. Therefore, they purport to accept the values shown in Matthew 25: 40-44, in particular the value that turning away a stranger in need deserves hellfire. And what is the coallition refuge policy except the institutionalized turning away of strangers in need?
-
Tom Curtis at 09:21 AM on 5 April 2015Climate sensitivity is unlikely to be less than 2C, say scientists
PluviAL @3, I do not see any consistent evidence that the IPCC has a systematic bias to be conservative. Obviously there are instances in which they have underestimated responses to climate change, of which the most famous is Arctic sea ice extent, but there are also other areas in which they have overestimated the response. One of these is Global Mean Surface Temperature, where their predictions have been consistently warm relative to observations (if only by about 15%). The pattern of some areas underestimated and some overestimated is what we would expect with imperfect knowledge and no institutional bias. Of course, it is possible that if all areas are taken into account, a bias exists; but no meta-study comparing IPCC projections with observations across all areas of climate science exists (if we exclude the IPCC reports themselves). What is more, such independent reviews of the science as exist, while less comprehensive than the IPCC, tend to agree with the IPCC in the areas of overlap.
More importantly, climate scientists have been surveyed about the accuracy of the IPCC reports, and while some think it conservative, others think it to adventurous, but the majority think it reasonably accurate. As the IPCC is supposed to report on the scientific consensus, that suggest they are doing their job well.
-
PluviAL at 04:22 AM on 5 April 2015Climate sensitivity is unlikely to be less than 2C, say scientists
My simple reading of the process, is that the IPCC has a systematic bias to be conservative. What this mean is that we are more likely to continuously find that they produce underestimates.
By my same simple outlook, we must develop tools to address, and use all feedback mechanisms; not just such clumsy ideas as ocean clouding with salt spray, or high atmosphere areoles. We can develop powerful tools that use the energy in the atmosphere itself to produce feedback mechanisms at the desirable levels to attain the adjustment we must have, and to change it when a different outcome is desired as we find that we made a mistake or, we need one effect in one region but the opposite in another.
For example: If the gulf stream slows or stops, we may have to warm Europe, and cool Australia at the same time. Such tools must be developed and advanced. We can do it; don’t just say it is impossible without knowing the relevant arguments.
Prev 629 630 631 632 633 634 635 636 637 638 639 640 641 642 643 644 Next


