


 Arguments


Recent Comments
Prev 632 633 634 635 636 637 638 639 640 641 642 643 644 645 646 647 Next
Comments 31951 to 32000:
-
ubrew12 at 05:14 AM on 3 January 2015Things I thought were obvious!
Climate denial can't be separated from gun ownership, free-market anti-tax faith, gated communities, redistricting, libertarianism, and the US Supreme Courts Citizens United decision. All of these social movements suggest a mindset that can, in fact, ignore the commons, with enough wealth and power. "I don't have to outrun the bear, I just have to outrun you" comes with its own logic in a World of 7 billion people and an unspoken but deeply held belief that everyone else should just go away. Powerful news agencies now preach this idea that everything would be OK if people would just keep the nose to the grindstone and mind their own business. Hence, although I think there's going to be an unacknowledged general push to transition the economy toward non-fossil sources (with everybody acting in the interests of their own self-preservation), arguing for it, celebrating it, advocating for it, is going to be subject to knee-jerk reactionariism, as people trained to 'read between the lines' (i.e. insert Faux News bias into your mouth) continue to find clues in such talk of a 'deeper threat to the union'. So, I guess what I'm saying is that if you're waiting for the lowest-common-denominator to recognise the logic of your (plainly reasonable) arguments above, its not going to happen. Continued general improvements will have to move forward steadily and broadly, victories celebrated quietly, so as not to arouse the passions of a public stoked into fury over 'Green is the new Red' preaching. For some time into the future, this is going to remain 'the crisis which cannot be named'.
-
MarkR at 02:08 AM on 3 January 2015Another year and glaciers are another metre thinner
sgbotsford:
Working out how best to present data is really important. In this case, I think that the WGMS have done it right.
Firstly, it's common to cover as much of the graph as possible to see changes and how big they are. This is taught in university physics and meteorology courses as a valid way of presenting data in many situations.
Secondly, anyone who can read a graph looks at the axis scales, and although the units in this case are a little opaque, I tried to make this as clear as possible in the caption.
Thirdly, it's not easy to work out the zero point here. Some glaciers like Chacaltaya are 100% gone. Others are much thicker, so much less is gone.
Finally, as others have pointed out, it's often misleading to use true zeroes, as the wonderful DenialDepot posts show.
The WGMS graph is a report on the mass balance of glaciers, and that graph is a clear and fair way of showing that. I agree that there is a risk that some people will misinterpret the graph, but that is true of almost any way of presenting data. The way this graph is presented is clear to anyone who has any experience of reading graphs and I'm pretty sure that any other way of presenting it would be much more misleading.
I agree though, that it's not able to answer every question and it doesn't clearly say much about impacts. That's why we have lots of other research!
-
Michael Whittemore at 01:52 AM on 3 January 20152015 SkS Weekly News Roundup #1A
Happy New Year everyone.
I hope you this is the right places to ask but I wanted to know if anyone had some information about the heat that was found in the Southern Ocean.
Its from this paper "Quantifying underestimates of long-term upper-ocean warming" (http://www.nature.com/nclimate/journal/v4/n11/full/nclimate2389.html)
Moderator Response:[JH] See Rob Painting's article,
[Rob P] - try this one instead:
-
Tom Curtis at 01:14 AM on 3 January 2015Time is running out on climate denial
OPOF @12, I certainly agree that energy politics has been a significant (though not only) factor in sparking the crisis in the Ukraine. I am not sure how you would assess whether the failure to switch to a more renewable economy (which would have decreased European dependence on Russian gas) or a desire to restrict emissions (driving a European prefference for gas over oil or coal for power generation) is more significant in that, so I do not think we can say how climate change politics contributed to the crisis, and doubt climate change itself contributed directly. On the other hand, as climate change continues, that will creat even more crises of a similar nature. (Arguably it has already contributed to the Syrian crisis.) So as a more general point, I certainly agree that tackling climate change reduces the long term risk of wars, civil wars, and consequently of nuclear exchanges.
-
Tom Curtis at 01:05 AM on 3 January 2015Why is the IPCC AR5 so much more confident in human-caused global warming?
dvaytw @52, the first thing to notice is that if you do a like with like comparison, AR5 only gets a 90% rather than the 95%. Here are the two relevant statements from the two reports:
IPCC AR4 Chapt 9, Executive Summary:
"Greenhouse gas forcing has very likely caused most of the observed global warming over the last 50 years. This conclusion takes into account observational and forcing uncertainty, and the possibility that the response to solar forcing could be underestimated by climate models. It is also robust to the use of different climate models, different methods for estimating the responses to external forcing and variations in the analysis technique."
IPCC AR5 Chapt 10, Executive Summary:
"More than half of the observed increase in global mean surface temperature (GMST) from 1951 to 2010 is very likely1 due to the observed anthropogenic increase in greenhouse gas (GHG) concentrations. The consistency of observed and modeled changes across the climate system, including warming of the atmosphere and ocean, sea level rise, ocean acidification and changes in the water cycle, the cryosphere and climate extremes points to a large-scale warming resulting primarily from anthropogenic increases in GHG concentrations. Solar forcing is the only known natural forcing acting to warm the climate over this period but it has increased much less than GHG forcing, and the observed pattern of long-term tropospheric warming and stratospheric cooling is not consistent with the expected response to solar irradiance variations. The Atlantic Multi-decadal Oscillation (AMO) could be a confounding influence but studies that find a significant role for the AMO show that this does not project strongly onto 1951–2010 temperature trends. {10.3.1, Table 10.1}"
(My emphasis in both quotes)
So, both reports indicate that it is "very likely" that greenhouse gases have caused more than half of the warming since 1950. AR5 gives a stronger result, but only by extending the duration of the finding forward to 2010 (ie, about 5 years).
The 95% figure is for a different value. AR5 (Chapt 10, Executive Summary) states:
"It is extremely likely that human activities caused more than half of the observed increase in GMST from 1951 to 2010. This assessment is supported by robust evidence from multiple studies using different methods. Observational uncertainty has been explored much more thoroughly than previously and the assessment now considers observations from the first decade of the 21st century and simulations from a new generation of climate models whose ability to simulate historical climate has improved in many respects relative to the previous generation of models considered in AR4. Uncertainties in forcings and in climate models’ temperature responses to individual forcings and difficulty in distinguishing the patterns of temperature response due to GHGs and other anthropogenic forcings prevent a more precise quantification of the temperature changes attributable to GHGs."
(My emphasis)
The key difference to the prior statement is that this assesses the combined likelihood of all anthropogenic factors. Critically, the likely (66%) range of contribution of temperature increase of non-greenhouse anthropogenic contributions is assessed as being between -0.6 to 0.1 C, while the likely range for GHG is 0.5 to 1.3 C of a total 0.6 C increase. Because the total increase is known, it is also known that high GHG contributions must be correlated with low (negative) other anthro contributions, and that conversely if the GHG contribution is actually at the low end of the range, then the other anthro contribution must by only slightly negative, or even positive. That relation increases the certainty of the total anthro attribution.
There is no similar statement in AR4 with which to compare this statement in AR5 about total anthro contribution.
Finally, the actual numbers given are based on the values underlying Fig 10.5:

From this it is possible to generate the Probability Density Functions (strictly likelihood density functions) of the various values. I have done so below, plotting against the contribution to the total (0.6 C) temperture rise:

Looking up the spreadsheet on which I plotted that graph, I find that the probability of at least 50% contribution for GHG alone (blue) is 91.2%, while that for total anthro (orange) is 99.94%. That validates both claims made in the exective summary, but also shows that they were being conservative relative to their data for the total anthro assessment.
-
CBDunkerson at 00:20 AM on 3 January 2015Why is the IPCC AR5 so much more confident in human-caused global warming?
dvaytw, those values come from statistical math.
Basically, they are calculating the mathematical likelihood that the observed data could have occured due to random variation as opposed to some underlying trend. The calculations are similar to those used to determine the +/- ranges you see on polls or uncertainty bands on graphs, but in this case they are looking for a 'true/false' likelihood rather than a range.
The posts below discuss issues around interpreting statistical significance in relation to the recent atmospheric warming trend;
On Statistical Significance and Confidence
If you want to look at the actual math, the simplest version of this kind of test would be;
-
CBDunkerson at 22:28 PM on 2 January 2015Antarctica is gaining ice
vincentfladk, the idea that Antarctic land ice falling into the ocean could be causing increased Antarctic sea ice has actually been floated and examined before. However, as Tom Curtis explains, in this case the situation is quite a bit more complicated.
That said, I have seen some suggestion that the decreased salinity of ocean water caused by melting land ice leads to a higher freezing point and thus some increase in sea ice formation. However, the prevailing theory seems to be that most of the Antarctic sea ice increase is caused by changes in wind patterns and/or the ozone hole.
-
wili at 20:27 PM on 2 January 20152015 SkS Weekly News Roundup #1A
I'd like to join Alpinist in well wishes to the intrepid SkS crew.
Here's one of the most important speeches of the year, imho, putting GW and mass extinction in a larger historical, political and literary context :
Chris Hedges - "The Myth of Human Progress and the Collapse of Complex Societies" - Full Speech
-
dvaytw at 18:23 PM on 2 January 2015Why is the IPCC AR5 so much more confident in human-caused global warming?
Can anyone give me a rough idea of how they get a number like, say, 95% as opposed to 90%
-
One Planet Only Forever at 14:03 PM on 2 January 2015Time is running out on climate denial
Tom Curtis@11,
I support your assessment regarding the potential merit of the comment by doskachess.
I suggest that earlier effective action to address global warming and climate change - the rapid reduction of the benefit the most fortunate could obtain from the burning of fossil fuels - may have reduced the motivations that created the Ukraine crisis.
However, it is likely that many wealthy powerful people who had been deliberately trying to get away with maximum personal benefit, even if their pursuits are clearly understood to be damaging and would ultimately be unsustainable, would become even more vicious and destructive if faced with more effective global action that would clearly limit their ability to maximize their wealth in the ways they were gambling on being able to get away with.
However, the potential for angry responses from people who want to get as wealthy and powerful as possible through damaging and unsustainable actions would be a poor excuse to not act in the required fashion regarding the threat of climate change. Those type of people simply have to be kept from succeeding in the future or there really will be no decent future for humanity.
-
Daniel Bailey at 12:59 PM on 2 January 2015Another year and glaciers are another metre thinner
Based on current trends, glacier recession models predict that by 2030, Glacier National Park will be without glaciers.
-
Andy Skuce at 12:16 PM on 2 January 2015Another year and glaciers are another metre thinner
There are percentage graphs of projected glacier loss, by region, in a paper by Marzeion et al 2012 (open access). I extracted a few examples for my piece on the Athabasca Glacier.
Most temperate and tropical glaciers will be mostly gone by the end of this century.
In the Marzeion et al paper there are graphs of historical glacier loss by region and globally in their figures 17 and 18.
-
Tom Curtis at 11:40 AM on 2 January 2015Antarctica is gaining ice
vincentfladk @377, the rate of sea level rise is approx 3 mm per year. I will assume that all of it comes from melting ice (in fact a significant amount comes from thermal expansion). The specific heat of water is 4.2 KJ/(Kg K). That is, it takes 4,200 Joules to raise one Kilogram of water by one degree K. The latent heat of fusion of water is 334 KJ/Kg. That is, it takes 334,000 Joules to melt one Kg of ice. Ergo, melting a Kg of ice takes approximately the same amount of energy as raising the temperature of that water by 80 degrees K.
Assume for the sake of argument, that the average temperature of the Ice was - 15 C prior to being melted, and that it is raised to the global average temperature of 15 C. The total energy involved in melting the ice and raising sea level on this assumption, therefore, is approximately equivalent to the energy required to raise 3 mm of sea water across the worlds ocean by 80 C. However, because of strong mixing due to surface winds, the top 50 meters (very conservatively) of sea water has essentially the same temperature. To cool the ocean surface, therefore, we need to cool that top 50 meters. That 3 mm of sea level rise, therefore must cool 16,667 times as much water as it holds. Averaging the heat over that depth, it means we have 80/16667 degrees C temperature decrease, or approximately 0.005 C decrease to small to be noticed.
In this calculation, I have made a number of assumptions that were generous (to say the least) to your theory. Even so, it does not hold water (pun intended). This is one of the things that distinguishes science from theology (or most of philosophy, ie, my own native discipline) is the use of mathematics to filter out those theories that seem plausible when not expressed with enough precission. It is also why newcomers very rarely see things that have not been considered and rejected as implausible by the actual scientific experts.
-
vincentfladk at 10:12 AM on 2 January 2015Antarctica is gaining ice
Sometimes a newcomer to a discussion or even to a science may see something the experienced conversationalists overlook. Seventy four years of age, I was trained as a theologian and then switched to Bible studies more narrowly understood. After reading all the comments, I realized to my horror, that three things noticed by comment but not put together by anybody, might abundantly confirm our worst fears about the ice and snow of Antarctica and global warming generally. It would go this way. The land ice is sliding into the ocean faster and faster. Thus there is more sea ice! AND THUS and thus please kindly excuse the capital letters THE SURFACE OF THE WORLD'S OCEANS IS COOLING SLIGHTLY the surface of the world's oceans is cooling slightly. It naturally would if fresh water from the melt of land ice were spreading widely! So that a cooler ocean, if only on the surface, would be wrongly reassuring to those of us who would like to continue to live on a planet wearing a cap of ice and ice boots, on which we have desported ourselves for forty milllion years.
Moderator Response:[JH] The use of "all caps" constitutes shouting and is prohibited by the SkS Comments Policy.
[Rob P] - Global sea surface temperatures exhibit a long-term warming trend:

-
sidd at 10:10 AM on 2 January 2015Another year and glaciers are another metre thinner
If that Mernild paper were to be read as an exponential rate, the doubling time is slitely greater than 20 yr. -
Tom Curtis at 09:27 AM on 2 January 2015Time is running out on climate denial
chriskoz @10, I partially disagree.
Partially because doskachess' comment was of very low quality, and they were suitably warned for sloganeering. But only partially because, with a bit more care doskachess could have made a relevant point and concievable counter to Greg Craven's argument. To see the later, consider that:
1) A full nuclear exchange* between the US and Russia will very likely end civilization as we know it and possibly (but is unlikely to) cause the extinction of the human species. It is a threat, therefore, whose consequences are at least on a par with those of global warming, and likely (but not certainly) worse than global warming.
2) The civil war in the Ukraine was triggered by an unconstitutional change** of government backed by the US and Europe, and switched the government position in the Ukraine from a pro Russian to a Pro Western position, despite the Ukraine being vital to Russia's economic interests (because of the gas pipeline) and definitely within what Russia would consider its sphere of influence. It has lead to a civil war in which the pro Russian forces definitely have Russian assistance, assistance which threatens to become overt support. If that occurs, NATO nations will be under very strong domestic political pressure to intervene in favour of the Pro Western Ukraine Government.
3) If such intervention eventuates, the risk of nuclear exchange would have to be considered as comparable to that during the Cuban missile crisis.
Taken together, these constitute an imminent and plausible risk comparable to and possibly greater than that from global warming. Following Craven's proceedure, we should analyze this risk by setting up two rows, one for the possiblity the risk is real, and one for if it isn't. Further, we should treat the risk as maximal, ie, an actual extinction event for the human species (the worst plausible outcome from a full nuclear exchange).
Given this partial matrix, doskachess can now argue that the fact that we purportedly ignore this threat shows we do not accept Craven's reasoning afterall. If we did accept his reasoning, we would be doing all that we could to avoid this threat. Instead, we spend our time on a "lesser" threat of global warming (which is true, regardless of our opinion of the risk of the nuclear threat).
So constructed, doskachess's "argument" is at least a germain response to the OP. The problem is that there is no full matrix. I do not know of anything that I could do to reduce this risk. I could right a letter to Obama urguing caution (I guess), but I am not a US citizen and he is already showing plenty of caution on this issue. I am certain I cannot give him better advise than his existing policy advisors who are certainly live to this threat, and better informed. Nor his this a threat were it is relevant to shift public opinion over a matter of years and (hopefully sooner, but also) decades such as we are attempting here on SkS for global warming.
So, my tacit matrix for this problem is to fret pointlessly, or to find a better, more constructive use of my time. The outcomes are the same for both columns of the matrix, so the nuclear threat can have no bearing on my choice. In contrast, the threat from global warming strongly indicates that I should take column b, ie, spend my time more usefully by helping people better understand the science of global warming.
So, I think I have a counter to doskachess's implicit argument in better form. I may be wrong. All doskachess needs to do is to show there are in fact two columns, in one of which I can take effective action to prevent a full nuclear exchange. Doskachess, however, has not even properly drawn the analogy to Craven's argument to begin with, however. Indeed, rather than constructively doing so, they lept reflectively to the cheap insult showing they are at best, all about column a (respond to the nuclear threat by fretting pointlessly), and more probably that the mention of nuclear threats was just a cheap shot at anybody concerned about climate threats.
* There are other threats of limited nuclear exchanges, most notably with North Korea. Limited nuclear exchanges, however, are not threats to civilization, still less the species, and are not relevant to the discussion. They are, of course tragic, and horrifying beyond description.
** I think the change definitely reflected the democratic will of the Ukrainian people. That does not mean, however, that it followed proper constitutional form.
-
chriskoz at 08:01 AM on 2 January 2015Time is running out on climate denial
Wh8le concurring with Tom Curtis, I also note that doskachess@6 comment is of such low intellectual quality that I long haven't seen such SkS comment to stand. The way it stands now (first and only post) indicate it's a drive by.
By sad coinsidence, it's the first post in 2015 (SkS time which is AET no daylight savings). This is bad because this site does not deserve to be marked by such a primitive troll, I suggest to eradicatre it.
-
Sea level rise is exaggerated
Earthling - Yes, there is indeed continuing agreement that sea level rise continues, and over the longer term is accelerating, as per basic physics and observational data. Note that a five year period ("since 2009") is a _very_ short time given year to year variations.
What kind of "sensible adjustments" do you have in mind? And are they backed by any kind of data?
-
Earthling at 03:04 AM on 2 January 2015Sea level rise is exaggerated
Is there still "close agreement" that SLR is "steadily accelerating" as per the 2009 claim, or have some sensible adjustments been made since then?
Moderator Response:[DB] Please provide your definition of "sensible adjustments".
-
Alpinist at 02:57 AM on 2 January 20152015 SkS Weekly News Roundup #1A
Happy New Year to the SkS crew! We appreciate all the work/research you do!
-
Bob Loblaw at 10:28 AM on 1 January 2015Another year and glaciers are another metre thinner
It would appear that sgbotsford as been taking Dr. Doom seriously. For a full description of how to cook a graph, look here. The description over at Dr. Doom's uses sea ice, but it would also work well for glacier ice - how to adjust the scales to make the change disappear.
-
Daniel Bailey at 09:12 AM on 1 January 2015Another year and glaciers are another metre thinner
Related:
"The cumulative glaciers and ice caps (GIC) surface mass balance (SMB) was negative for all regions. The SMB contribution to sea level rise was largest from Alaska and smallest from the Caucasus. On average, the contribution to sea level rise was 0.51 ± 0.16 mm sea level equivalent (SLE) yr−1 for 1979–2009 and ~40% higher (0.71 ± 0.15 mm SLE yr−1) for the last decade, 1999–2009."
-
Tom Curtis at 08:34 AM on 1 January 2015Another year and glaciers are another metre thinner
sgbotsford @3, the two graphs showing cumulative mass balance are both scaled in mm water equivalent, which the article makes plane equates to a loss average thickness of the glacier. Intuitively, with warming, a 50 meter thick glacier* and a 20 meter thick glacier would both lose equivalent amounts of ice, all else being equal. That is, if temperatures rose enough for one to become 1 meter thinner, then we would expect the other to be one meter thinner also, all else being equal. All else is, of course, never equal, so our expectations would be in terms of averages over many glaciers but the point remains.
What we would not expect is that if a glacier just 5 meters thick melted away completely, glaciers 200 meters thick would also melt away completely. Yet that is the expectation encoded in your "non triksy" scaling. Percentage loss is only a meaningful comparison across the world's glaciers if we would expect thick glaciers to take no longer to melt away, and to melt away as completely for small temperature rises, as we would for thin glaciers. Is that really your expectation? If so, what is its basis in physics?
Regardless of your (likely) uninformed expectations, however, the world's glaciologists appear to have the former expectation - born out by years of observation - as is shown by their use of the same scale as is used in the graph above. That being the observed experience, switching to a percentage graph would be tricksy indeed.
* Glaciers are, of course, not of uniform thickness so these thicknesses, but for this discussion, and only to illustrate a logical point, it is convenient to simplify and treat them as though they are.
-
Another year and glaciers are another metre thinner
sgbotsford - The standard with graphs is to plot them with the data of interest filling the chart. Since the graphs you are complaining about are entitled Change in mass they are indeed plotted correctly.
Choosing an expanded scale (as you suggest) is often done to be deceptive. One of my favorite pseudo-skeptic graphs of this type displayed global temperature changes in degrees Kelvin, with the axes extending to 0K, or -273.15C. That was indeed tricksy. And, yes, deceptive.
-
One Planet Only Forever at 08:15 AM on 1 January 2015Another year and glaciers are another metre thinner
sgbotsford,
The scale of the graphs is not biased. And their presnetation is not deceptive.
All of the data fits. And the change of rate of ice loss, becoming steeper, is evident. A deceptive presentation would have been to use something like a log scale in a way that appeared to indicate even more rapid more recent ice loss.
The point is that glacier ice mass is declining and the graphs present that without bias, especially when looked at as part of the reading of the article, which is what was intended.
-
MP3CE at 08:09 AM on 1 January 2015Another year and glaciers are another metre thinner
@mspelto: I had some trouble with your link. Is this one correct ?
-
sgbotsford at 08:07 AM on 1 January 2015Another year and glaciers are another metre thinner
I don't like the way you chose axes for these graphs. Great examples of how to lie with graphs, without fibbing at all.
Here's the issue: The height of the right end is, what, 1/20 of the height of the start of the graph. The unstated visual message is, "There is only a little bit of ice left! Most of it is gone!"
This is the nature of deficit graphs. A more honest graph scales with total thickness, or percent mass lost, with the axis running all the way to zero. Graphed like that, it may show that we have lost 5% or 20% or 1% of the ice.
We must not be tricksy.
-
mspelto at 05:08 AM on 1 January 2015Another year and glaciers are another metre thinner
You are simply not cut out to be a cherry picker. For Switzerland the 6 retreating to 1 advancing is for 2013. In 2012 the ratio was 92 retreating to 1 advancing. For 2011 it was 96 retreating to 1 advancing.
http://glaciology.ethz.ch/messnetz/glacierlist?year=2011&submit=Go%21&order=&field=
-
mitch at 03:06 AM on 1 January 2015Another year and glaciers are another metre thinner
I have always been impressed how well the cherry-pick works. Please keep putting up graphs like figure 3 for the truly curious and skeptical as well as providing links to good information sources such as WGMS or GLIMS.
-
Rob Honeycutt at 02:54 AM on 1 January 2015Time is running out on climate denial
jenna... I disagree. I think a modicrum of self-deprecation (finding a silly hook) has a way of disarming people to a message they don't necessarily want to hear.
-
jenna at 02:43 AM on 1 January 2015Time is running out on climate denial
You know, I think Greg Craven's message would be taken more seriously if he weren't wearing all those silly hats that he used in the "How it all ends" series of videos. Why would he do that with such an important message to convey to the average citizen?
Jen
-
Tom Curtis at 00:55 AM on 1 January 2015Time is running out on climate denial
doskachess @6, the fact is you have no idea as to the views ofcontributors and commentors on SkS regarding nuclear war, ebola, over fishing, world terrorism or any of a number of other causes for concern in this world. You have no idea because you have not bothered to ask - you have merely assumed (which contrary to the popular dictum, only makes an "ass" out of "u").
On the basis of that unwarranted assumption you then go onto to dismiss concern about global warming as evidence of credulity. We are, apperently, required to be simpletons who can only imagine one problem in the world at once if we are not to be, in your book, gullible. I am not so gullible as to be swayed by such assinine reasoning.
-
doskachess at 00:37 AM on 1 January 2015Time is running out on climate denial
http://www.skepticalscience.com/comments_policy.shtml"Hard to understand how we do so little to slow global warming"? Not at all. If you are not concerned about the more immediate possibility of the whole of humanity being wiped out by nuclear weapons (if you are not aware of the reasons for this, that says it all), then how can you expect huge numbers of people to be concerned about the 'sometime in the future' threat of partial destruction of humanity by global warming? Your continued blindness re the dangers of warfare is typical of human willingness to follow a trend, of gullibility in following a religion, rather than to apply intelligence to society's needs.
Moderator Response:[JH] With your first post, you are already skating on the thin ice of sloganeering which is prohibited by the SkS Comments Policy.
Please note that posting comments here at SkS is a privilege, not a right. This privilege can be rescinded if the posting individual treats adherence to the Comments Policy as optional, rather than the mandatory condition of participating in this online forum.
Please take the time to review the policy and ensure future comments are in full compliance with it. Thanks for your understanding and compliance in this matter.
-
Daniel Bailey at 22:59 PM on 31 December 2014Examining Hansen's prediction about the West Side Highway
Far be it for me to even attempt to amplify on Tom's rigorous comments, but I would like to expand on this brief point:
"On runaway greenhouse, there is no doubt. The concensus position is that it is not possible given the current amount of radiation recieved from the Sun."
Hansen himself has repudiated that earlier position of his (WRT a Venus-style runaway):
"With the more realistic physics in the Russell model the runaway water vapor feedback that exists with idealized concepts does not occur. However, the high climate sensitivity has implications for the habitability of the planet, should all fossil fuels actually be burned.
Furthermore, we show that the calculated climate sensitivity is consistent with global temperature and CO2 amounts that are estimated to have existed at earlier times in Earth's history when the planet was ice-free.
One implication is that if we should "succeed" in digging up and burning all fossil fuels, some parts of the planet would become literally uninhabitable, with some time in the year having wet bulb temperature exceeding 35°C.
At such temperatures, for reasons of physiology and physics, humans cannot survive, because even under ideal conditions of rest and ventilation, it is physically impossible for the environment to carry away the 100 W of metabolic heat that a human body generates when it is at rest. Thus even a person lying quietly naked in hurricane force winds would be unable to survive.
Temperatures even several degrees below this extreme limit would be sufficient to make a region practically uninhabitable for living and working.
The picture that emerges for Earth sometime in the distant future, if we should dig up and burn every fossil fuel, is thus consistent with that depicted in "Storms" — an ice-free Antarctica and a desolate planet without human inhabitants"
[Source LINK]
So no runaway. But Hansen notes that it won't take a runaway to basically completely eradicate civilization as we know it.
-
One Planet Only Forever at 13:09 PM on 31 December 2014Time is running out on climate denial
This type of presentation will not work on a person who understands that the required action is for them to give up potential personal benefit to reduce the magnitude of problems faced by others, particularly others in the future. The 'what happens in the future' boxes are not relevant to them.
Unfortunately there are many people who choose to be motivated by personal interest. Some are even willing to benefit from action they know will be to the detriment of others. They may be inclined to behave better if they believe they could face a consequence in their lifetime, but the consequence needs to be percieved to be likely enough and significant enough to offset the personal benefit and enjoyment they think they might be able to get away with.
Generally, a significant clear consequence is required to offset the desire to gamble on getting away with benefiting. Very little personal consequence is faced by the real trouble makers on this issue and they know it. For them, there is no downside to creating bogus claims that would potentially prolong popular support for their damaging desires.
The socioeconomic system created this problem and has created the wealthy powerful people who fight against the developing better understanding of what is going on and who fight against the required changes of the socio-political-economic system. The following steps are a signficant part of the problem that need to be addressed:
- It will always be cheaper and more profitable to do things in the most damaging and least sustainable way that can be gotten away with. People more willing to try to get away with damaging and unsustainable activity have a competitive advantage.
- The amount of damaging and unsustainable activity grows until the unacceptability of the activity becomes too obvious to deny.
- This leads to after-the-fact attempts to curtail the activity. But developed popularity and profitability make it very difficult to curtail these activities. Wealth accrued by the most profitable will be abused any way it can be gotten away with to prolong the ability to maximize the benefits being obtained.
- The result is a significant divide of a society as the unacceptable pursuers of profit deceptively create popular support for their unacceptable activity. And that illigitimate pursuit of popular support may only fail when the deceptions and damage being caused becomes undeniable. And for many people the damage has to be to them directly. No amount of evidence of unacceptable harm to others will lead them to change their mind.
- The result is a large amount of damaging unsustainable popular and profitable activity in the economy. If a matter like the future consequences of the way the most fortunate enjoy their life can actually be successfully addressed there may be no end to the curtailing of damaging unsustainable activity that have been developed by the obviously flawed socioeconomic system. That means a lot of very wealthy people who have gambled on getting away with damaging unsustainable pursuits would lose their perceived near-future wealth. No amount of consequence to others, or even to themselves, will diminish their desire to fight against the required changes to the socioeconomic system. Those type of people cannot be negotiated with. Those type of people need to be excluded from infuencing the discussions about how to do what needs to be done.
Many powerful and wealthy people do not deserve the wealth and power they have. And they will do everything they can get away with to increase their wealth and power. It is pretty clear what needs to be done. It is also pretty clear that the status quo of global socio-political-economics can be expected to fail to do all that needs to be done as quickly as it needs to get done.
But there is hope, because if the unacceptable among the wealthy really were omnipotent the meeting in Lima to prepare for the meeting in Paris would not have been held.
A sustainable better future for all is possible. But it will be a battle to overcome those who are not interested in that type of development. Continuing to develop the better understanding of climate science is a critical part of the battle. Better understanding eventually prevails. However, everyone should not be expected to rationally accept the better understanding. Some people rationally perceive that they have much to lose if they accept it.
-
From Peru at 08:58 AM on 31 December 2014Time is running out on climate denial
Nota Bene: I forgot to say that the "natural monopolies" are not a general rule, because a lot (actually most) of the fossil fuel production go to commodity markets.
In my country the biggest source of fossil fuels is the Camisea Deposit, where natural gas and liquids are extracted. Most of it is used ifor internal consumption to make electricity, the rest is sold to markets abroad. So here the "monopoly" figure holds for gas.
For mining (mainly metals) there are instead a lot of operations and companies that depend on commodity markets.
-
From Peru at 08:43 AM on 31 December 2014Time is running out on climate denial
I saw this video some years ago.
I can say just that, imagine the "skeptic" worst case scenario is true: global warming is really false and we act to prevent a thing that cannot happen anyway, and as a result:
- The world will turn to cheaper and cleaner forms of energy, accesible to million of people currently off-grid,
- saving millions of lifes from respiratory illnesses due to non-greenhouse pollution (black carbon, sulfates, PM-10, etc.)
- all the economic benefits resulting from that (not to mention the infinite value of human life)...
- Energy will not be a "natural monopoly" (electric companies, oil and gas corporations, etc.) but a free and accesible resource to everyone with the required equipment, an equipment that (unlike the capital intensive equipment for power plants and coal, uranium, oil and gas extraction) has not an increasing price but a rapidly decreasing cost, and can be made at any desired scale, from big wind farms to quite small solar panels.
Well we will have made the world a better place for no reason, nice worst case scenario, isn't it?
-
gws at 08:19 AM on 31 December 2014Time is running out on climate denial
"Although Craven doesn’t look at the probabilities of these worst case scenarios, ..."
Actually, he does. It is in his book though, "What's the Worst that Could Happen?" Easy reading over the holidays, Dana ;-)
-
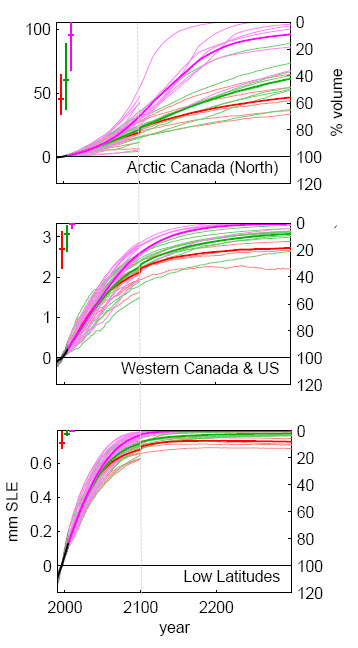
Andy Skuce at 02:45 AM on 31 December 2014Andy Skuce's AGU Fall Meeting 2014 poster presentation
I will be doing a couple of blogposts shortly on the feasibility of both RCP 2.6 and 8.5. At the risk of giving away the punchline, both pathways are improbable, but for different reasons. But that's how it should be because one of the purposes of modelling is to bracket the range of realistic scenarios. The extreme pathways should be unlikely.
I started looking in more detail at those two pathways about a year ago and I wondered at the time how much the emissions would add to sea level. I calculated rough numbers quite quickly that would have been good enough for blog science, but making this into something rigorous enough to be considered for publication took a lot of additional work.
-
wili at 02:11 AM on 31 December 2014Record-Breaking Sea Surface Temperatures in 2014: Has the Climate Shifted?
This seems to be the most relevant passage for what I was confused about:
"One custom in measuring turbulent atmospheric motion is to make all fluxes directed away from the surface to be positive. Examples of such that make sense are thermal energy transfer (within the turbulently-mixed air) and the movement of water vapour away from the surface (AKA evaporation). For shear stress (also known as "momentum transfer"), the actual direction is from the top down: the air is dragging on the earth and transferring momentum from the atmosphere to the surface. So, being downward-directed, it ends up with a negative sign, and more negative means stronger forces."
-
wili at 01:56 AM on 31 December 2014Record-Breaking Sea Surface Temperatures in 2014: Has the Climate Shifted?
Thanks, Bob. I thought this confusion seemed familiar.
-
BaerbelW at 01:56 AM on 31 December 2014Time is running out on climate denial
To get a more in depth view of Greg Craven's "musings", check out his "How It All Ends" playlist on Youtube. This was prompted by the many comments he received for his "Most terrifying video" linked to in Dana's post.
-
Bob Loblaw at 01:41 AM on 31 December 2014Record-Breaking Sea Surface Temperatures in 2014: Has the Climate Shifted?
Wili:
The same graph of zonal wind stress anomalies was used in this SkS post on Unprecedented Trade WInd Strength...
I gave an explanation of the units in that graph in this comment on that post.
-
Phil at 22:02 PM on 30 December 2014It hasn't warmed since 1998
Hello,
I wonder if someone from the Skeptical Science team or commentators could give their opinion on the linked spreadsheet. (See below)
It takes a different approach to de-bunking arguments such as "no warming for 15 years" or "AGW theory predicts an increase in CO2 should result in an increase in temperature". It does so by taking a qualitative description of some of the factors that affect atmospheric temperatures (CO2 concentration, solar cycles, IPO cycles and volcanic erruptions) and models them as simple algebraic functions.
The intent is use this as de-bunking tool to show that (a) this qualitative description of factors affecting the atmospheric temperature record give rise to plausible looking temperature graphs and (b) the description does indeed predict short periods of "hiatus" or slowing in the temperature record, as well as accelerated periods too. It is not (obviously) an attempt to predict the Earths recent atmospheric temperature changes.
The user can play with the relative strength of the various contributing factors by changing the "factors" in cells H3, I3, J3 and K3. The simple algebraic functions can be examined by looking at the formulae in cells C3-G3
Link here.
Suggestions, improvements, corrections welcome ...
-
wili at 21:29 PM on 30 December 2014Record-Breaking Sea Surface Temperatures in 2014: Has the Climate Shifted?
I need help understanding something here: In the second paragraph in the text of the article it says: "during the negative phase of the Interdecadal Pacific Oscillation (IPO) stronger winds mix more heat into the oceans"
But the graphs at figure 3 seem to show stronger winds specifically in the positive phase of the IPO. I have a feeling that 'zonal wind stress anomalies' is measuring something (to me) counterintuitive.
Any help for my bewilderment would be most welcome.
-
wili at 21:01 PM on 30 December 2014Andy Skuce's AGU Fall Meeting 2014 poster presentation
Thanks for this. These are things that I hadn't considered much, especially the contribution of CO2 to sea level rise. Even if they make up a small percentage of the total, it's good to have something like a full accounting, and to have numbers to refer to if someone either assumes the contributions from these sources would be much larger or smaller.
One question: Should we even be including RCP 2.6 in our discussions anymore as anything other than a 'road not taken'? Haven't we pretty well left that pathway a while ago, now? I realize it is still in the IPCC, so I guess that is considered kind of the standard to go by. But it seems to me that constantly including it can give some people the wrong (dangerously wrong, I'd say) idea that it is still a possible future scenario. Is it?
-
chriskoz at 12:45 PM on 30 December 2014Skeptical Science at the 2014 AGU Fall Meeting
How about the talk:
hemispheric asymmetry in volcanic forcing
by Chris Colose? Why isn't it listed here among SkS presenters?
The talks by John & Andy have been summarised herein SkS, good to see.
However I'd be very interested in Chris' talk at AGU. Any plans to bring it in for SkS readers?
-
Quick at 09:44 AM on 30 December 2014Arctic sea ice has recovered
Just caught this on Yahoo earlier:
Moderator Response:[DB] Link truncated.
-
MA Rodger at 04:47 AM on 30 December 2014Record-Breaking Sea Surface Temperatures in 2014: Has the Climate Shifted?
From Peru @8.
The most up-to-date IPO data I know of is the most recent of Folland's quarterly data which is up to mid-2008. (Note that England et al (2014) FIg 1a is not a plot of IPO but a plot of annual global temperatures with annotated IPO phases.)
If you are after spotting climate shifts there is a quartet of graphics which show equitorial Pacific SST, SL & wind stress 1980-to-date on this NOAA-NCEP page (the 8th set down) that you might find useful. A graphics package would easily stitch them all together into one image.
-
dvaytw at 00:20 AM on 30 December 2014Hockey stick is broken
Oh man, CBDunkerson, man did you just help me put egg on somebody's face. Much appreciated.
Prev 632 633 634 635 636 637 638 639 640 641 642 643 644 645 646 647 Next


