


 Arguments


Recent Comments
Prev 638 639 640 641 642 643 644 645 646 647 648 649 650 651 652 653 Next
Comments 32251 to 32300:
-
CO2 effect is saturated
WRT the effective radiating altitude, it's worth comparing the spectra of emitted IR to the atmospheric temperature profile.
Emitted IR, single point, US Standard Atmosphere:

Atmospheric temperature profile:

What's interesting is that for any GHG wavelength you can go from the amount of IR radiating to the temperature to the effective radiating altitude.
In the CO2 trough you can see emissions bottoming out around 220K, or -53C. At the tropopause temperatures are around -50 to as low as -70C, ~223 to 203K, indicating that valley and those wavelengths represent an effective CO2 emission altitude at the tropopause.
In the center of the CO2 trough where absorbance is particularly high there is a smaller peak - that comes from a small band of IR emitted by CO2 in the warming stratosphere. For most of the IR spectra the tropopause represents the upper limit on the effective radiating altitude. And for that very reason the upper end of convective overturning, as the energy necessary for the tropospheric inversion and convection radiates to space at that point.
-
michael sweet at 02:59 AM on 9 December 20142014 SkS Weekly Digest #49
Real Climate has an excellent post debunking Watts "World Climate Widget" graph here (currently top post). Skeptical Science may want to post a similar OP, or just repost the Real Climate one. They link a widget that could be linked at SkS also.
-
Alexandre at 02:39 AM on 9 December 2014Even climate change experts and activists might be in denial
JH (moderator),
I actually read that in one of his books, and I would have to be home to look for that... but a quick search on Google gave me this:
"He [Lovelock] also criticized growing demography, which causes pollution and over-exploitation of natural resources, stating that if the world population amounted to 500 million people none of the environmental problems that the world was then (and still is) facing would exist." (link)
Although I find that figure plausible, I don't think he provides details of the reasoning that led to it, even in his book.
Moderator Response:[JH] Thank you. As they say, "context is everything."
-
Alexandre at 00:41 AM on 9 December 2014Even climate change experts and activists might be in denial
Wol at 23:45 PM on 8 December, 2014
If I remember right, James Lovelock put that figure in 500 million people.
Moderator Response:[JH] Please validate the figure you cite and provide context.
-
Wol at 23:45 PM on 8 December 2014Even climate change experts and activists might be in denial
I keep, unapologetically, coming back to the fundamental problem: overpopulation.
The sustainable planetary population - with a modern standard of living - is probably less than 2-3 Bn.
Unless this is recognised an addressed we are bashing our heads against the brick wall - and climate change is only one aspect of the sustainability question.
Moderator Response:[JH] Please cite recent reports and/or peer-reviewed papers that underpin you position.
-
Tom Curtis at 17:42 PM on 8 December 2014CO2 effect is saturated
Anne Hyzer @379, that is a very complicated graph that has been launched like an iceberg on an unsuspecting public. It is unsurprising that you have misinterpreted it (as I have on a previous occasion).
Teasing out the complexities, the first thing to note is that it is a graph of spectral cooling rates by pressure altitude and wave number. Because it shows cooling rates, positive values show a net cooling effect at that wave number. It is important to recognize that it is by wavenumber, as integrated across all wavenumbers (ie, into the ultraviolet), ozone has a net warming effect rather than the net cooling effect shown which appears to be shown here.
The second complexity is that the spectral cooling rate is the total emission less total absorption at that altitude and wave number divided by density times the heat capacity of the atmosphere at that level. The heat capacity is in fact not constant with altitude because atmospheric composition is not constant with altitude. In particular, the water vapour concentrations falls rapidly as you ascend in the troposphere. Further, density falls rapidly with altitude as well. Density scales very approximately with pressure in the atmosphere, so that at a pressure of 100 mb, the energy emitted minus energy absorbed is very approximately one tenth of what it would be for an equivalent spectral cooling rate at sea level. At 1 mb pressure, it is 1000th. That is a significant underestimate of the actual scaling due to the greatly reduced heat capacity at altitude as a result of the greatly reduced water vapour content.
Combining these two factors, and the title of the graph seen when you run your mouse over it here (which I assume you put in) and your interpretation of the graph are both completely wrong and misleading.
Adding further complexity is that the scale is not uniform (being linear below six, and logarithmic above it), and the colour scale was chosen to emphasize features in the stratosphere and hence are not terribly informative in the troposphere. Further, this graph is for Mid Latitude Summer conditions, and do not represent a global average.
As it happens, the original paper has a host of interesting figures which would obviate the confusion caused by the above graph without detailed discussion. Most helpful in this case is Table1:

As can be seen both upward and downward flux are highest at the surface, where the difference between them (net flux) is also smallest. At the surface, upward flux is 423.5 W/m^2 but downward flux is 346.9 W/m^2 leaving a net upward flux of 76.6 W/m^2. At the tropopause, upward is 287.6 W/m^2, downward is 22.3 W/m^2 and net is 265.3 W/m^2. At the TOA, there is no downward, so upward= net = 283.3 W/m^2. Further, because at any location, upward emissions from that location equals downward emissions from that location, we know that upward emissions from the stratosphere never exceed the downward emissions at the bottom of the stratosphere, ie, the 22.3 W/m^2 downward emissions at the Tropopause.
With that in mind, consider the chart of net upward IR flux below:

As you can clearly see, the net upward IR flux is smallest at the surface, and rises rapidly with altitude up to the tropopause. You will also see that doubling CO2 reduces the net upward IR flux. Table 1 from the original paper specifies the reduction in net upward IR flux due to doubling CO2 to be 2.8 W/m^2 at the TOA, and 5.6 W/m^2 at the tropopause. Given that the normal definition of radiative forcing is the change in net upward IR flux at the tropopause after equilibrium adjustment for the stratosphere, and that this is a Mid Latitude Summer atmosphere, these figures are consistent with the accepted forcing of 3.7 W/m^2.
Finally, one more figure from Clough and Iacono 1995:

This figure shows the change in spectral cooling rate for an increase in CO2 concentration from 335 to 350 ppmv (approx) among other changes. As you can clearly see, the effect is a warming effect in the troposphere (100 mb and lower) with most of the warming being in the wings of the CO2 band. There is a cooling effect in the stratosphere. (Note, this graph uses a more detailed resolution, allowing more detail of differences in wave number to emerge than in the more commonly shown graph.)
So, as figure 5 and plate 9 of Clough and Iacono 1995 clearly show, the CO2 effect is not saturated, and increasing CO2 warms the troposphere.
Note: In the original version of this comment, I made a blunder in interpreting Fig 5. The original text is preserved below in the interests of transparency. I have, however, struck it through to make it clear that (except where it agrees with the text above) it no longer represents my opinion.
Most helpful in this case is their plot of net upward IR flux by altitude integrated across the spectrum:
As you can clearly see, the net upward IR flux is greatest at the surface, and falls rapidly with altitude up to the tropopause. You will also see that doubling CO2 reduces the net upward IR flux. Table 1 from the original paper specifies the reduction in net upward IR flux due to doubling CO2 to be 2.8 W/m^2 at the TOA, and 5.6 W/m^2 at the tropopause. Given that the normal definition of radiative forcing is the change in net upward IR flux at the tropopause after equilibrium adjustment for the stratosphere, and that this is a Mid Latitude Summer atmosphere, these figures are consistent with the accepted forcing of 3.7 W/m^2.
-
One Planet Only Forever at 05:07 AM on 8 December 2014Even climate change experts and activists might be in denial
Another way to think about the issue is to understand that those who are more aware and better understanding of what is going on actually understand that the current developed lifestyle of the highest per-capita consumers is illigitimate and unacceptable. They are aware that the pleasures of abundant carefree damaging consumption are unsustainable. Yet they want all the personal benefit they have gotten away with developing a taste for, and more.
Their desire to have the amount of enjoyment they get always be increasing leads them to demand that the solution to this issue, and so many others, must be the development of a way for them to continue to get all the enjoyment they are fond of getting away with, and more. Any alternative has to be cheaper and more enjoyable for them.
They fail to understand that the starting point for development which could constantly improve conditions for everyone on this amazing planet is for many among the most fotunate to actually accept a step down, a reduction of excess personal pleasure, comfort and convenience. The current developed enjoyment of most of the most fortunate that everyone else aspires to develop to is clearly undeserved, unsustainable and even currently impossible for everyone to develop to, let alone in the future when there is a dramatically diminished amount of easy to access non-renewable resources to fight over.
The impossibility and unacceptability of what many people want is clearly evident, yet they struggle to admit it, because they like what they have developed a taste for. They like to benefit at the expense of others, particularly at the expense future generatons or slave workers in foreign lands who cannot effectively challenge them regarding their inconsiderate attitudes and actions.
In other words many people like to get away with whatever they think they can get away with, and will even try to get away with not thinking about the unacceptability of what they are getting away with.
-
PhilippeChantreau at 03:33 AM on 8 December 2014CO2 effect is saturated
Anne, I'm not sure that you're correctly interpreting the Iacono and Clough graph. It is essentially a heat loss diagram and shows the role of various GHG in stratospheric cooling. I'm sure Tom Curtis can help more.
-
Jose_X at 02:59 AM on 8 December 2014Mercury Rising: 2014 Likely to Surpass 2010 as Warmest Year on Record
One Planet Only Forever, I'll try to be clearer by listing all of the key data that shows that the prior 12 months is currently the highest 12 month average.
12-Month, January, look for the highest value. It's .63C (134th)
12-Month, February, look for the highest value. It's .64C (134th)
12-Month, March, look for the highest value. It's .64C (134th)
12-Month, April, look for the highest value. It's .66C (134th)
12-Month, May, look for the highest value. It's .66C (134th)
12-Month, June, look for the highest value. It's .66C (134th)
12-Month, July, look for the highest value. It's .67C (134th)
12-Month, August, look for the highest value. It's .67C (134th)
12-Month, September, look for the highest value. It's .67C (134th)
12-Month, October, look for the highest value. It's .68C (134th) *** highest ever.
12-Month, November, look for the highest value. It's .66C (133th)
12-Month, December, look for the highest value. It's .65C (134th)Note, December starts the cycle that is why it is at 134 and not 133. When December 2014 rolls around, it will be the first 135 for the prior 12 month period (ie, that will be the first time there will have been 135 Jan, Feb, ... and Dec).
-
Anne Hyzer at 01:32 AM on 8 December 2014CO2 effect is saturated

-
Anne Hyzer at 01:28 AM on 8 December 2014CO2 effect is saturated
I understand that most radiation comes from the troposphere as you say, outside the CO2 band, but this source says almost all of the CO2 band's radiation comes from the upper stratosphere.
-
wili at 14:10 PM on 7 December 20142014 SkS Weekly News Roundup #49B
Thanks again, TC. I do wonder what the main variations were in the assumptions of the various projections.
And thanks also for the explanation of the linear versus log thing--it was one of the other things gnawing at me about this study.
-
Tom Curtis at 10:53 AM on 7 December 20142014 SkS Weekly News Roundup #49B
chriskoz @5, there has been a variety of research showing that, for whatever reasons, since the industrial revolution warming has been effectively linearly correlated with cumulative emissions. Based on that research, scientists have determined the trillion tonnes of carbon benchmark which approximately correlates with 2 C warming (which was determined by policy makers). By reporting their result in terms of milli-Kelvins per gigatonne of Carbon, Ricke and Caldiera have obviously attempted to connect their data to that line of research, so I simply rescaled to make the comparison.
Having said that, you are of course correct that CO2 forcing rises with the log of concentration so that a 1 gigatonne emission will have a much larger effect from a 289 ppmv base than it would from a 489 ppmv base. However, for their projections, Ricke and Caldiera used a 389 ppmv base, so that the linear approximation should be good over at least the range from 390 to 450 ppmv, ie, to the point were we exceed the 2 C limit.
-
Tom Curtis at 10:44 AM on 7 December 20142014 SkS Weekly News Roundup #49B
wili @3, Ricke and Caldiera write:
"Across the 6000 combined projections, there is a high degree of concordance on the overall magnitude and general shape of global warming resulting from a CO2 emission (figure 1). A pulse emission of CO2 results in a stepwise increase in atmospheric CO2 content, followed by a slow decrease as the CO2 is taken up by the oceans and terrestrial biosphere. Global temperature rises in response to the CO2 forcing, but with a lag of about a decade due to the thermal inertia of the upper layers of the ocean. The maximum temperature is reached when the ever-decreasing rate of warming in response to the increase in radiative forcing is balanced by the slowly decreasing magnitude of radiative forcing of atmospheric CO2."
Figure 1 is, of course, the figure I have shown. Based on that, Max is the maximum temperature at a given year out of all 6000 projections, 99% would be the line such that just 60 projections are as warm as or warmer than that line in the given year, and so on.
-
Trevor_S at 10:20 AM on 7 December 2014Even climate change experts and activists might be in denial
Professor Kevin Anderson stated in a speech in 2012 that we have not yet begun to counternace the changes we need to make. This still holds true.
Talk of putting in another airport etc rather than discussing shutting them down for example. Until the wider community starts to realise what's needed, all I can do is cut my CO2e emissions to as close to 2t per annum as I can, engage my peers and friends in debate about reduction and only vote for politiacns that have effective mitigation as part of their climate policy.
I don't agree with 5's approach of trying to educate his congressmen, just let them kow they can't count on your vote because of their support for climate denial. Same here in Australia, neither the ALP or the LNP have effective mitigation policies, so anyone concerned with climate change who thinks effective mitigation should be part of policy and votes for either is wasting their vote. Yet 90% or so of my fellow Australians vote for them, this shows me denial is at least 90%, regardless of what they may say in a poll.
Same with 7. I think that was the point of the article, denial is increasing necasue emissions are incerasing, saying you're concered about climate change and then flying to Bali for holkdays is the crux of what the article was about.
-
chriskoz at 10:17 AM on 7 December 20142014 SkS Weekly News Roundup #49B
Tom@2,
How can you linearly extapolate mK/GtC into K/TtC in such straight manner while we know that the ECS in K/dCO2 in logaritmic? Did they "calculate" their tiny dT increments from radiative equilibrium + H2O feedback of did they simply intrapolate transient sersitivity from Charney?
Besides, the difference between 2.2 C per trillion tonnes of Carbon (result of your extravagant extrapolation) and assumed 2C/1000GtC for policy measures is so small compared to uncertainty that it's not worth mentioning.
-
chriskoz at 10:04 AM on 7 December 20142014 SkS Weekly News Roundup #49B
"George Shultz gone solar" while being a good example that the mind of even most hardcore republicans is changeable, contradicts the claims by some people that mostly older "hard-core traditionalist" who cannot change their thinking process and their FF burning habits, deny the climate change. Shultz example shows that you can change your thinking and your habits at any age.
The bad news here is: the denialism will not die out naturally with the gradual passing of current GOP members. Younger generation that is taking over, like Ken Cuccinelli in VA who could be Shultz' grandson, is a prime example that denial will continue to thrive.
-
wili at 09:01 AM on 7 December 20142014 SkS Weekly News Roundup #49B
Thanks, TC. One further question for now--what does "Max" mean in the graph you present from the paper? Is that 'maximum sensitivity'? 'maximum level of warming from all the model attempts'?? Or what? I'm afraid I still find it hard to determine the value, if any, of this study. How many feedbacks did they include, positive and negative? What were assumptions (if any) about aerosols' effects? ...
-
Tom Curtis at 08:21 AM on 7 December 20142014 SkS Weekly News Roundup #49B
wili @1, it is a very interesting result. What it is not saying is that the time to reach the Equilibrium Climate Response (ie, approx 3 C per doubling of CO2) is just ten years. Rather, it is factoring in both the rise in temperature due to increased CO2 together with the fall in CO2 concentrations over time with further ocean uptake assuming no further emissions. As I have often noted, the two have approximately equal time scales so that the long term response to increased CO2 if we cease all further emissions approximates to the Transient Climate Response rather than the Equilibrium Climate Response.
In their model experiments they released just a single pulse of CO2 and hence had no additional emissions. The result is a warming profile over the following century like this:

There is an initial sharp rise in temperature during the period of most rapid response to the increase in CO2 (due to the response to the CO2 forcing plus the water vapour feedback), followed by a slow decline as the reduction in CO2 concentration slightly outweighs the continued feedbacks to the initial warming. It is not clear whether their models allowed for melting of permanent ice sheets, and hence for the full range of feedbacks, so that slow reduction may be a slow rise with all feedbacks included.
In policy terms, the paper contains some good news and some bad news. The good news is that if we cease all emissions, future temperature rises will rapidly come under control, and at a lower temperure than the ECS often quoted would suggest. With ongoing emissions as per the various RCP scenarios, however, temperatures will continue to rise well into the future. So the good news is only good if we take action to curtail emissions.
The bad news is that they find a 2.2 milli Kelvin temperature rise per gigatonne of CO2 emitted, or 2.2 C per trillion tonnes of Carbon. Current policy discussions assume that if total human greenhouse gas emissions can be restricted to just one trillion tonnes of CO2e, we have a 50-50 chance of avoiding a 2 C temperature rise. On these figures we need to restrict total emissions to 0.9 trillion tonnes to obtain the same percentage chance. It should be noted, however, that not all emissions are CO2, and other gasses are not as long lived in the atmosphere so that they will have a shorter time to peak warmth, and a more rapid decline in warming effect.
As a final point, in the paper Ricke and Caldiera suggest warming will last longer than 100 years. In fact from carbon cycle studies we know that it will last thousands of years, and potentially tens of thousands of years, albeit at a reduced level. However, the time scale for Earth System Responses to CO2 increase (ie large scale melting of ice sheets and changes in albedo to widespread changes in ecosystems) approximately matches the time scale for the reduction in CO2, so the decline in temperature over the long term will not be as rapid as the decline in CO2.
-
shoyemore at 06:08 AM on 7 December 2014Even climate change experts and activists might be in denial
I take issue with the statement:
Climate denial is undoubtedly on the rise, particularly in those media-saturated markets of North America, Europe and Australia.
The data does not bear that out - for example in this George Mason U Poll: In Jan 2012, the number of people who "Believe Global Warming is Happening" was 57%, that peaked at 70% in 2012, but has been stable at about 63% since 2013.
Climate Change and the American Mind
What we have seen is climate denial becoming entrenched, and becoming part of the group identity of a whole political class, which may be a minority, but a powerful and influential one. It is not as simple as just following where the science leads any more.
My understanding is that the IPCC Report states that it is possible to maintain the 2C limit with economic growth, but with an impact obviously.
-
wili at 03:26 AM on 7 December 20142014 SkS Weekly News Roundup #49B
WRT: "CO2 takes just 10 years to reach planet’s peak heat"
I wonder if some of the good folks here would have the time to do a main post on this. I frankly don't know what to make of it. Is this without including aerosols? Other feedbacks?? In their own graph, the line that says "Max" clearly peaks at about 30 years after initial emissions. In other words, I'm confused. And I'm betting many others are, too. So any further light you could throw on how to interpret this finding (Is it valid? Is there something they missed? If it's valid, is it 'good' or 'bad' news?...) would be greatly appreciated.
-
One Planet Only Forever at 02:17 AM on 7 December 2014Even climate change experts and activists might be in denial
Alexandre @4,
Burning non-renewable buried hydrocarbons simply cannot be continued. Not only does the activity produce harmful consequences, not just excess CO2, it is simply a dead-end activity.
The future of humanity requires no person to succeed in benefiting from burning the stuff, except temporary benefit obtained exclusively by the least fortunate to develop to sustainable ways of living. The richest should be required to live totally sustainably.
The reality is that there already is not enough that is easily available for everyone to burn as much as they want. We already have had many vicious global battles as greedy pursuers fight over the ability to benefit more than others while they disguise and excuse their pursuits as 'fights for freedom' or whatever other deception might gather 'sufficient' popular support in the moment.
There are already many developed ways to live decently without burning any non-renewable buried hydrocarbons. The problem is the perception that "it is impossible to live decently without burning the stuff". And the largest promoters of that delusion are the people who have the greatest potential to personally profit from prolonging the burning of the stuff. That said, it is clear that anyone enjoying an unsustainable and damaging lifestyle would 'get less personal enjoyment' from living more sustainably. The resistance to giving up any excess pleasure and enjoyment is the real problem.
Future generations have no vote, marketing power, legal power, or investment and purchasing power today. That continues to keep people who are immersed in current day over-consumptive socioeconomic activity focused on things that are popular and profitable for themselves in their region in their time, to the detriment of others and the future.
-
Alexandre at 23:59 PM on 6 December 2014Even climate change experts and activists might be in denial
I disagree with the article. You don't have to jump out of a ship to question the route it's taking.
Virtually everything you do today emits carbon. Leo DiCaprio could not make a film, and people could not watch it without emiting carbon. Skeptical Science could not be a website without carbon-based electricity to run the internet providers or people's computers. This does not mean denial. This means our society is based on a unsustainable system that requires polluting the atmosphere until -if unabated- it wrecks nature and agriculture.
I'm all for iniciatives to emit less, both individual and collective ones. I plant trees and gave up gasoline in my car (I use sugar cane ethanol). I recycle as much as I can, and help other households do so as well with my personal time and effort. I try to use as little electricity as possible. And I know this is not nearly enough to curb emissions.
If someone wants to campaign or lobby or research for a change in this system, he or she will have to travel, use electricty, eat food, wear clothes. This all has a carbon footprint today. I encourage this campaigner to be as effective and energy efficient as he can, but by all means, he should go on and do his work as well as he can, with my blessings.
-
shoyemore at 21:19 PM on 6 December 2014Even climate change experts and activists might be in denial
Sou has a post on the survey here
Climate action priorities of the populace
AS she points out, it is an internet poll, therefore suspect, though the sample is huge.
-
shoyemore at 21:06 PM on 6 December 2014Even climate change experts and activists might be in denial
Interesting survey - it is hardly lack of communication, since in the countries where these issues are most effectively communicated (Western Europe, North American, Australia, New Zealand) action on climate change rises into the Top 10. For example, in Western Europe it is the 6th most important issue, ranking just a hundred votes or so below "Freedom from Discrimination and Persecution".
You can also note that many issues ranking above action on climate change overlap with it heavily. You cannot address reliable energy, or access to clean water, or protection for rivers and forests, or affordable food, without bumping up against climate change in some form or other.
In other words, this is a complex output that demands more than a superficial reading.
-
william11409 at 17:37 PM on 6 December 2014Even climate change experts and activists might be in denial
From a recent world wide poll of over 6 million conducted by the United Nations (vote.myworld2015.org), climate change is placed last in a list of 16 items of concern to people (data.myworld2015.org). Why is this so? Lack of effective communication? Lack of interest? Not affecting people's daily lives? No incentives to change habits? Don't believe the science?
-
Tristan at 17:09 PM on 6 December 2014Mercury Rising: 2014 Likely to Surpass 2010 as Warmest Year on Record
I don't think it'll be a calendar record for UAH or RSS. Very hard for a non El-Nino year to set records in the lower tropospheric temperature series.
-
Donny at 16:31 PM on 6 December 2014Volcanoes may be responsible for most of the global surface warming slowdown
So this would mean that some of the "missing heat" never actually made it to earth?
-
elisat1 at 13:17 PM on 6 December 2014Mercury Rising: 2014 Likely to Surpass 2010 as Warmest Year on Record
jimlj @ 22,
Please define "calendar record". If you mean a record for global mean temperature anomaly in calendar year 2014, I don't see how you get that from the UAH data.
I did a quick average of the UAH monthly global anomalies over two complete calendar years. 2010 comes in at +0.40C, 1998 comes in closer to +0.42C while the 2014 averaged anomaly comes in at +0.272C through end of November. By that calculation, in order for the calendar year anomaly for 2014 to equal that for 2010, the December, 2014 anomaly would have to come in at +1.78C, in other words it would have to be the warmest month since December, 1978 (the start of the UAH table) by a factor of about 2.7.
-
TallDave at 08:08 AM on 6 December 2014Phil Jones says no global warming since 1995
"When all the heat accumulating in the oceans, warming the land and atmosphere and melting ice is tallied up, we see that global warming is still happening."
Naturally this article fails to mention that since the hydrosphere is 271 times as massive as the atmosphere, if oceans are absorbing the heat they are likely to moderate AGW into a nonproblem, as the average ocean temperature has only changed by .1 degrees in 50 years, an amount that is probably smaller than measurement error.
Moderator Response:[PS] please note the comments policy, especially the section on sloganeering. There are numerous papers on measurement error and you wish to dispute that please provide evidence to support it. That the oceans ameliorate warming hardly needs stating - without oceans, we would have warming by 36C. If you wish to propose that somehow heat uptake can increase to make it a "non-problem", then provide evidence to back it. The evidence from papers in the IPCC reports do not appear to support your argument. Further speculative sloganeering without support will be deleted.
-
wili at 03:42 AM on 6 December 2014Drought and Deforestation in Brazil
Thanks again for the info. Pretty much what I though. I imagine that most of the soybeans also go toward cattle feed. So pretty much our burger habit is obliterating the most populous area on this half of the planet...nice.
Meanwhile, as they scrape ever further toward the bottom of the barrel, water quality is getting noticably worse, and it's likely causing long-term damage to infrastructure: translate.google.com/translate?hl=en&sl=pt&u=http://noticias.portalvox.com/sao-paulo/2014/12/sabesp-registra-82-de-volume-de-agua-sistema-cantareira.html&prev=search -
SDK at 03:24 AM on 6 December 2014Models are unreliable
Just to add. How many in the general population would understand that today the model ensemble mean is correct because it strays away from the instrumental record? And that if the observed data was closer to the mean -— or even exactly on top it -— it would in fact be more wrong?
Now there’s a pedagogical challenge...
-
One Planet Only Forever at 03:00 AM on 6 December 2014Drought and Deforestation in Brazil
Deforestation for ranching, plantations and farming is also a major reason for the reduction of Indonesia's rain forests.
And in many nations the ranching, plantations, and farming is not done for 'internal consumption'. In many cases it is done for international trade. In some cases less fortunate nations are fooled into accepting 'development' loans to build massive infrastructure that is promised to bring them 'properity'. And the infrastructure is specifically focused on international trade, it is not hospitals and schools. All that it brings them is insurmountable debt and a desperate desire to expand their production of basic commodities for international trade. And their expansion of that activity reduces global prices for commodities reducing the benefit they get, all while their debt payments grow.
-
Phil at 02:26 AM on 6 December 2014The Beginners Guide to Representative Concentration Pathways - Part 3
There is one thing that seems to be missing from this (otherwise excellent) series. The relationship between CO2 emissions and their atmospheric concentration is known to be fractional (it is, if I recall correctly, currently about 45%) due to the uptake of CO2 by the oceans - acting as a carbon "sink" (and also resulting in ocean acidification). There is also some uncertainty over whether this figure will remain constant over time, but general agreement that it represents an upper bound on the ocean's capability to act as a CO2 sink.
So my question is; do the RCP's assume a constant ocean uptake of CO2 (at ~55%) or do they assume a decrease over time ? Also can we assume the uncertainty associated with GCM tempature projections do not include any contribution from the ocean uptake decreasing over time ?
Thanks -
billthefrog at 02:23 AM on 6 December 2014Volcanoes may be responsible for most of the global surface warming slowdown
MarkR@11
"circumference divided by diameter"
I'm afraid that's just Pi in the sky, Mark.
;)
-
SDK at 00:12 AM on 6 December 2014Models are unreliable
Thanks for the charts (from a fellow Tom who is also knee-deep into chart porn…)
Forget about the deniers, but these charts are not even close to addressing the concerns of the fencers either. At least when we need to attach complex disclaimers to them. I mean, if you ask say 90% + of the general population, they would have no idea what the ensemble mean actually erm… means in the first place. Isn’t that kind of a “double catastrophe” when you add the battle of public relations? We’ve won on the science, but losing badly in communications and framing the issue. Unfortunately, science doesn’t always fit nicely on a bumper sticker.
Sure, I can provide charts with the short-term weather noise removed, but then I’ll always be accused of chart manipulation… “after the fact”.
What if I had a chart e.g. from the early 2000s, showing that if the 3 main short-term natural fluctuations put a downward pressure on the GST in the coming years, it will produce a flattening of the curve? Further, why not just produce hundreds of those -— with a combination of premises -— which can subsequently be checked “after the fact”? As appendixes to the IPCC reports? Just asking as it sure as hell would've made my life easier arguing the AGW case on other forums.
-
Tom Curtis at 21:52 PM on 5 December 2014Volcanoes may be responsible for most of the global surface warming slowdown
MarkR @11, perhaps circumference divided by wavelength? But other than that, yes you are correct.
-
MarkR at 21:21 PM on 5 December 2014Volcanoes may be responsible for most of the global surface warming slowdown
I meant to say circumference divided by diameter...
Anyway, Tom's comments provide more detail as to why volcanic aerosols tend to have a cooling effect.
-
Alexandre at 20:32 PM on 5 December 2014Drought and Deforestation in Brazil
wili at 13:43 PM on 5 December, 2014
The data I have about that are not very recent (one paper from 2009 and another from 2003, both in Portuguese), but I don't think this has changed much in the meantime. It's mainly cattle ranching (more than half), and agriculture to a lesser extent, especially soybean plantation.
It's interesting and sad to notice that logging is a very minor activity comparing to those. Often the deforestation process is done with tractors simply pulling the trees out and discarding the wood. Logging is not a first step to other activities, either.
-
MarkR at 18:16 PM on 5 December 2014Volcanoes may be responsible for most of the global surface warming slowdown
Tom @8: there is a hidden wavelength dependence in Mie scattering. In the lecture notes you give, through the size parameter. This is labelled as 'x' in Eq. 9.36, and is (for a spherical particle) the diameter divided by the wavelength.
The scattering efficiency has a wavelength-squared depndence, even in the Mie regime. The phase function is also dependent on size parameter, with larger particles showing more forward scattering. And the scattering cross section also increases with particle size, assuming no major changes in the scattering efficiency.
So I'm pretty sure that aerosol scattering still has some wavelength dependence. It's weaker than Rayleigh scattering, but it is there.
-
One Planet Only Forever at 16:00 PM on 5 December 2014Drought and Deforestation in Brazil
vonMackwitz @3,
Unfortunately this recent BBC article indicates that what you hope for is not as likely as it needs to be.
-
wili at 13:43 PM on 5 December 2014Drought and Deforestation in Brazil
Thanks, Alexandre and vonMackwitz. Do either of you (or anyone else) have a clear idea what the main reasons for deforestation are in that particular region?
-
Tom Dayton at 12:17 PM on 5 December 2014It hasn't warmed since 1998
Excellent new post about the pause/hiatus (not) at RealClimate.
-
vonMackwitz at 11:58 AM on 5 December 2014Drought and Deforestation in Brazil
I sure hope that deforestation in Brazil will finally stop. If the deforestation really is contributing to draughts (which I think is likely), Brazil people will have to learn the hard way that reforestation is easier said than done.
-
CO2 effect is saturated
Anne Hyzer - In the troposphere convective overturning dominates, with the atmosphere warmed from below, under a state of constant inversion. Once past the GHG effective radiating altitude (where more than ~50% of upward emission for the wavelength in question is escaping to space without further absorption) and into the stratosphere, the dominant influence is UV warming from the sun, which is strongest at higher altitudes. And since the stratosphere is thermally stable, warmer at the top, convective overturning doesn't occur there.
-
Alexandre at 09:38 AM on 5 December 2014Drought and Deforestation in Brazil
Hi wili,Here in Brazil we've had some coverage of the (possible) link between drought and deforestation in the mainstream media (like this one, in a major news/entertainment Sunday show). The denialist lobby is not as strong here as it is in the US.Of course, nothing seems to suggest that public opinion will demand any action so far... -
Tom Curtis at 08:49 AM on 5 December 2014Volcanoes may be responsible for most of the global surface warming slowdown
rkrolph @6, it is an often neglected subtlety of climate change that the duration it takes to reach the full equilibrium response to a change in forcing is approximately equal to the duration required for the CO2 partial pressures of the atmosphere and ocean to equalize. That means, in the 100 plus years it will take to from current temperatues to the approximately 2 C Equilibrium Climate Response to 400 ppmv of CO2, the CO2 concentration of the atmosphere would have reduced to 340 ppmv. That means with the immediate cessation of all emissions, we are very unlikely to reach the 2 C limit. This only applies with the cessation of all emissions. Even continuing emissions at 10% of the current rate will sustain CO2 levels at a near constant level making it near 50/50 that we will exceed the 2 C limit at some time in the next century.
Unfortunately the IPCC tends to focus only on events in this century, and consider another 150 ppmv of CO2 in the atmosphere to be the limit compatible with having a 50/50 chance of avoiding the 2 C limit as of 2080-2100. As a matter of practical policy that is probably correct, but it does commit us to future sequestrtion of CO2 from the atmosphere.
-
Tom Curtis at 08:37 AM on 5 December 2014CO2 effect is saturated
Anne Hyzer @375, you are correct about the stratosphere increasing in temperature with altitude. Most IR radiation from the atmosphere comes from the tropospheresphere, however, so the above explanation is a reasonable simplification.
For a more detailed explanation, considering the following spectrum of outgoing IR radiation from an unknown (by me) location:

The spectrum has conveniently placed black body curves for particular temperatures (dashed lines). From that you can see that the chief absorption band for CO2 (centered at 650 cm^-1) has a broad flat base at approximately 220 K. That flat base represents the tropopause, where temperatures are unchanging with altitude for several kilometers (see temperature profile below). At the center of that flat base are two peaks, one much larger than the other. That represents radiation from the stratosphere. Also, and very importantly, on either side of the broad absorption band, at about 240 K, and againg at 250 K temperature, you will see notches in the wall, with the former being deeper and the latter broader. These are notches are from local peaks in absorption (emission) which are located within the troposphere.
As CO2 concentration increases, emissions at all wavenumbers in the CO2 brand will come from higher altitudes. That will have several effects. First, the broad plateau at 220 K will become wider emissions from the upper troposphere move into the tropopause. Second, the notches at 240 and 250 K will become wider and deeper as the emissions causing them move higher in the stratosphere. Also, the small notch at 800 cm^-1 will also deepen and widen (that notch also being due to CO2). Against this, the two peaks at the center will grow higher and widen. The combination of the other effects, however, will result in a greater reduction in IR radiation than will the increase due to increased emission from the stratosphere. As an added nuance, the increased CO2 will cool the stratosphere, which will tend to limit the increase in height and bredth of the central peak.
So, overall, outgoing IR emissions will decrease with increasing CO2, and that decrease will be entirely due to higher emission in the troposphere as indicated in the original post. The increase will be only partly offset by an increase in radiation from the stratosphere. All of this is included in determinations of CO2 forcing from standard radation models and Global Circulation Models, although arguably it was neglected prior to the correction to the basic formular for CO2 forcing by Myrhe et al, 1998.
-
Tom Curtis at 08:05 AM on 5 December 2014Volcanoes may be responsible for most of the global surface warming slowdown
MarkR @5, you have the essentials correct except that the blueness of the sky (and redness of sunsets) is due to Rayleigh Scattering, something that requires particles sizes about a tenth or less of the wavelength of light, it 38 to 75 billionth of a meter. Sulfate aerosols typically have sizes from 100 billionth to 5 millionth of a meter, and hence are scattered primarilly by Mie Scattering, which does not discriminate by wavelength. Because aerosol sizes have a size distribution, a small proportion of aerosols are small enough for Rayleigh scattering and will contribute to reder sunsets. Further, the wavelength of thermal radiation from the Earth is sufficiently large that scattering by aerosols is restricted to Rayleigh scattering, and is hence less efficient as you note. For a mathematical treatment, these lecture notes may be useful.
In addition to the scattering effect (the aerosol direct effect), aerosols form condensation nuclei for clouds, resulting in the aerosol indirect effect. The more condensation nuclei, the more water droplets in a given cloud, and the smaller the droplet size. That in turn results in a higher albedo in the cloud. This is seen in the phenomon of ship tracks, where clouds are thicker and more reflective over the paths of ships (as seen below):
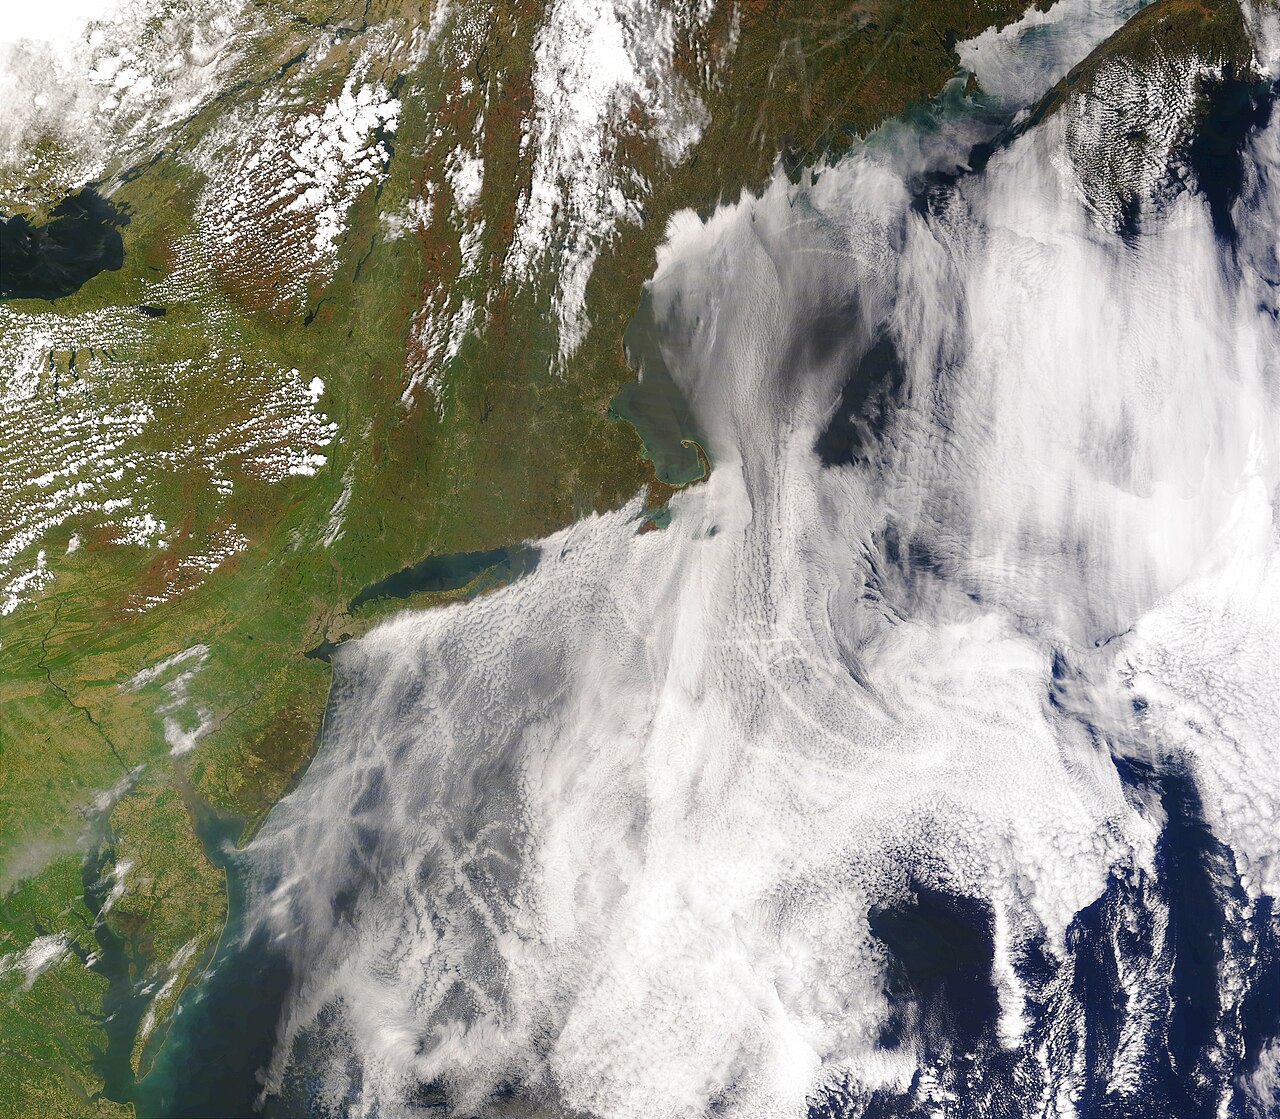
For reference, here is one of the early papers on the effects of aerosols.
-
wili at 07:57 AM on 5 December 2014Volcanoes may be responsible for most of the global surface warming slowdown
1) "I am assuming that the 2 deg on the y-axis is the 2 degree value we always hear discussed as the point we want to avoid exceeding"
No. The chart set its "0 degree" mark at the average for the last half of the 20th century, specifically 1961 - 1990. Whereas the 2 degree C limit dicussed in treaties is from a "0 degree" mark from the 1800s, iirc.
2) "Is there a delay effect such that even if we stopped emissions completely today that we might still reach the 2 degree point?"
Yes...well, probably. But in any case, we are not going to 100% stop emissions this year. So it's a moot point. Continued emissions at anything like todays levels for the next few years makes it pretty much impossible to stay below 2 degrees, as I understand it.
If you have a few moments, look at this from one of the top climatologists in the UK: Kevin Anderson 'Rhetoric to Reality'
If you have more than a few minutes, try this:
Real clothes for the Emperor: Facing the challenges of climate change
Prev 638 639 640 641 642 643 644 645 646 647 648 649 650 651 652 653 Next


