


 Arguments


Recent Comments
Prev 642 643 644 645 646 647 648 649 650 651 652 653 654 655 656 657 Next
Comments 32451 to 32500:
-
michael sweet at 08:24 AM on 7 March 2015Antarctica is gaining ice
Quantummist,
I posted a reply here where it is on topic.
-
michael sweet at 08:22 AM on 7 March 2015Arctic sea ice has recovered
Quantummist,
Your quote from NSIDC is interesting. I wonder why you picked a quote from Feburary 2014 istead of a more recent quote.
This years NSIDC report did not mention the CRYOSAT data. Nevin has a good article on the January 2015 PIOMAS data here. PIOMAS and CRYOSAT usually agree. The data does not really have anything unusual to report. Perhaps next week when the new PIOMAS data comes out it will be more interesting since, as the moderator pointed out, Arctic sea ice is currently at it's all time low for the date.
-
One Planet Only Forever at 08:11 AM on 7 March 2015The oceans may be lulling us into a false sense of climate security
billthefrog@8,
I share your understanding of the terminology. El Nino/La Nina conditions are the average surface temperature anomaly of the of the Nina 3.4 region. As indicated on the NOAA ONI history page we both linked to in our earlier comments, the anomaly is being measured against a 30 year average. And that 30 year average is updated every 5 years because the ocean has been warming. The NOAA ONI page includes a link to a page that presents how the 30 year average has increased. It also shows that the 30 year average is not just 'a temperature', the 30 year average that the anomaly is calculated from has a different value for each month.
So an El Nino condition occurs any time the Nino 3.4 region anomaly is 0.5 C or warmer (the term is probably even applicable when weekly average values are 0.5 C and above). And NOAA declares an El Nino event to have occured when a set of 5 consecutive 3 month averages of the Nino 3.4 anomaly, what they call the ONI, are 0.5 C or warmer.
The Australian Bureau of Meteorolgy definition of what constitutes an El Nino event may not be exactly the same. Their latest ENSO update here states there is a 50% chance of El Nino forming in 2015 even though by NOAA methods only one more month of warm enough waters would be needed for NOAA to declare that an El Nino event has occurred.
There is also a range of strengths of El Nino events and even the linking of the ocean surface temperatures to trade wind patterns that could spread the warming effect of air passing over the warmer ocean surface to other areas of the planet. And there is other Pacific Ocean surface anomalies like the current large warmer area off the west coast of N. America shown on the following Australian link that can occur without an El Nino event being declared.
It is very complex, but regardless of the potential variations of terminology there is no doubt that the warming due to excess CO2 from human activity continues to occur.
-
Quantummist at 05:42 AM on 7 March 2015Antarctica is gaining ice
In a statement issued on 5 February, the NSIDC said: “Preliminary measurements from the CryoSat show that the volume of Arctic sea ice in autumn 2013 was about 50% higher than in the autumn of 2012. In October 2013, CryoSat measured approximately 9,000 cubic kilometers (approximately 2,200 cubic miles) of sea ice compared to 6,000 cubic kilometers (approximately 1,400 cubic miles) in October 2012.”
Moderator Response:[PS] Please note that this topic is for discussion of Antarctic sea ice so arctic conditions are off topic. Also note that it is better to look at trends rather than short term variation though today's ice numbers are "interesting".
-
billthefrog at 05:12 AM on 7 March 2015The oceans may be lulling us into a false sense of climate security
@ John Hartz #6
Hi John,
On the Oceanic Nino Index page to which I linked in #5 (and unwittingly repeated in #7), it states that...
"For historical purposes cold and warm episodes (blue and red colored numbers) are defined when the threshold is met for a minimum of 5 consecutive over-lapping seasons"
I've always taken that to indicate the difference between el Nino conditions being met for some undefined transient period, and a formal el Nino declaration. (That's why the red/blue periods are always in groups of at least 5.
However, I was sure I had also read something to that effect elsewhere. The page I was trying to remember is here, and the relevant bit says...
"Niño 3.4 SST anomalies are averaged over the three months ending with the current month, and that value is called the Oceanic Niño Index (ONI). If the ONI exhibits warm or cool phase conditions for at least five consecutive values, it officially becomes an El Niño or La Niña event."
Obviously, if the basis of your understanding supersedes the above, then I stand corrected and humbly defer to you and Wili.
Either way, this is almost at the semantics level: I'm sure we all agree that it's on the cards - if not now, then next month.
cheers bill f (and apologies again for the inadvertent repetition)
Moderator Response:[PS] Fixes done as requested
-
Zeke Hausfather at 04:54 AM on 7 March 2015Understanding Time of Observation Bias
Slight error: the above figure is correct, but the TOBs corrections shown for USCRN are from midnight to 4 PM. All the TOBs corrections done to USHCN data are relative to a midnight observation time.
-
One Planet Only Forever at 04:53 AM on 7 March 2015The oceans may be lulling us into a false sense of climate security
The NOAA report indicates that current Nino 3.4 conditions are in the El Nino range. It also indicates the expectation is for low level El Nino conditions through 2015.
The NOAA report includes Figure 7 showing the ONI predictions of models (The NOAA ONI is the 3 month average of the Nino 3.4 region). Only a few models indicate the potential for a reasonably strong El Nino in 2014/15. Even the strongest model predicted event is significantly less than the magnitude of the 1997/98 event which had ONI peak values of 2.3 and 2.4 C as can be seen in the NOAA ONI value history here). Most models indicate a low level El Nino and a few indicate no El Nino.
The latest Australian summary of ENSO conditions here also indicates the expectation is only weak El Nino conditions to develop.
Modelling of long term generalized multi-year average climate conditions has been proven to be quite reliable (with the primary uncertainties being the actual impacts of things like how much excess CO2 will be generated), however, the accurate prediction by models of near term things like the ENSO is less 'reliable'. In spite of the variable success of near term prediction, in the big picture the average of the model predictions of many such potential climate related events is likely quite reliable. Said another way, if you looked at many years of predictions of the ONI the average predictions of all the models through all of the years would probably be seen to be quite reliable, even though specific years could be found where the outliers among the predictions were the ones that got 'that year right'.
So, for a strong El Nino event to develop in 2015 an outlier model prediction would need to be the correct one, which has a low likelihood of occurring, but such unlikely events can still be what happens.
What exactly will happen in the near term can be quite uncertain and is best forecast by "Wait and see", even though what will happen long term, in the averages of many years, is able to be quite reliably predicted.
-
Zeke Hausfather at 04:40 AM on 7 March 2015Understanding Time of Observation Bias
The folks at WUWT provide a critique of TOBs adjustments today that, ironically, provides a pretty good validation for those adjustments. They compare the Kingston USHCN station to a nearby pristinely sited USCRN station. The Kingston station had its time of observation shifted from 9 PM to 4:30 PM. If we do the same shift to the hourly Kingston CRN data, we get quite similar results:
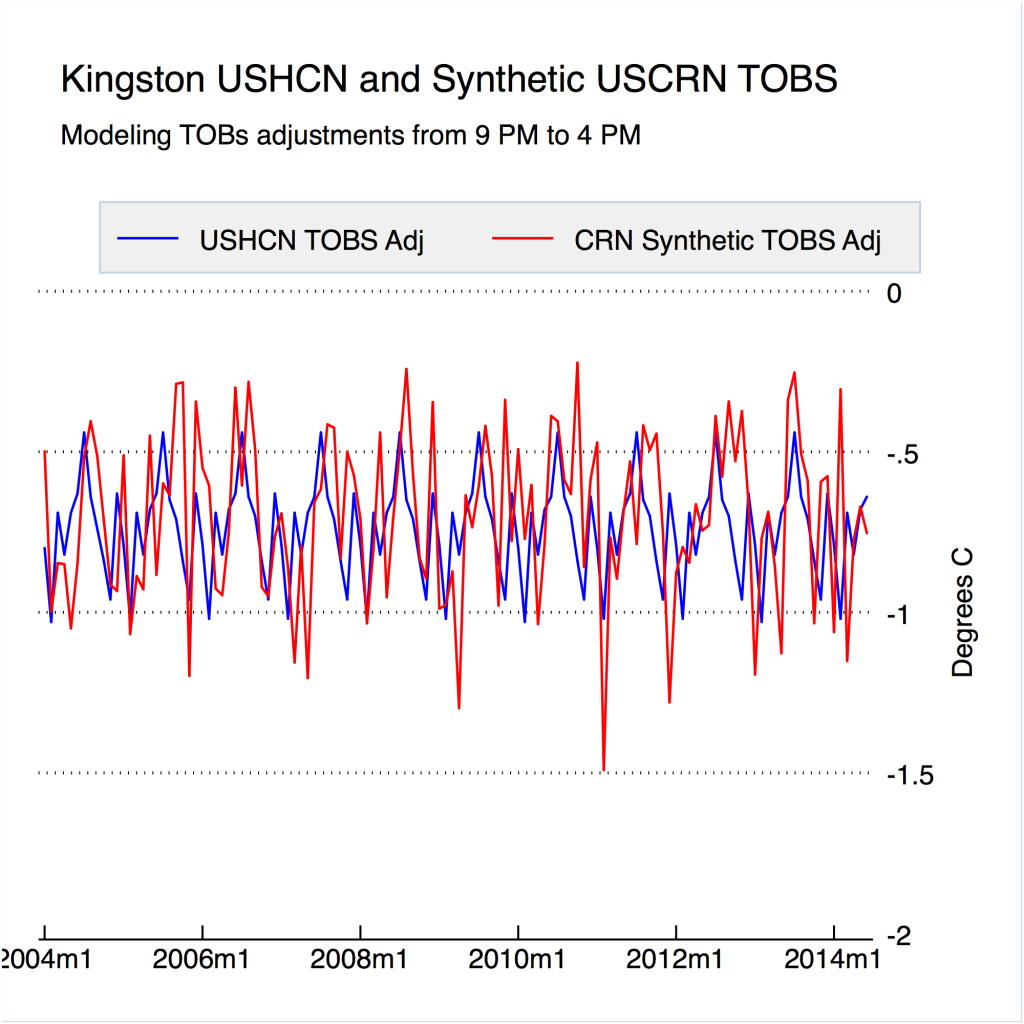
Over this period, the mean USHCN Kingston TOBs adjustment is -0.74
The "correct" TOBs adjustment based on the USCRN Kingston station is: -0.70Moderator Response:[RH] Adjusted image size. Please try to keep your images limited to 500px wide.
-
John Hartz at 04:15 AM on 7 March 2015The oceans may be lulling us into a false sense of climate security
bill f: I do believet hat wili is correct...
Just when everyone had pretty much written it off, the El Niño event that has been nearly a year in the offing finally emerged in February and could last through the spring and summer, the National Oceanic and Atmospheric Administration announced Thursday.
This isn’t the blockbuster, 1998 repeat El Niño many anticipated when the first hints of an impending event emerged about a year ago. This El Niño has just crept across the official threshold, so it won’t be a strong event.
“We’re basically declaring El Niño,” NOAA forecaster Michelle L’Heureux said. “It’s unfortunate we can’t declare a weak El Niño.”
After Much Ado, El Niño Officially Declared by Andrea Thompson, Climate Central, Mar 5, 2015
-
billthefrog at 02:58 AM on 7 March 2015The oceans may be lulling us into a false sense of climate security
Hi Wili,
I think you will be proven correct, but you're slightly premature at the moment.
The key phrase to look out for is "el Nino conditions".
For an el Nino to be declared, the 3-month rolling average has got to be 0.5oC (or more) up on climatology for at least 5 consecutive periods. The last 5 such periods were as follows...
ASO(+0.2) SON(+0.5) OND(+0.7) NDJ(+0.7) DJF(+0.6)
We therefore need to wait for the March numbers, but - assuming I've got my sums right - unless the monthly anomaly drops to below about +0.2oC, then the 3-month JFM figure should be at least +0.5oC (with rounding).
The rolling-3 figures are given here.
cheers bill f
-
hank at 02:52 AM on 7 March 2015The oceans may be lulling us into a false sense of climate security
> potential for a strong El Nino developing this year too.
Did you mean to quantify that as "low potential for a strong ..."?
I haven't found an agency suggesting a strong El Nino is at all likely.E.g. http://www.realclimate.org/index.php/archives/2015/02/climate-oscillations-and-the-global-warming-faux-pause/comment-page-3/#comment-626577
Moderator Response:[Rob P] - Don't have much time to explain at the moment, but I'm writing a series on the Interdecadal Pacific Oscillation (IPO) which ties into this.
You are, however, misinterpreting what I have written. The potential for a strong El Nino exists because the southern hemisphere subtropical cell and subtropical ocean gyre circulation have spun down, unlike last year where the trade winds were persistent south of the equator. There is a greater potential for the current Kelvin wave to cross the Pacific and not be weakened by the subtropical cell and South Equatorial Current pumping heat out of the tropics - thus encouraging atmospheric reinforcement.
This doesn't mean we are due for a strong El Nino, merely that underlying oceanic conditions are more conducive to such. The situation could quickly change. As ever, I keep a beady eye on the situation.

-
hank at 02:48 AM on 7 March 2015The oceans may be lulling us into a false sense of climate security
Typo alert for the main article above:
"continued warming of the plant"
-
wili at 02:37 AM on 7 March 2015The oceans may be lulling us into a false sense of climate security
Thanks for the reply and the cool graphs.
Sooo, is it time for another El Nino update?
-
Peter Metaskeptic at 22:12 PM on 6 March 2015New Series: Science Communicators – Why We Love Communicating Science
It's not much, but it's a start. I'm grateful and won't ask for more insights, at least here.
Thank you all. See you around :)
-
billthefrog at 22:06 PM on 6 March 2015Does providing information on geoengineering reduce climate polarization?
Glenn,
I hadn't realised that Gilbert Plass's work was funded by the ONR - just goes to show that, even at my advanced age, one can still learn something new every day. (Assuming one is prepared to do so, of course!)
cheers bill f
-
Stephen Baines at 22:02 PM on 6 March 2015New Series: Science Communicators – Why We Love Communicating Science
Peter,
You are asking people to explain why they don't understand what they don't understand, which of course requires that they understand it. I read your post and it is very difficult to understand. You have to take that as an honest assessment of a reader.
It sounds like you are basically saying that we need a science that makes more of an emotional connection with people. What that entails exactly, even what you even mean by science in this case (you seem to be using teaching science as an example), and even if I am interpreting your statement correctly, is unclear to me.
It probably is not appropriate on this thread to properly dissect the ins and outs of your blog post in detail. Maybe you could bring a single observation or point up for discussion?
-
Glenn Tamblyn at 21:23 PM on 6 March 2015Does providing information on geoengineering reduce climate polarization?
BTF
"Sounds like the Pentagon is part of that sneaky red/green commie/environmentalist plan to install a one-world government under the aegis of the United Nations.".
Yep. And it goes all the way back to at least the 1950's.
Gilbert Plass's work leading to his publication of "The Carbon Dioxide Theory of Climate Change" in 1956 was funded by the Office of Naval Research.
And the data in the HiTran spectroscopic database on infrared absorption properties of gases in the atmosphere was first being measured during the 1950's in support of US developments of the first heat-seeking air-to-air missiles.
The commonly used program ModTran that can be used to calculate infrared transmission through the atmosphere is 1/2 owned by the Pentagon. The officer responsible for signing-off on it's specs, testing and acceptance was for many years the Commandant of the USAF Geophysics Laboratory at Hanscomb Air Force Base in Massachusetts.
-
Peter Metaskeptic at 20:54 PM on 6 March 2015New Series: Science Communicators – Why We Love Communicating Science
I get the picture :D
Now, I could bring the crouton but I would rather have an explanation. Fair enough for you?
-
Rob Painting at 20:20 PM on 6 March 2015New Series: Science Communicators – Why We Love Communicating Science
It's word salad to me as well.
-
Peter Metaskeptic at 18:56 PM on 6 March 20152015 SkS Weekly News Roundup #10A
About "We must defend science if we want a prosperous future" by Barry Jones.
Texts like this one are very important because they point out to a much bigger issue than global warming alone, or vaccination, etc. Good thinking, or the lack of, is a root problem that has to be address.
Regarding our line of defense, I would add that we should make a heavy use of social dilemmas.
-
Peter Metaskeptic at 18:14 PM on 6 March 2015New Series: Science Communicators – Why We Love Communicating Science
Rob Honeycutt,
Could you at least give one example of a sentence or a paragraph that lacks coherency? It might be really helpful. Thx.
-
Rob Honeycutt at 14:43 PM on 6 March 2015New Series: Science Communicators – Why We Love Communicating Science
While I would agree that christoz could be a little more polite, having now attempted to read Metaskeptic's piece, starting from the opening sentence, I find it to be completely incoherent. I could only describe this as word salad.
-
Peter Metaskeptic at 12:23 PM on 6 March 2015New Series: Science Communicators – Why We Love Communicating Science
chriskoz,
Frivolous person and I intimidate girls, whoua, you got my attention for sure. My answer is: you may be annoyed by the text, but there was no need to goes that far.
I will answer any fair question regading argument in my texts.
Have a nice day.
Moderator Response:[PS] Agreed, lets keep this seemly.
-
KR at 12:13 PM on 6 March 2015New Series: Science Communicators – Why We Love Communicating Science
ryland - It's not how loud you are, but whether or not you're heard.
Over the last few years I've seen more and more mainstream media (MSM) references to Skeptical Science, to RealClimate, etc, as reliable go-to sources of information.
And as Rob points out, the signal to noise ratio on SkS and RealClimate is worlds above that on the major denier blogs, where the comments seem to consist primarily of "yeah, me too", "it's a conspiracy", "you can't trust the scientists", repeated ad hominems, whackadoodle personal theories amounting to 'Just So' stories, and so on, rather than questions, information, or exchanges regarding the science of the opening posts.
Personally, I feel that that the content on the science sites is far higher than on the denier blogs.
-
PhilippeChantreau at 10:29 AM on 6 March 2015New Series: Science Communicators – Why We Love Communicating Science
SkS, Real Climate andOpen Mind are better communicators of climate science. Those other sites mentioned are much better communicators of BS, the kind that rings an ideological bell with a large portion of the population. That is what their popularity is based on. Not to mention the histrionics like "we're going to hang them all" type of thing, which never fails to get the crowds excited...
-
Daniel Bailey at 10:10 AM on 6 March 2015New Series: Science Communicators – Why We Love Communicating Science
Ryland posits a false equivalence, in that Ryland presupposes that the volume of comments is indicative of communication veracity.
In reality, in the time that it takes for Skeptical Science to pull up the pants-legs of scientific truth, the anti-science "skeptics" make up things that circle the planet 8-fold.
-
Rob Honeycutt at 09:48 AM on 6 March 2015New Series: Science Communicators – Why We Love Communicating Science
ryland... I would look at those numbers more in terms of signal to noise ratios. Anti-science blogs produce a tremendous amount of noise relative to any possible signal (legitimate scientific information). You should look at how much moderation is done on each site to tamp down the noise. Most of the anti-science blogs do little or no moderation, or worse, they actually moderate out more rational discussion in favor of the noise.
-
ryland at 09:18 AM on 6 March 2015New Series: Science Communicators – Why We Love Communicating Science
Is it fair to say that the various blogs, such as Skeptical Science, that put up posts on climate change are science communicators? As I thought it might be I looked the 20 most recent posts on each of six blogs, three largely agreeing with AGW and three more sceptical, and counted the comments for each of the posts. For the pro-AGW blogs Skeptical Science had 207 comments in total, RealClimate had a total of 2565 and Open Mind atotal of 1055 comments. This gave a a grand total of 3827 comments from readers of these blogs. For the more sceptical blogs, JoNova had a total of 3019 comments, Climate Etc had 8988 and WUWT 2730 This is a grand total of 14737 which is nearly four times the number of posts at the pro-AGW blogs.
I don't know whether or not all of the comments on all of the posts were in agreement, I doubt it, but why are there so many more on the sceptical blogs? From the numbers I think it reasonable to assume the readership of the more sceptical blogs is either a lot greater than for the pro-AGW blogs or on average, each commenter at the sceptical sites writes four times as many comments which seems unlikely Assumingit is the readership that is so much greater why is that as the pro-AGW blogs would be expected to be the better communicators of climate science to their readers?
-
chriskoz at 08:15 AM on 6 March 2015New Series: Science Communicators – Why We Love Communicating Science
Peter@8,
I've read your "Meta Skeptic pledge". I think you give very poor example of an interraction with 16y old girl at a counter as your approach to science communication. Those two have nothing to do with each other. One is your frivolous entertaining desire to intimidate the girl (or even overpower her ino unjustified submission), another is a responsible job of a teacher who wants future generations to inherit his knowledge.
In general you fail to distinguish entertainment from work, frivolous ignorance from responsibility. That does not make sense, like failing to distinguish falsehood from truth.
So the answer to your "pledge" is: teacher A is always better when it comes to his main job of having future generations inherit science. If A realises he made a mistake at some point (no one is perfect A in a real world - we are all a mix of A+B), then he must correct his mind and his teachings, according to the requirements of his profession. An entertaining abilities of teacher B is nice and of course A+that entertaining bit of B is desirable and better than A only, however it's only a gravy over a main meat of science accuracy.
Moderator Response:[PS] The tone of this comment is hardly conducive to constructive debate. Please avoid throwing accusations around.
-
billthefrog at 06:18 AM on 6 March 2015Does providing information on geoengineering reduce climate polarization?
@ PluviAL
Hi there,
First off, your choice of the initials BAE might not go down too well with BAE Systems plc. ;)
More seriously, I'm afraid your laid back attitude to the use of SI units is more than a little confusing. The phrase "air contains about 10 to the 22nd joules/watts of energy" being a prime example. The joule is the SI unit of energy, and the watt is the SI unit of power, and ne'r the twain shall meet.
If you have a TV or DVD that has a power consumption of just one watt when left in standby mode, that would still add up to an energy consumption of nearly 31.6 megajoules if you left it plugged in for a year. Another way of thinking about this would be to call it a bit under 9 kilowatt-hrs.
So when you talk about air containing about 1022 "joules/watts of energy", I really don't understand what you're trying to convey. (And I'm afraid it sounds like you are a bit wooly about this as well.)
However, let's assume you're trying to talk about the energy content of the atmosphere. Even then, that's a pretty meaningless concept, but let's try to go through the necessary steps. To start with, the mass of the atmosphere is about 5.3 x 10¹⁸ kg, and then we've got to think about the concept of Specific Heat. This is basically a constant* of proportionality linking the energy supplied to a "system", the mass of the "system" and the resulting temperature change of the "system". (*Of course, this is another one of those constants that isn't constant, as it is temperature dependent!)
If you are talking about the energy in some "system", it really makes more sense to talk about the delta from some specified state. For example, the famous Levitus paper on Oceanic Heat Content rise talks about the change in heat content from a given start date.
At the kind of temperatures humans experience (and stay alive) the Specific Heat of air is around 1010 joules/kilogram-Kelvin (J kg-1 K-1). That means it takes about 1010 joules to raise the temperature of 1 kg of air by 1 Kelvin.
Scaling up (and ignoring variations in Specific Heat and not even considering Latent Heat) it therefore takes about 5.3 x 10²¹ joules to bring about a one degree K change in temperature. The total energy content of the atmosphere (ignoring Mass-Energy of course) would therefore be the energy required to raise its temperature from Absolute Zero to its present state. We're now talking somewhere in the vague region of 1024 joules, or a yotta-joule.
Similarly, the opening sentence in your third paragraph seems to have gotten away from you somehow. Yep, the insolation at TOA is about 1.74 x 10¹⁷ watts. After allowing for albedo effects, this comes down to about 1.2 x 10¹⁷ watts actually entering the climate system. This does indeed dwarf our current primary power conversion of about 1.8 x 10¹³ watts.
However, to categorize tapping into this resource in any seriously significant scale as being "very easy" is, in the short term at least, to engage in some seriously wishful thinking.
I'm obviously not grasping what you're trying to say - and I suspect I'm not alone - so please try again to gather your thoughts and have another go.
cheers bill f
-
L. Hamilton at 03:36 AM on 6 March 2015Does providing information on geoengineering reduce climate polarization?
It's a well-known pitfall (or technique) in questionnaire design that details of question wording and context can influence responses. If you're trying just to measure something then carefully neutral wording is best, and even then you might see a difference between "global warming" and "climate change" versions of the same question. On the other hand if you're actively trying to influence the responses (or test ways to do this) then wording or introductions that clue respondents about the "right" answers often have an effect. That's done in everything from psychology and survey experiments to advertisement testing or political push-polling ("Would you still plan to vote for candidate X if you knew that he ....").
Experiments in questionnaire design and framing can give clear evidence about the effects of such manipulations, but leave open the question of how that generalizes to real life. In testing an advertising or political campaign it might be straightforward, for communicating science in our hyper-polarized context, perhaps not so much. Neutrally-worded, minimally manipulative surveys provide a key reality check on what's happening to public opinion in real life.
-
Peter Metaskeptic at 03:31 AM on 6 March 2015New Series: Science Communicators – Why We Love Communicating Science
I do understand the classical approach taken by you guys, but I'm no more agree with it. I wanted to write an answer, but the text is too long and has become an article with a larger scope.
http://www.metaskeptic.net/metaskeptic-the-science-communicator-excuse.html
Moderator Response:[JH] Link enabled. Please note that we frown on commenters posting "ads" for their own websites.
-
PluviAL at 03:26 AM on 6 March 2015Does providing information on geoengineering reduce climate polarization?
The profusion of issues all show something else we all know, climate change is a complex, emotional, technological, and political issue. We focus on the technological/scientific issue, but the other aspects are just as important. This article’s attempt to bridge the emotional and political divide is important, though perhaps not well executed. We need more of this discussion. It’s an emotional argument before it is a political one, thus we must hear the opposition’s fears and concerns. Of course the US is more polarized than the British; we are more reliant on fossil fuels for our absurd city sprawl, and we have all the fuels we will ever need to ruin the climate in AC comfort.
I’ll not use the P word for which I was very kindly rebuffed, before, but let me insert the concept using a different term: Benign Atmospheric Engineering BAE. The atmosphere/ocean preesent the syptoms of the problem, air contains about 10 to the 22nd joules/watts of energy and growing. It is the interface between the ocean system, the land system, and space. It is the engine which creates wind by processing energy out into space.
What if we could insert our energy needs into this process of 26% from 175,000 TW per second, insolation? It is adjustable; either up or down. Which is what the discussion is all about. And it will amply supply civilization's current <20 TW needs, and future 200 TW needs... for space colonization. By invoking this energy, process, as source, we will affect the climate and change the characteristics of the atmosphere and land on the planet, but in a largely beneficial way, thus BAE. And it is very easy, farming is a minor BAE, so is hydroelectric, but this are very small and indirect processes. When we consider Geoengineering, we will open our minds to large scale and direct BAE, which is to the good.
-
wili at 03:05 AM on 6 March 2015The oceans may be lulling us into a false sense of climate security
Thanks for covering this important story. Abraham (from St. Thomas in St. Paul) interviewing Steinman (from UMN Duluth) just drives home how many of us Minnesotans are important players in GW issues!
Meanwhile, breaking news:
NOAA officially calls it: We are in El Niño conditions.www.cpc.ncep.noaa.gov/products/analysis_monitoring/enso_advisory/ensodisc.html
Moderator Response:[Rob P] - A sizeable Kelvin wave is heading east across the Pacific Ocean. Combined with observed slowdown of the South Pacific subtropical gyre, there is the potential for a strong El Nino developing this year too. I suspect that the sustained trade winds in the southern hemisphere last year prevented proper ocean-atmosphere coupling. 2015 is shaping up as another interesting year weather wise.

-
Flakmeister at 01:36 AM on 6 March 2015With climate change, US presidents matter
What Warren Buffet says in public does not change the fact that the fastest growing component of BNSF business is hauling oil by rail. Admittedly, the volume is still dwarfed by the amount of coal hauled. And as a political play, what does Warren really risk by disagreeing with the President on an already vetoed bill?
No matter how you slice and dice it, the tax treatment of the refined KXL oil is nothing more than massive corporate welfare to the tune of billions a year with the Kochs benefitting disproportionately.
-
dana1981 at 01:23 AM on 6 March 2015Climatology versus Pseudoscience book tests whose predictions have been right
Yeah, a sensitivity estimate is not the same as a temperature projection.
-
billthefrog at 01:09 AM on 6 March 2015Does providing information on geoengineering reduce climate polarization?
@ wili #10
Another item to keep in reserve for "future interactions with similarly recalcitrant loved ones" would be the Quadrennial Defense Review from the US Department of Defense. (There are 8 references to "climate change" therein - I counted.)
Even more in your face is the US Navy's Arctic Roadmap, which was produced by the Navy's Task Force: Climate Change.
Sounds like the Pentagon is part of that sneaky red/green commie/environmentalist plan to install a one-world government under the aegis of the United Nations.
cheers bill f
-
wili at 16:30 PM on 5 March 2015Does providing information on geoengineering reduce climate polarization?
Thanks for the kind and thoughtful suggestions, Tom and Glenn. There may be too much water under that bridge for further discussion with that particular relative. But I'll keep your hints in mind for future interactions with similarly recalcitrant loved ones.
-
Glenn Tamblyn at 13:41 PM on 5 March 2015Does providing information on geoengineering reduce climate polarization?
wili
Maybe the key to getting him to think about it is to give him one or two key facts that support AGW and can only be rejected by rejecting opinions from conservative sources. Since he is a WSJ reader I assume he is Republican.
Ask him why the US Defense Dept accepts AGW as the most serious future threat they will have to face and how they came to that conclusion - answer, they were involved in the core research into the properties of atmospheric gases, going all the way back to the 50's when they started designing heat seeking missiles.
-
Tom Curtis at 11:13 AM on 5 March 2015Does providing information on geoengineering reduce climate polarization?
wili @7, perhaps you should ask him why he is accepting his climate science from the same people who deny the link between second hand smoke and health, reject the link between the HIV virus and AIDS, and who reject vaccination for measels etc?
-
wili at 10:12 AM on 5 March 2015Does providing information on geoengineering reduce climate polarization?
Many good points, sho. But at least while she was in office, Thatcher was lightyears ahead of Reagan on environmental issues: "Thatcher supported an active climate protection policy and was instrumental in the creation of the Environmental Protection Act 1990 and in founding the Intergovernmental Panel on Climate Change and the British Hadley Centre for Climate Prediction and Research in Exeter.Thatcher helped to put climate change, acid rain and general pollution in the British mainstream in the early 1980s"
But the essential point is true--when the right in both countries (and in both parties in the US) handed over sovereign power to corporations, they insured that we would be living with much of the insanity we now face.
The relative of mine who has the deepest science background--major medical researcher, dean of a major medical shool for many years...--flatly rejects the science of global warming, mostly based on the WSJ editorials he religiously. I'm not sure what exactly would alter his clearly ideologically based belief system. He certainly won't ever see little old me as enough of a scientific literate to question his dismissive statements.
-
KR at 09:46 AM on 5 March 2015It's the sun
Dan Pangburn - When total forcing changes, so does the climate in response. That changes the break-even point, and the imbalance goes away.
Now if the total forcing continues to change, as we see with our GHG emissions, the climate will follow along (albeit with a lag due to thermal inertia and slower feedbacks, primarily ocean heat content on the decadal level), but if the forcing ceases to change any imbalance will decay accordingly. There is no 'fixed offset' from a TSI change in the presence of a dynamic climate response.
Short answer - a step change in forcing will cause a climate change, after which there won't be an imbalance to integrate.
-
chriskoz at 09:34 AM on 5 March 2015New Series: Science Communicators – Why We Love Communicating Science
swampfoxh@5
I learned about climate change through personal experiences ferrying (flying) new aircraft to their new owners across the world.
Can you be more specific?
-
Andy Skuce at 09:11 AM on 5 March 2015Does providing information on geoengineering reduce climate polarization?
Adam C @3: I agree that the study did show that presenting subjects with a fictitious solutions scenario that did not offend their sensibilities produced a small effect in reducing polarization. My problem was not that the solution presented was fictitious, but that the framing of the solution bore no resemblance to reality.
Had the results been presented as "here's what happens to acceptance/rejection of the science when subjects are presented with a bogus, pain-free silver-bullet solution", then I wouldn't have objected.
Perhaps more emphasis on frank discussions about realistic solutions could provide a way of closing the gap between those who accept and those who reject climate science. I would like to know.
-
gws at 08:58 AM on 5 March 2015Does providing information on geoengineering reduce climate polarization?
@Adam, #3
I agree, but then the result becomes trivial because anyone could have predicted that outcome, right? So why do the study in the first place ...
I have seen Kahan speak on the results of this experiment before, but I had not seen what the subjects were actually presented. To me, it is obviously meaningless to present false information which caters to what a person wants to hear, then essentially finding what would be expected, namely the avoidance of one pathway over another. We know that, we do not need a study for that. What we actually want to know if whether presenting realistic geoengineering options as one of the wedges of mitigation and adaptation has an effect on the perception of climate science. That is what Kahan appears to claim, but now I see how he overinterpreted his research ...
-
Tom Curtis at 08:51 AM on 5 March 20152014 SkS Weekly News Roundup #33B
John Baez has an interesting update on the Yamal craters. Perhaps the most important new information is that some of the many circular craters on the Yamal peninsula are recent. That has been determined by comparing satellite photos of the region. Baez quotes extensively from an article, which says:
"Professor Bogoyavlensky told The Siberian Times: ‘One of the most interesting objects here is the crater that we mark as B2, located 10 kilometres to the south of Bovanenkovo. On the satellite image you can see that it is one big lake surrounded by more than 20 small craters filled with water.
"Studying the satellite images we found out that initially there were no craters nor a lake. Some craters appeared, then more. Then, I suppose that the craters filled with water and turned to several lakes, then merged into one large lake, 50 by 100 metres in diameter.
‘This big lake is surrounded by the network of more than 20 ‘baby’ craters now filled with water and I suppose that new ones could appear last summer or even now. We now counting them and making a catalogue. Some of them are very small, no more than 2 metres in diameter.’"
This proves the formation of the craters has been an ongoing event over the last decade. It follows that the current rate of increase in atmospheric methane already includes a contribution from the formation of yamal type craters. The rate of formation could possibly accelerate with continued warming, but such an acceleration will result in an increase in the rate of methane increase rather than a sudden rapid rise (Shakhova event).
Also of interest are anecdotal accounts of residents in the area seeing a flash at the time, and in the direction of the formation of one of the recent craters. Such a flash would indicate the formation was literally explosive, with a significant proportion of the methane oxidizing when the crater was formed. If true, that would indicate a far lower rate of methane release from these events than that estimated by David Archer at Real Climate.
Finally, Baez links to an article by Chris Mooney assessing the risk of a methane lead disaster from such methane releases.
-
shoyemore at 08:33 AM on 5 March 2015Does providing information on geoengineering reduce climate polarization?
Why is England so polarised where in the Celtic Fringe (including the Republic of Ireland, where I live) climate denial hardly gets a look in? Even Scotland, with heavy dependence on North Sea oil revenues, is also a big developer of wind energy.
It correlates IMHO with Conservative politics - Margaret Thatcher, for example, was widely disliked outside of England, the Conservative party is basically an English party, and under her leadership Scottisn Nationalism got an enormous boost. I think Thatcher (and Reagan) did some necessary things, but they also gave big business unwarranted permission to interfere in the political process, something which seems to have also happened in Australia.
Not that we problem-free here as regards climate change, but we have no Lord Lawsons, Tony Abbotts or James Inhofes. Or is we do, they work very quietly.
-
Dan Pangburn at 06:53 AM on 5 March 2015It's the sun
If TSI is a forcing, shouldn't the comparison on the graph be between the temperature change and the time-integral of the TSI which exceeds break-even?
-
Adam C at 06:47 AM on 5 March 2015Does providing information on geoengineering reduce climate polarization?
I think the study is relevent nonetheless. It's long been suspected that many "skeptics" aren't truly skeptical of the science, but rather they find the proferred solutions (taxes, regulations, international cooperation) to be politically unpalatable. They hate the cure, so they deny the disease.
This study seems to bear that out. Offered a potential solution that doesn't offend their sensibilities, the subjects become much more willing to consider the problem. I think the authors were forced to invent a fictitious geoengineering solution in order to properly explore this question. -
funglestrumpet at 06:43 AM on 5 March 2015New Series: Science Communicators – Why We Love Communicating Science
One name that seems to be missing from the above suggestions is Viscount Christophere Monckton of Brenchley. It would be really interesting to know why he does what he does. I don't think for one minute that he actually believes what he says, and anyway, as Potholer 54 has so clearly shown on YouTube, he contradicts himself a lot of the time. Perhaps there's money involved somewhere along the line, but would a peer, even an hereditary one who has done nothing to earn their title, deliberately harm his country for a few pieces of silver? Surely not, it might cost him his title.
(Carefully removes tongue from cheek!)
Prev 642 643 644 645 646 647 648 649 650 651 652 653 654 655 656 657 Next


