


 Arguments


Recent Comments
Prev 642 643 644 645 646 647 648 649 650 651 652 653 654 655 656 657 Next
Comments 32451 to 32500:
-
jimlj at 10:37 AM on 1 December 20142014 SkS Weekly Digest #48
The cartoon is actually an insult to the flat earth society, which does accept AGW. flat earth society accepts global warming
-
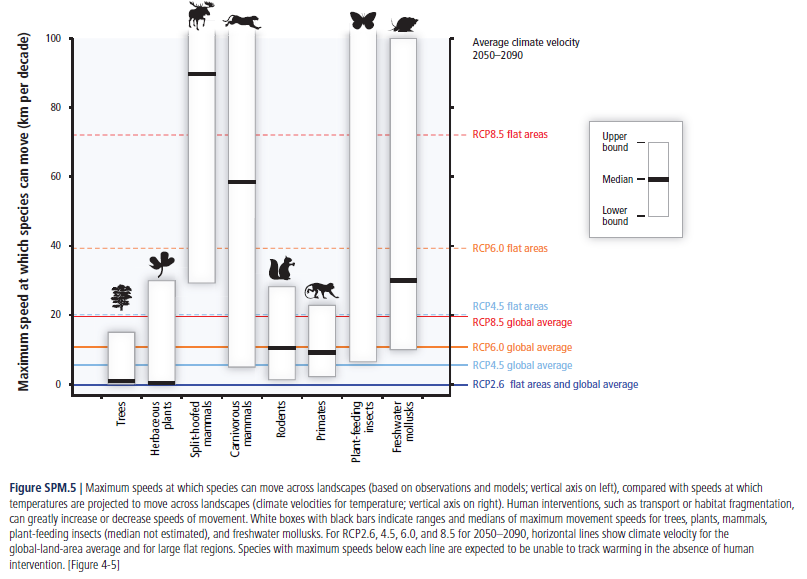
Glenn Tamblyn at 08:42 AM on 1 December 2014Animals and plants can adapt
tkman0
The latest IPCC report has this graph about species movement rates vs warming rates
-
tkman0 at 05:18 AM on 1 December 2014Animals and plants can adapt
Thanks for the replies everyone, also just wanted to point out that some of the links on here dont link to articles, but insteasd link simply to a general climate change page at the univeristy of texas.
-
One Planet Only Forever at 04:37 AM on 1 December 2014Mercury Rising: 2014 Likely to Surpass 2010 as Warmest Year on Record
Yvan Dutil,
The SkS Temperature Trend Calculator page does not have the 2014 data being added monthly. The Calculator was created in 2012 and has the 2013 data in it, so it appears that it is planned to be updated after the full 2014 sets of data are available.
-
One Planet Only Forever at 04:35 AM on 1 December 2014The Skeptical Science temperature trend calculator
Kevin C,
Is there any way to change the scale values on the x-axis to be more representative of the 12 months of data points in a year, like 13.25, 13.50, 13.75?
-
One Planet Only Forever at 04:33 AM on 1 December 2014The Skeptical Science temperature trend calculator
Kevin C,
Perhaps a note could be added up front mentioning when the Calculator data will be updated. It appear that the plan is to update the Calculator when the full sets of data are available for a calendar year. A question was recently asked on the "Mercury Rising:2014 ..." OP.
-
Yvan Dutil at 03:07 AM on 1 December 2014Mercury Rising: 2014 Likely to Surpass 2010 as Warmest Year on Record
Speaking of temperature. Is the SS trend applet has been updated recentely?
-
One Planet Only Forever at 02:48 AM on 1 December 2014Mercury Rising: 2014 Likely to Surpass 2010 as Warmest Year on Record
A related point is the extent of Arctic and Anatarctic sea ice.
The NSIDC sea ice extent tracking here shows that, although the Antarctic maximum sea ice in 2014 was a record level of extent significantly larger than any previous year on September 22, it dropped rapidly. By early October the 2014 Antarctic extents had dropped to match the 2013 extents after being 0.5 million square km larger than the previous recoird year 2013. And since the end of October the 2014 extents have been consistently lower than 2013, into the range of standard deviation for Antarctic sea ice extent.
-
One Planet Only Forever at 02:36 AM on 1 December 2014Mercury Rising: 2014 Likely to Surpass 2010 as Warmest Year on Record
MA Rodger,
Thank you. I was aware of the way to see the full listing of the monthly anomalies on the NOAA site, however, what Jose_X and I were trying to show was the value of the average of 12-months ending on each month.
The NOAA site allows the average of a wide variety of time periods, from the standard 1-month up to 60-months, to be obtained for any chosen end-month for the set of chosen years, but only for the same end-month in each year.
The NOAA site appears to be set up to allow quick comparisons of a 'calendar month' to the same month in previous years. That quickly allows the evaluation and reporting of how warm a month is compared to the same month in previous years. That is probably more accurate than just comparing all of the months since each month of the calendar year may have a different normal global average value. However, the average of any multiple of 12-months makes the uniqueness of a month no longer relevant since each average contains all months and the same number of each month.
The NOAA site is not set up to quickly evaluate the averages of multiples of 12-months. You have to review the results for each of the 12 month choices. My earlier point was about the lack of need to discuss how warm a 'year is so far'. A more relevant evaluation is 'how warm the past 12-month period has been, which is still a year, just not the more recognized calendar year'.
A similar approach would apply to 'decade averages'. A new decade average can be created from each new month added to the data set. There is no need to wait for the end of a decade to evaluate how decade averages are changing.
Of course, with the rather random significant variations about the norm that occur in the global average surface temperature the better average to track to minimized the aberrant fluctuations would be 30-years or longer.
The NOAA monthly anomalies can be copied to a spreadsheet to evaluate these longer averages. However, it would be helpful if the NOAA site was set up to allow these types of evaluations to be presented.
-
MA Rodger at 20:19 PM on 30 November 2014Mercury Rising: 2014 Likely to Surpass 2010 as Warmest Year on Record
One Planet Only Forever @10.
The NOAA temperature Time Series page you discuss is a bit odd in not provide the obvious option of graphing the full set of monthly anomalies. However, the data displayed below the graph with the option "Previous 12 Months" are the monthly anomalies for the full record.
-
wili at 19:19 PM on 30 November 2014Skeptics were kept out of the IPCC?
You don't have a question mark on the question (first title, at the very top of the page), and you do put one on the statement (second title, in the pink box).
-
Rob Honeycutt at 06:16 AM on 30 November 2014The Chinese scientific revolution aims to tackle climate change
@6... Cantonese is "gonjeng mui." :-)
-
factotum at 04:04 AM on 30 November 2014The Chinese scientific revolution aims to tackle climate change
Good thing that we are no longer part of England. Though it would have been nice if someone had identified the the author as English and not american.
After doctors, the rest of the top ten occupations seen as prestigious include military officers (78%), firefighters (76%), scientists (76%), nurses (70%), engineers (69%), police officers (66%), priests/ministers/clergy (62%), architects (62%), and athletes (60%). LINK
As to the wonderfulness of china. It is the most poluted country on the planet.
http://fortune.com/2014/06/05/china-rich-immigration/
There is a reason that those who can are leaving and taking their money with them to the tune of about a biillion dollars every three years. http://money.cnn.com/2014/03/25/news/economy/china-us-immigrant-visa/
Moderator Response:[RH] Shortened link. Please use the link tool on the second tab of the comments box to shorten excessively long url's.
-
r.pauli at 03:04 AM on 30 November 2014The Chinese scientific revolution aims to tackle climate change
Oh Goody! How does one say "Clean Coal" in Chinese?
-
From Peru at 02:09 AM on 30 November 2014The Chinese scientific revolution aims to tackle climate change
Maybe China official commitments of a peak in coal in 2020 are a bit too conservative (from Reneweconomy.au)
-
From Peru at 02:04 AM on 30 November 2014The Chinese scientific revolution aims to tackle climate change
Wili, maybe after suffocating in the worst pollution clouds seen in the world, having to cure millions of people with respiratory illnesses and facing possible civil uprisings against pollution they are finally realizing that burning coal is a race to disaster.
-
wili at 00:43 AM on 30 November 2014The Chinese scientific revolution aims to tackle climate change
"That country has a forward looking view of the future. Not only in clean energy and climate..."
I'm not exactly sure how you can say that about a country that burns about half of all coal burned in the world.
-
One Planet Only Forever at 15:38 PM on 29 November 2014The Chinese scientific revolution aims to tackle climate change
I hope the current support of basic science continues in China. However, the power of pursuers of profit and the temporary popularity for unsustainable harmful action they can create could easily overcome the apparent support for basic scieence in China. Hopefully, the powerful people infuencing China are becoming genuinely interested in the development of a sustainable better future for all life on this amazing planet. Hopefully, they will resist the temptation to return to pursuing a better present for themselves any way they can get away with.
-
One Planet Only Forever at 13:27 PM on 29 November 2014Mercury Rising: 2014 Likely to Surpass 2010 as Warmest Year on Record
Jose_X,
Unfortunately the NOAA site presents data for the same month each year.What you see with the timescale at '12-month' and the month as 'October' is the average of 12 months ending in October for each year. There is no option that shows the month-by-month values of the time series. You have to review the data for each month to find out what all of the 12-month averages were.
Here are the month-ends with 12-Month values that are closer to the 12-month ending in October 2014 value of 0.68 C:
- 0.66 C - Jul 1998, Sep 1998, Apr 2007, May 2007, May 2010, Jun 2010, Nov 2010, Jul 2014
- 0.67 C - Aug 1998, Jul 2010, Aug 2010, Aug 2014, Sep 2014
Note that the 12-months ending in October 2014 is still the warmest so far in the NOAA data set, and that August and September 2014 are 40% of the small group of 12-month periods that are just 0.01 degree cooler.
Also note that in the NOAA data set no year before the 1997/98 ENSO El Nino event had a 12-month average in the 0.66 C and above range. In fact the warmest 12-month periods before 1997 were 0.45 C for the 12-months ending in August, September, October, November and December 1995. And 1995 was another weak ENSO event like 2010, yet its temperatures were warmer than the stronger ENSO events before it.
-
Tom Curtis at 11:49 AM on 29 November 2014Why we need to talk about the scientific consensus on climate change
Ashton @67:
With regard to sample size, first it is apparent that you are not aware of the standard practise in social sciences in which small sample sizes are the norm. They are the norm because, given a fair sample, that is all that is needed to give determinative results. checkmarket.com discusses the issue, and displays the following table:
Using their calculator, we can see that with a population of 300 million, the required sample size for a 5% margin of error with a 95% confidence interval rises from the 384 required for a population of one million, to 385. Alternatively, using the second section of the same calculator we can determine that for a population of 300 million, with a sample size of 200, you have a 6.93% margin of error for a 95% confidence interval and a 9.11% margin of error for a 99% confidence interval. (Note: That means that 95% of repeat surveys with the same sample size would fall within 6.93% of the values given in the survey conducted, assuming representative samples.)
These are approximate values. The formulas for more exact values can be found here.
Applied to the graph above, the error margin on the margin in the y-axis between any two values is 9.8%, less than a third of the difference between those most strongly supporting and those most antipathetic towards free market ideologies. Therefore, even with so small a sample size, the results hold. It is unclear, due to the small sample size, whether or not the "cultural bias" is closer to 28 or 48%, though it is most likely near to 38%.
I have not commented on this before because I have a passing familiarity with sociological research and am aware of the small sample sizes typically used. Frankly, in sociology (and social psychology) a greater concern is the frequent use of university students to form the sample, a group that cannot be considered representative on a number of criteria. John Cook to his credit paid for a professional survey of a representative population, with the result that his sample size was limited by budget, but his results were more reliable than if he had taken the cheap option of surveying 500 university students.
I am also aware that the graph is supposed to be indicative rather than definitive.
So, let's chalk this up as an example where your criticism introduced discussion of a significant point in the OP. Your discussion, however, merely waved a flag with not attempt to actually determine the significance of the point you were raising. Further, with more knowledge your flag is seen to not raise a significant point. These features are typical, in my experience, of the best offerings of scientific pseudo-skeptics such as yourself. At their worst, they are simply wrong, self contradictory and (in many cases) dishonest.
In contrast to the pseudo-skeptics, regular commentors here have a history of raising genuine issues. Not that we always pick them up, but when they are brought to our attention by questions or comments, we have an even better record of supporting the valid points.
-
michael sweet at 11:07 AM on 29 November 2014Why we need to talk about the scientific consensus on climate change
Ashton,
Your claim that only when you comment are topics closely examined is false. This post attracted a lot of attention because it was poorly supported. The general comments were that it could not be supported and the references were not properly peer reviewed. Renewable energy and nuclear also get a lot of discussion.
Perhaps you should consider if your comments are contributing to more general understanding or just the noise. You have attracted a lot of attention from the moderators, which generally indicates more noise. Reviewing your posts on this thread I see a lot of political commentary, mostly disparaging those you disagree with, and little science. Perhaps if you starting emphasizing science content you would have less trouble with the mods.
There used to be a lot of skeptical posters who supported their posts with data and they were well received. Now there is little to support the skeptical argument so skeptics leave when their arguments are shown to be unsupported.
-
Rob Honeycutt at 10:48 AM on 29 November 2014Why we need to talk about the scientific consensus on climate change
Ashton... Your comment @67 is just silly. What attracts commenters is when people, such as yourself, post comments that contradict the large body of research on climate issues. This is what SkS is all about. We communicate what the research says.
The sample size related to John's graph above is really not that critical an issue (as far as I can see). There is nothing being claimed that rises to the level suggesting the data may be in error. It clearly is a small sample, but if you think it's an interesting element of the research that might be wrong, by all means, we would all be interested to see a larger sampling that showed something different.
I think people here don't question the number much simply because it seems to reflect our general experiece dealing with various people who reject or accept AGW. The precision of the data likely wouldn't change overall perception of the data.
But again, if you think for some reason the small sample size is introducing misleading conclusions, then please, do more research! There's a good paper to be written if you come up with a different conclusion, and it's one that would be of keen interest to everyone at SkS and John Cook as well, I'm sure.
That's how science works. You don't like the methods or results. Do your own research and see what you come up with.
-
Jose_X at 05:42 AM on 29 November 2014Mercury Rising: 2014 Likely to Surpass 2010 as Warmest Year on Record
Adding further to #8:
NOAA allows you to see the 12 month average anomalies through any month easily at http://www.ncdc.noaa.gov/cag/time-series/global . Just change the "Timescale" at the top to "12-month" and it shows we are currently (October) at the highest 12 month ave with +.68 (vs .65 for 1998 and 2010).
And changing "Timescale" to "Previous 12 months" shows that, despite only covering through Oct, we have had .70+ seven times in 2014! In no other year has the .70 mark been reached more than four times.
-
Ashton at 05:03 AM on 29 November 2014Why we need to talk about the scientific consensus on climate change
John Hartz As these posts will be read only by you, if in fact they are not deleted instantly without being read here's a couple of thoughts. However much you may not believe or even like it, I do have a PhD (from UWA) based on laboratory experimentation using biochemical, immunological and molecular biology techniques, have published in my field and was a academic for over 30 years, reaching professorial status. Have you noticed that when topics attract posters such as myself, the comments section is often much enlarged? This seems to be as comments that disturb the equanimity of the usual posters causes them to jump to the defence of their beliefs. Let's look at Mr Cook's graph of the political persuasions of 200 US citizens. Not one comment that 200 is a very small sample size or that as error bars weren't included so the statistical validity of the conclusions is not assessable. Just a small point that no doubt contravenes some aspect of comments policy, but your usual cohort of commenters don't critically assess the topics but just say' "Well done, that clarifies that" or "This should crush sceptical opinions" with no attempt to critically appraise the results. When commenters such as I comment then the paper is often discussed in detail as your usual commenters are shaken out of their lethargic acquiescence to show this impudent intruder that their science is impeccable. I do hope you don't exclude those who are less convinced, at the moment, that the current climate change is due solely to human influence as the resulting discussions sharpen the wits of all concerned and lead to a much more forensic analysis of the topic in question than otherwise would be the case.
Moderator Response:[JH] The antagonistic and condescending tone of your comments is a major reason why they are being scrutinized closely by moderators. Posting comments on this website is a privilege, not a right. If you cannot engage in civil discourse and abide by the SkS Comments Policy, you will forfeit this privilege.The choice is yours to make.
-
Ashton at 04:23 AM on 29 November 2014Why we need to talk about the scientific consensus on climate change
Thank you for your reply. I note you state "The deletion of moderation complaints has been a long-standing practice of SkS Moderators. I presume because such complaints are considered to be "off-topic."
So even if something is not stated in the comments policy as being grounds for deletion, your presumption that it is off topic is sufficient for deletion. I also presume this post will be deleted but deletion based upon personal interpretation by moderators does add a further layer of complexity to the wording of comments. Whatever, thanks for the apology and your for admission that moderation complaints are not explicitly merntioned in the comments policy
Moderator Response:[JH] All decisions made by humans are subjective to some degree or another.
Typically, we employ a three-tiered moderation process. What follows is the standard text of Warning #2. You have been served so to speak.
Please note that posting comments here at SkS is a privilege, not a right. This privilege can and will be rescinded if the posting individual continues to treat adherence to the Comments Policy as optional, rather than the mandatory condition of participating in this online forum.
Moderating this site is a tiresome chore, particularly when commentators repeatedly submit offensive or off-topic posts. We really appreciate people's cooperation in abiding by the Comments Policy, which is largely responsible for the quality of this site.
Finally, please understand that moderation policies are not open for discussion. If you find yourself incapable of abiding by these common set of rules that everyone else observes, then a change of venues is in the offing.Please take the time to review the policy and ensure future comments are in full compliance with it. Thanks for your understanding and compliance in this matter.
-
One Planet Only Forever at 04:14 AM on 29 November 2014Mercury Rising: 2014 Likely to Surpass 2010 as Warmest Year on Record
There is no need to 'wait two more months'. Any 12 month period is a 'year'.
In the NASA GISTemp data set here the average of the 12 months ending in November is 0.05 C warmer than the warmest set of 12 months that occured during the very strong 1997/98 El Nino event, the 12 months ending in Aug and Sept of 1998.
And reviewing the NOAA ONI data set here those peak 12 month average temperatures in 1998 occured 5 months after the ONI had dropped below El Nino levels. Also, the monthly average in the GISTemp data increases dramatically in Sep 1997 even though the ONI is clearly El Nino by April-May-June 1997.
Reviewing the Government of Australia SOI data here those peak 12 month average temperatures in 1998 occured 4 months after the SOI had rise above El Nino supporting levels of -8.0. Also, the monthly average in the GISTemp data increases dramatically in Sep 1997 even though the SOI is clearly El Nino supporting (below -8.0), by March 1997.
It is also easy to see that the 2010 global average temperatures were bumped by an ENSO event (combination of SOI and ONI) that was quite weak compared to the 1997/98 event but still produced global averages higher than the 1997/98 event. And the 12 months ending in October 2014 are only 0.02 below the highest 12 month average in 2010.
This has been presented in many ways by many people. Nothing needs to be 'waited for' to 'show people who are genuinely interested in better understanding waht is going on' that global average temperatures continue to rise with the most prevelant cause being the added atmospheric CO2 from human actvity, with the most significant contribution being from the burning of buried non-renewable hydrocarbons.
The real challenge is figuring out how to get leaders to choose to act responsibly and considerately rather than hoping to promote popularity for inconsiderate irresponsible profitable and pleasurable activity.
-
gws at 04:00 AM on 29 November 2014The Chinese scientific revolution aims to tackle climate change
Excellent article John. I would add that, while budgets may not be increasing in Europe either, scientists there do still receive a lot of respect and attention, and science and scientists are regularly in the news. In addition, I do not think that the situation you describe for scientists working on topics that are "anathema" to many people is transferable to the sciences in general.
However, we could use some more solidarity in the sense that physical scientists ought to be supportive of other sciences they may consider less rigorous, such as biology. And vice versa: more scientists from all fields ought to support their colleagues in climate and evolution sciences, who regularly get attacked, because silence only reinforces the notion that you described as "Understanding basic science is a threat to many people in my country" in the general population.
-
Ashton at 03:20 AM on 29 November 2014Why we need to talk about the scientific consensus on climate change
Thanks John Hart and Michael Sweet your efforts are much appreciated. John Hartz, thank you for your apology. As the reason for deleting my post at 61 was incorrrect, will that post now be moved from the deleted comments section and reposted?
Moderator Response:[JH] No, I will not repost your comment because it constituted a moderation complaint and hence was off-topic.
-
Andy Skuce at 02:01 AM on 29 November 2014The latest global warming bill and the Republican conundrum
British Columbia's experience with a revenue-neutral carbon tax is that the extra administration costs are very small. Most fuels are already measured and taxed at the point of sale and the rebates and dividends can be paid through the existing income tax administration.
One important feature of a carbon tax that is defined in its legislation as revenue-neutral is that repealing it will cause an income and corporate tax increase. This dis-incentivizes conservatives from scrapping it. Maybe Tony Abbott would have thought twice about getting rid of Australia's carbon tax, if that had triggered an immediate income tax increase.
-
michael sweet at 01:07 AM on 29 November 2014Why we need to talk about the scientific consensus on climate change
Here is Ashton's original post, accidently deleted:
"John Hartz I checked the comments policy but couldn't find anything that made mention of a Moderation Complaint. Would you mind posting that item from the comments policy? It would be much appreciated. My apologies for this request if the item is in fact quite obvious."
I copied it from the deleted comments screen. also po also
Moderator Response:[JH] Thank you.
I would also point out that Michael Sweet has access to the delected comments section because he is a member of the all-volunteer SkS authors team.
-
shoyemore at 00:20 AM on 29 November 2014Mercury Rising: 2014 Likely to Surpass 2010 as Warmest Year on Record
Make a note to update the "Escalator" graph as soon as you can in 2015.
-
Rob Painting at 17:27 PM on 28 November 2014Mercury Rising: 2014 Likely to Surpass 2010 as Warmest Year on Record
Chriskoz, as Reason 4 has correctly surmised, it generally boils down to whether the record occurs in the 1st calender year of an El Nino event or the 2nd. Although El Nino hasn't yet formed, this year has been close to the threshold for a while.
As for the polar vortex/jetstream, that's an area of still fierce scientific debate. That the jetsream has undergone a long-term strengthening, and climate models simulate this under greenhouse gas-driven warming, puts the issue into perspective - a discussion for another day unless you want to find an appropriate thread to continue this.
-
Ashton at 16:25 PM on 28 November 2014Why we need to talk about the scientific consensus on climate change
John Hartz
Thank you for your courtesy.
Sorry but I didn't keep a copy but in essence said I couldn't find in Comments Policy any reference to the Moderation Complaint you referred to in post #61, asked if you would advise what the policy said and apologised if I should have been able to find it.
Moderator Response:[JH] Much to my chagrin, you are correct. The Comments Policy does not explicitly prohibit the posting of moderation complaints. I therefore apologize for incorrectly stating that it did so.
The deletion of moderation complaints has been a long-standing practice of SkS Moderators. I presume because such complaints are considered to be "off-topic."
Our exchange has triggered an internal review of this ball-of-wax by the members of the all-volunteer SkS author team.
-
Reason_4 at 15:17 PM on 28 November 2014Mercury Rising: 2014 Likely to Surpass 2010 as Warmest Year on Record
Christoz, I am not a scientist (first post here) but I think what you are seeing is previous record years started the year as El Nino events and the El Nino conditions then tailed off over the later part of the year. It does make a contrast with this year that is still technically neutral ENSO, but with a lot of heat building in SSTs in the Pacific ... which may mean 2015 will be hotter still ...
-
Thomas Huld at 14:38 PM on 28 November 2014Mercury Rising: 2014 Likely to Surpass 2010 as Warmest Year on Record
Chriskoz @#3: The graph is of temperatures "year to date", so the January value is the average of January only, the February value is January+February and so on. As you average more and more months, the variation becomes smaller.
-
chriskoz at 12:43 PM on 28 November 2014Mercury Rising: 2014 Likely to Surpass 2010 as Warmest Year on Record
Looking at Figure 2, I want to understand why most record warm years have the slope of their "race" declining towards end of year. Would it be because last few months mean NH is in winter season, with more continents, where the temp extremes tend to go low, e.g. recent cold spell in NY - result of melting arctic ice and jet stream perturbations?
-
wili at 11:15 AM on 28 November 20142014 SkS Weekly News Roundup #48A
An update on the Brazil situation:
Parched Sao Paulo drenched by flooding rain
"Parts of Brazil have been gripped by intense drought described as the worst in eighty years and despite the flooding, rain reservoir levels remain critical"
-
Lomax at 08:50 AM on 28 November 20142nd law of thermodynamics contradicts greenhouse theory
First of all, many thanks for all your hard work! I occassionally get involved in the debate on AGW theory and your site is a great resource for sorting out the arguments and debunking the junk science streaming out of the "denialist" camp - they are like an army of Duracell bunnies and any discussion tends to quickly turn into a crap-storm of half-truths, contradictions and downright lies. Without sites such as skepticalscience it would be impossible to keep up!
Now most of the arguments they tend to throw up are just regurgitations of old misunderstandings, willful or otherwise, and as such I'm usually able to answer back pretty quickly, but recently something's come up which has me scratching my head. I'm referring to the Donhoe et al. paper from the 10th of November this year; "Shortwave and longwave radiative contributions to global warming under increasing CO2". If I understand it correctly, Donohoe & co show that long-wave "trapping" by CO2 is not the main driver behind global warming, and that short-wave absorbtion by water vapour (and reduced albedo) is the real cause of long term warming. So far so in accordance with observation: the earth is getting warmer and it's caused by an increase in its ability to retain heat from the sun. Climate change 101. But what I find extremely confusing is the claim that warming from CO2 is only a temporary effect; their models show that in as little time as a decade the warming effect of CO2 is balanced out by an increase in long-wave radiation back to space, "cancelling out" the warming effect. I have to admit this is complete news to me; I was always under the impression that the CO2 content (and other greenhouse gases) of the atmosphere of any planet was directly linked to that planet's temperature, and that all other things being equal, the planet with the higher greenhouse gas concentrations would be the warmer one (e.g. Venus). Instead I see claims like this:
"When CO2 is first added, it does act as a blanket, trapping long-wave infrared energy coming off the Earth. The atmosphere then emits less of this long-wave radiation to space because the upper atmosphere is cooler than the Earth's surface, just as the top of your blanket is cooler than your body. But the Earth gradually heats up under this blanket, and hotter objects emit more long-wave radiation, so within about a decade the effect of adding the thicker blanket has been canceled by the warmer body emitting more energy." (source)
My admittedly limited understanding of thermal equilibrium tells me that yes, add quantity X of CO2 and you will get an increase in the ability to retain heat; the planet will warm up to temperature Y, at which point long-wave radiation back to space will balance out the heat-trapping ability, and temperature will stop rising. Add more CO2 (or other greenhouse gases) and the temperature will notch up further before again reaching equilibrium. Two objects at the same distance from a radiation source, one black, one white, the black object will be warmer as it absorbs more of the incoming radiation - and as a consequence it will also emit more long-wave radiation. Both objects are at thermal equilibrium, but one is warmer than the other due to it's ability to capture more of energy. But then I see this:
"Most of the study's simulations involved a one-time addition of carbon dioxide into the atmosphere. One scenario simulated continuously increasing CO2, as is happening now - in that case, the long-wave radiation effect lasted about 20 years before the shortwave effect took over."
What!? Unless my reading comprehension has suffered a sudden dramatical reduction (a distinct possibility!) it seems they are saying that even if you keep increasing the CO2 content, the effect will eventually (20 years?) be cancelled out and (apart from the warming from short-wave radiation) the planet in question would return to its earlier temperature. This just doesn't make any sense to me; if CO2 is able to "trap" long-wave radiation, surely if you keep increasing the CO2 level, the "trapping" ability will also continue to increase? I would greatly appreciate if someone could shed some light on this.
-
John Hartz at 08:41 AM on 28 November 2014Why we need to talk about the scientific consensus on climate change
Moderator's Comment:
Ashton: My apologies. I inadvertendly deleted your most recent comment. Please repost it and I will respond to it.
-
John Hartz at 07:13 AM on 28 November 2014Why we need to talk about the scientific consensus on climate change
Moderator's Comment:
Ashton: Your most recent post was deleted because it constituted a Moderation Complaint which is prohibited by the SkS Comments Policy.
-
Rob Painting at 06:36 AM on 28 November 2014Mercury Rising: 2014 Likely to Surpass 2010 as Warmest Year on Record
True Phillipe, but even with the use of the ol' eyecrometer one can see that the rate of surface temperature rise has slowed since 2000. The record-breaking monthly global sea surface temperatures (upcoming post) this year hint that we may be entering decades of accelerated surface warming (also upcoming post).
-
Tom Curtis at 06:32 AM on 28 November 2014Increasing CO2 has little to no effect
tkman0 @178, I have responded here.
-
Tom Curtis at 06:31 AM on 28 November 2014Animals and plants can adapt
"I understand that plants might not necessarily migrate north as temperatures increase and as their climatic boundaries change, but why is that the case? If you could point me towards a page or two that explains it, it would be appreciated."
Well, this page asserts it, but does not explain it. Discussion is at least on topic here. So:
Tree ranges do in fact migrate with temperatures. This has been well established from evidence of response to the warming at the end of the last glacial using data from pollen and other plant remains:


It is also evident in Europe, where there are a large number of species confined to one or a few mountains, the result of gradual migration up the mountain slope as the Earth warmed with the consequent genetic isolation allowing the evolution of new species.
Migration in response to AGW faces three major limitations.
First, migration may simply be not physically possible. The alpine species mentioned above, for example, have an obvious limit to their migration with increasing warming such that any whose lower altitude range is within 600 meters of the summit will go extinct with a regional temperature rise of 4 C. Indeed, they may go extinct with a smaller temperature rise in that as the population approaches the summit, a smaller and smaller population can be supported leaving them vulnerable to extinction by chance fluctuations on population due to disease, predation or unusual weather. Similar issues face species near northern coastlines (in the NH). A regional rise in temperature of 4 C will do for (at least locally) most species whose southern limit is within 600 km of a northern coastline:
In addition to these obvious bariers, east-west mountain ranges, or even large scale changes in underlying soil type can present natural bariers to migration, and hence potential exinction threats.
More importantly in the modern world is that human activity has created a very large number of additional bariers to migration (the second limitation). Put simply, seeds from trees that land in cornfields do not grow to maturity. Nor, come to that, do they typically grow to maturity in pasturage. The vast farmlands developed by humans across the NH represent a major barier to the migration of the range of trees.
Finally, and most importantly, the third barrier is the simple pace of temperature change. We are currently facing an increase of temperature of about 3 C over the coming century. That equates to a distance of about 450 km of change in latitudinal range to preserve current species health. Trees that propogate by dropping seeds can change there range at a few hundred meters per generation at most. (They can do so much faster if the seeds are dispersed by birds, and to a lesser extent winds.) Given the pace at which climate is changing, they well simply be left behind.
The effect will be complicated. Intuitively that means their northern range will not expand as rapidly as their southern range retreats - but that is not necessarilly true. For trees, like most life forms, the greatest competition comes from other species rather than from the environment itself. This is shown by the shere range of environments in which trees protected from competition by being in gardens can grow. It follows that the southern range will only retreat rapidly if some competitor species can advance quickly. So the actual likely result (IMO) is that long lived, slow growing species will be displaced by short lived quick growing species across the range.
-
scaddenp at 06:08 AM on 28 November 2014Increasing CO2 has little to no effect
tkman0 - I have responded in a more appropriate place.
-
scaddenp at 06:07 AM on 28 November 2014Animals and plants can adapt
Responding to tkman0 question asked here
It's helpful if you provide sources to where you got your understanding to better understand the question. However, if you read the article above it should help. Ease of adaption depends on the rate of change. It takes time for suitable soils to develop for instance and the change is not merely about temperature but also changes in precepitation etc. Climate change does not affect hours of sunlight either.
-
tkman0 at 05:26 AM on 28 November 2014Increasing CO2 has little to no effect
I'm curious about something, and I'm not sure if this is the right page to ask about it, but here goes anyway. I understand that plants might not necessarily migrate north as temperatures increase and as their climatic boundaries change, but why is that the case? If you could point me towards a page or two that explains it, it would be appreciated.
-
sauerj at 03:20 AM on 28 November 2014The latest global warming bill and the Republican conundrum
Thanks Michael. You are most undoubtedly right. I was only guessing conservatively to the extreme (which usually is best to win the greater argument), based on that the best charity organizations operate in the 5% admin range. But in this case, it makes sense that the % cut would much lower due to the sheer vast volume of money at hand. ... Sorry for the all caps, didn't realize about this rule and didn't mean to shout but only make my meaning clear ... won't do it again (hopefully I'll remember thru my final ~twenty years; expect this site to age honorably into the future hallows of tomorrow). ... Regards!
Moderator Response:[JH] Point of clarification: The "no all caps" rule does not apply to acronyms.
-
PhilippeChantreau at 02:32 AM on 28 November 2014Mercury Rising: 2014 Likely to Surpass 2010 as Warmest Year on Record
Looking at the NOAA figure, it's hard to understand where all the goofy talk about "the pause" is coming from. There is no pause, instead, it is unabated warming continuing despite a Nina dominated or neutral ENSO for many years and despite a sun quiter than it has been for 40 years. Must be those Leprechauns...
-
michael sweet at 22:29 PM on 27 November 2014The latest global warming bill and the Republican conundrum
Sauerj,
5% is not required for administration. Less than 0.1% is more the mark. The Social Security administration has low administraiton costs and for fee and dividend it would be lower since qualifying is easier.
-
sauerj at 14:15 PM on 27 November 2014The latest global warming bill and the Republican conundrum
This is very hopeful news! If something like this could really take off, my sour mood would turn a mighty shade brighter. ... But, Dana, when I read the bill, to me, it doesn't read singularly revenue-neutral as in ONLY providing dividends to individuals with the collected revenue (page 25, row 19 seems to be buried among other expenditures).
Personally, I am all for good & effective use of these funds (as it is written sounds good to me), but to get it thru this anti-science GOP caucus, it seems to me that 100% of expenditures have to be only toward individual dividends. Only then (except for a ~5% administration cut), anyone that called this a tax increase (i.e. meaning net positive dollars going into governmental coffers) would be speaking fraudulently. ... If so, then, the GOP could not even use its "no tax" platform for defense of its obstruction. Well, they could (& would), but they would be fraudulent.
Moderator Response:[JH] The use of "all caps" constituters shouting and is prohibited by the SkS Comments Policy.
Prev 642 643 644 645 646 647 648 649 650 651 652 653 654 655 656 657 Next


