


 Arguments


Can animals and plants adapt to global warming?
What the science says...
| Select a level... |
 Basic
Basic
|
 Intermediate
|
 Advanced
| ||||
|
Global warming will cause mass extinctions of species that cannot adapt on short time scales. |
|||||||
Climate Myth...
Animals and plants can adapt
[C]orals, trees, birds, mammals, and butterflies are adapting well to the routine reality of changing climate." (source: Hudson Institute)
At a glance
Just like “the climate has changed before”, this is another vague and unsubstantiated talking point. It is essentially meaningless because again it omits details – and details matter. Yes, some plants and animals can adapt – think of invasive plants like Japanese knotweed or annoying pests like rats. They seem to get on just fine under a wide range of conditions.
Other species, however, have evolved to fit into much narrower ecological zones. Think of Alpine plants: in a warming climate they may be able to extend their natural range uphill as the permanent snow-line retreats, but where can they go once they've reached the mountain-top?
On average, species that can migrate are moving some six kilometres polewards a decade, but such movements are not necessarily successful. For example, a butterfly may attempt to extend its range polewards, but if its food-plants do not grow in the territory it migrates to, then its caterpillars will have nothing to eat. Is that a recipe for success? Finally, whilst some species are capable of quickly migrating to places with more favourable physical conditions, others are not. A coral reef cannot simply pack up and move, can it?
We can clearly see how we've also made things more difficult for many species to adapt. One only has to consider the combination of a warming climate, gradually shifting Earth's climatic belts toward the poles and the amount of alterations we've already made to the planet's surface. Species run short of options. They can either interact with us to a far greater extent or they dwindle away until they are gone.
There's a term that covers all of the above issues. Maladaptation. It means an inability to adapt to any change for a variety of reasons, but none of them to the advantage of the species in question. Any species put at disadvantage is going to struggle to survive long-term. It's a term that will inevitably become more familiar in a scenario involving ongoing, unmitigated climate change.
Another unwanted consequence of such changes is the emergence of zoonotic pathogens. These are things like viruses that have evolved to jump from other animal species to humans, bringing an increasing risk of pandemics. These are details that the person saying or writing, "animals and plants can adapt", is omitting from the conversation. Details always matter.
Please use this form to provide feedback about this new "At a glance" section. Read a more technical version below or dig deeper via the tabs above!
Further details
The natural world has already been under attack for centuries. Since the discovery of agriculture, humans have massively transformed the globe through the expansion of civilization, to the detriment of Earth’s biodiversity. Great swathes of temperate forest in Europe, Asia and North America have been cleared for agriculture, timber, and urban development. Tropical forests in South America and Africa are now on the front line. Human-assisted invasions of pests, competitors, and predators are rising exponentially and overexploitation of fisheries and forest animals for meat have already driven many species to the point of collapse.
The ways plants and animals adapt to changes in their environment often involve migrating to areas with relatively favourable conditions (Bartley et al. 2019). But now, in order for many species to migrate large distances they would have to cross large areas of human influence. Mass migration in areas of large human population – entwined with crisscrossing, high-speed highways and polluted, dammed-up rivers – is self-evidently a challenging task.
Along with that, it has been shown that climate change has already had an impact on the environmental cues that animals use to determine the timing and navigation of their migratory patterns (Seebacher & Post 2015). Subsequently, these changes in animal migratory behaviour have also been shown to have a detrimental effect on the animal’s average lifespan and overall health.
There is much evidence that we are already on the brink of a mass extinction event. Because of human activity, the number of species on the planet is already decreasing. According to the Millennium Ecosystem Assessment (an international environmental report with the goal of assessing the impact of ecosystem change on human well-being), 60% of the world’s ecosystems are now degraded. The global rate of extinction is already at 100 to 1000 times that of the “normal” background rate on geological timescales. Mass-extinction events, marked in the fossil record, have typically taken place over a long time period compared to human history. But we can say one thing with certainty: rapid, anthropogenic climate change and environmental degradation is only making things worse for Earth’s biodiversity.
If we fail to prevent catastrophic climate change, there will be many regions of the world (some of which are highly populated) which will become uninhabitable to even us humans. This is based on human physiology and future temperature and humidity predictions under climate change. When temperature and humidity levels are too high – indicated by something scientists call a high “wet bulb temperature” – the human body is not able to cool itself by sweating. Extended periods of these high wet bulb temperatures, increasing the rate of heat stroke and death in humans are expected by later this century under medium to high emission scenarios (Newth & Gunasekera 2018), especially in tropical regions (fig. 1).
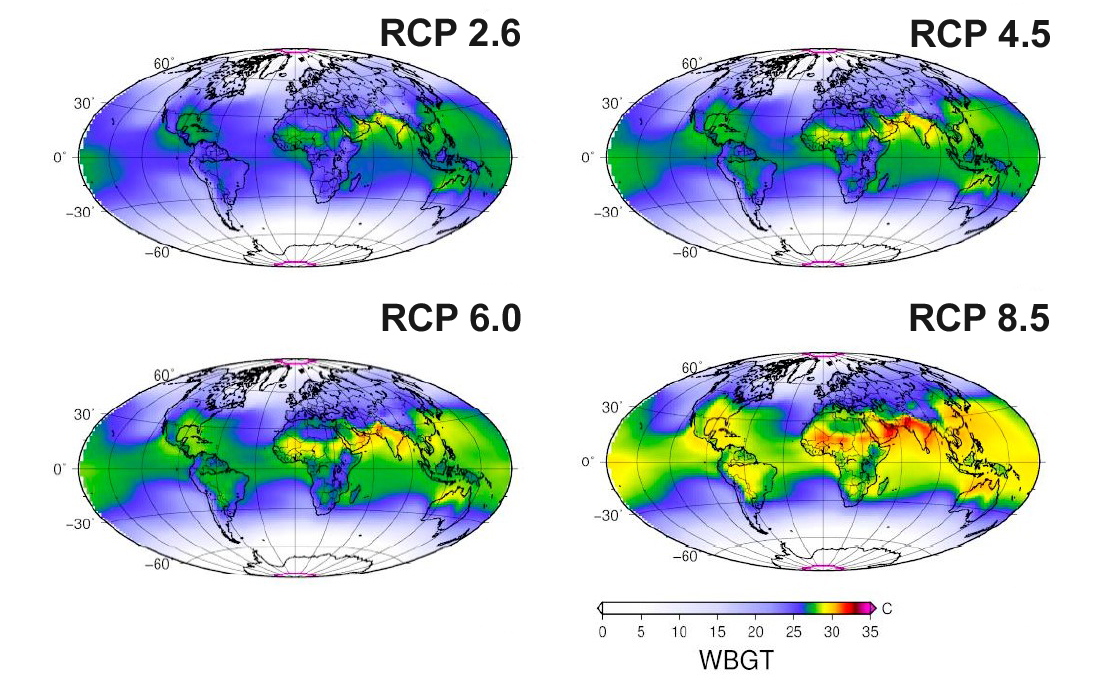
Fig. 1: Projected ten-year maximum monthly mean Wet-Bulb Globe Temperature by 2091-2100 under different Representative Concentration Pathway (RCP) scenarios. WBGT is derived from the Wet Bulb Temperature and near-surface air temperature as a proxy for globe temperature. Adapted from Newth & Gunasekera (2018).
Right now, only 1% of the Earth’s land is considered a “barely livable” hot zone, mainly within the Sahara and other desert regions. If emissions continue unregulated and climate change continues unmitigated, this fraction could increase to 19% by 2070. Billions of people live in these potential, future hot zones. Due to the current state of the global economy, many disadvantaged people residing in these potentially deadly places may not be able to move away or adapt.
In summary, the current outlook on Earth’s biodiversity is gloomy. We know that most mass extinctions in the fossil record have been triggered by the rapid onset of global warming due to an increase in carbon dioxide emissions to the atmosphere. In the past, these emissions were usually due to large, volcanic episodes which occurred over tens to hundreds of thousands of years. On a geological timescale, these changes occurred in the blink of an eye, and this is why they were so costly. The human-caused climate change that is occurring today is similar; since 1850, we have increased atmospheric CO2 levels to the highest they have been in the last 3 to 5 million years.
Even though all of this may be depressing, there is still hope. There is still time to reverse the worst effects of man-made climate change, and to do so we must reduce consumption, support conservation efforts and transition to renewable energy. For all of human history we have depended on Earth’s biodiversity, and it now depends on us to save it.
Last updated on 8 August 2024 by John Mason. View Archives


So, yes, the last glacial retreat was a good thing for the development of agriculture. But your contention that this development took place during a time of rapidly rising temperatures and sea levels is not well supported -- and really makes no difference. However, there is a clear difference in conditions described by Bettinger et al 2009:
So it appears to have been stability that gave birth to civilization. What we have provoked is rapid change and instability: deeper droughts, worse flooding, wilder extremes from winter to summer. Anecdotally, from a recent trip west: it is clear that the only people who will get a crop this year are those who can afford to buy lots of water. Poor farmers have abandoned their fields; buildings and other infrastructure are in decay. Everywhere you go, creekbeds and streams are dry and people are saying 'it's never been this bad.'
The author claims in item (B) that a 4 degree or so increase in global temperature will make things hotter than anytime in the past 35 million years. WRONG, at least according to graphs I see of Tertiary temperatures at Google "Tertiary Temperatures" (Images), which show temperatures up to 20 degrees hotter at about that time, even more earlier. So why should I believe anything else you tell me if you so egregioulsy misrepresent such easily available "facts"?
Scott, can you provide a link? See the "insert" tab above the commenting box.
Regardless of what your link says, Scott, you're not reading carefully:
"A low-range optimistic estimate of 2°C of 21st century warming will shift the Earth’s global mean surface temperature into conditions which have not existed since the middle Pliocene, 3 million years ago. More than 4°C of atmospheric heating will take the planet’s climate back, within a century, to the largely ice-free world that existed prior to about 35 million years ago."
It doesn't make the claim you say it makes. It compares a potential 2100 with the "largely ice-free world" of about 35mya.
Scott...before you simply presume that the post is "egregiously misrepresenting" facts, you should read the paper its referencing, which, lo and behold, has a reconstruction of temperatures through the Cenozoic! It may even be the one you are referring to!
That reconstruction indeed shows that there are deep ocean temps in the Eocene era that were substantially greater than today, but those were 55 million years ago. It also shows that the last time temps were consistently 4C higher than current was just prior to the Antarctic glaciation 34 mya. There may have some periods that were a touch more than 4C warmer in the following 10 million years, but that was still 24 million years ago. The point of this post is that we are likely to recapitule tens of millions of years of climate history in the span of a century or two.
If you have a reconstruction that says otherwise, link to it. Otherwise we have no idea what you're specifically talking about, and it is therefore impossible to clarify things.
Then again, maybe you really aren't interested in actually discussing the evidence.
Following Scott Sinnock's (@34) advice, I searched Google Images for "tertiary temperature". The most relevant, prominent image was this one (originally from wikipedia):
The data is from dO18 from foraminafora shells on the ocean floor. dO18 records both the ratio of fresh to salt water, and water temperature. Consequently dO18 records do not linearly equate to temperature records between different periods with very different ratios of fresh to salt water, as when large quantities of ice are locked up in ice sheets. Hence the two different temperature scales.
As Stephen Baines mentions, the paper cited in the OP shows a temperature record for the tertiary. Indeed, it shows the data in the image above, first in an unmodified form and then adjusted for the size of ice sheets to give a direct temperature measurement (Fig 3(b)):
As you can see, temperatures did not consistently exceed 4 C above mid-twentieth century values until 35 million years ago.
Finally, I did see two images that showed temperatures in the 20 degree range. One showed central european temperatures only, and hence was not representative of global temperatures. The second was the crude graph by Scotese which is (in its original form), not proxy based, but merely assigns a warm temperature for periods without glaciation, and a cool temperature for periods with extensive glaciation. It also showed global average temperatures rather than the global temperature anomaly, and therefore showed at most a 7 C increase over modern temperatures at any time in the tertiary. I do not know what figure Scott Sinnock was basing his claims on, but they are not warranted by the limited evidence he provides.
From clarification in #36, A global warming of 2 deg C is a low range optimistic value and > 4 deg C of global warming by 2100 is a high range estimate. >4 is ~1 deg per 20 years. We are 14 years into the 21st century. What is the global temp increase from 2000 till now?
We are not on track 14 years into the 21st century. I question that the Earth's crust, atmosphere, and oceans as a heat sink could allow that much change in 100 years. I tried to see the annual fluctuation in Lake superior water temps but they only record surface temps, when avg depth is 183.2 meters.
Adapting has so far been to .7F in 60 years from 1942 to 2012. What animal, plant or human can't adapt to: NOAA sea level trends: Naples Fla shows 2.4 mm/yr; Daytona shows 2.32 mm/yr. A house in Jupiter, Fla at 14.5 feet above sea level is also 4419 mm above sea level. The recent trend along Fla coast will bring sea water to the Jupiter Fla house doorstep in 1841 years, assuming no changes in continental plate rise or fall over 1841 years. Sounding so many alarms and raising electric rates 50% in 6 years to fight this seems a bit overdone.
At least Polar Bear adaptation is being relieved so far this year. On 2014 being a meltdown year in the Arctic year, there is now 93% as much ice area (May 21st) as record cold year 1979 ice area level. 2014 Peak March to late May melted area is substantially less than in same period of 1979. source: Charctic ISI.
[JH] Your "look squirrel" bloging style is very tiresome and impreses no one reading this comment thread. Please cease and desist posting coments of this nature.
Not being minded to examine a source used to spread nonsense, I will but point out that the freezy season of 2013/4 left Arctic SIA at 13.5Mkm^2, which is 89.5% of the equivilant 1978/9 figure. The latest SIA is 10.8Mkm^2, which is 89.2% of the equivilant 1979 figure.
Also, unlike Yogi Bear, the term polar bear is neither capitalised nor the subject of fictional commentary; at least, not on this website.
[JH] I belive that you have directed this coment to jetfuel.
In the future, please identify the comenter (by name) and coment (by number) that you are respo ding to.
MA Rodger @41, the current (day 142) sea ice extent according to Charctic is 12.592 million km^2. That is 92.69% (or 93% after rounding) of the 1979 figure of 13.585 million km^2, but only 90.714% of 13.881 million km^2 on day 142 of 1985, ie, he actual record year for day 142 values. 1979 was the record year for maximum ice extent, but not for maximum May extent.
Jetfuel is very careful to not tell us that the current sea ice extent is only 97.794% of the equivalent 2007 sea ice extent (12.876 million km^2), and 97.794% of the equivalent 2012 extent (12.876 million km^2). That there is currently less ice than in the former, and current record September minimum ice years, and that the former record minimim extent ice had more ice in day 142 than did the current record shows how pointless are the statistics jetfuel is quoting.
As jetfuel well knows if he has perused charctic, in May sea ice extent variability is at a minimum. At this time of year, there is the least difference between all years so that current values of sea ice extent provide almost no predictive value in predicing eventual September minimums. It also means that at this time of year there is a maximum ice melt for years with the maximum March extent relative to other years - and it means nothing in terms of determining how low the summer sea ice extent will be.
This repeat and greatly extended series of such posts by jetfuel were he takes data out of context and milks "skeptical" conclusions from them regardless of their actual import (or lack of import). He does it so consistently, and persistently in the face of correction that he is (IMO) not entitled to the presumption of honest mistakes, and I am astonished that his record of misinformation, sloganeering and repetition has not yet resulted in his loosing the privilege of posting at SkS.
Returning to the topic, polar bears are adapted to hunting on ice packs. That makes them poor hunters on land, so that summer months are lean month with many polar bears near starvation by the end of summer. The most immediate threat from global warming to polar bears is from the extended duration before they can return to the ice after summer due to the more extensive summer sea ice melts. The slightly reduced sea ice extents in March are of almost no consequence for polar bears, and also have no bearing on the critical summer sea ice extent values.
Please do not respond to any future comments by jetfuel until a Moderator has had a chance to ascertain whether or not it is in full compliance with the SkS Comments Policy. From here on out, jetfuel is on a very short leash. His/her shennanigans will be stopped one way or another.
Ahhh, but Tom, jetfuel said "area."
CT SIA for the current date is 88.23% of 1979's value and 103.15% of the satellite period record minimum for the date (2011).
And just to be complete, jetfuel, PIOMAS volume for the last day in April (PIOMAS comes out monthly) was 69.65% of its value for 1979 and 100.5% of the record minimum (2011), after having spent much of March and April 2014 as the record minimum.
Tom, Per my source Charctic, considerably less melting for this most recent 8 days (251,000 sq km) vs the same ~week in 1979 (415,000 sq km) could cause ponderance to some. Thus, in warmer Arctic Ocean water, from a thinner ice pack, and with 401 ppm CO2, ice is dissapearing slower than way back when everything had warmed less. I was just noting that the ice area @time lines were converging over that short time. Yes, that is a general trend for most years. At least that part is behaving normal this year.
Unfortunately, yes, there is 7% less ice than in 1979. Actually 2014 = 2010 amt this day.
[PS] This is a/ offtopic, b/ cherry-picking - and suspiciously like trolling. If you wish to discuss science then do so in scientific way. If you are here to amuse yourself with outrageous arguments and trolling, then please find somewhere else for your entertainment. Further offtopic comments will be deleted.
jetfuel, are you aware of the model projections for Arctic sea ice loss?
Take your answer here.
DSL, it seems ice loss outpaces most projections. Is only getting down to 4.6-5.3 in 2014 unreasonable at this point? Multiyear ice is up from 2013, but ice area trails 2013 for this day.
"Tom, Per my source Charctic, considerably less melting for this most recent 8 days (251,000 sq km) vs the same ~week in 1979 (415,000 sq km) could cause ponderance to some."
That really is the most ridiculous cherry pick I have ever seen on a climate blog. A whole eight days, wow that can't possibly be just weather noise!!!
jetfuel:
As stated above, your future posts will be carefully scrutinized by Moderators to make sure they are in full compliance with the SkS comments Policy. If they are not, they will be dealt with as appropriate by a Moderator.
Your propensity to post "look squirrel" comments tells us that you are not here to engage in meaningful discussions of climate science. Our Moderators and regular commenters have more important uses of their time and energy than tracking and responding to your shennanigans. In other words, you are on the cusp of losing your privilege to post comments on this website.
Tom Curtic @42.
Thanks for the pointer to the SIE data source. Sadly there are those who cannot understand (or probably refuse to understand="shenanigans") the simplest use of scientific terms - in this case Area and Extent. The same apprarent ignorance seems true for the effects of Arctic topology on the rate of ice loss - it slows up as it retreats through the Bering Straits. Of course, there comes a point when accumulative shenanigans become statistically irrefutable.
Speaking of migrations, over the past few years, there has been a increase of Canadian Geese who have taken up permanent residence in the San Francisco South Bay Area. The strange part about it is that the weather here is actually warm, not cold. The birds used to be seen here for the winter months, now they are here all year round, hanging at public parks, golf courses, and school fields.