


 Arguments


Recent Comments
Prev 673 674 675 676 677 678 679 680 681 682 683 684 685 686 687 688 Next
Comments 34001 to 34050:
-
Tom Curtis at 14:49 PM on 13 September 2014Thousands of ‘Nameless Short-Lived Lakes’
Riduna @1, the IPCC discusses these issues in FAQ 13.2, saying of Greenland:
"In Greenland, mass loss through more surface ablation and outflow dominates a possible recent trend towards increased accumulation in the interior. Estimated mass loss due to surface ablation has doubled since the early 1990s. This trend is expected to continue over the next century as more of the ice sheet experiences surface ablation for longer periods. Indeed, projections for the 21st century suggest that increasing mass loss will dominate over weakly increasing accumulation. The refreezing of melt water within the snow pack high up on the ice sheet offers an important (though perhaps temporary) dampening effect on the relation between atmospheric warming and mass loss.
Although the observed response of outlet glaciers is both complex and highly variable, iceberg calving from many of Greenland’s major outlet glaciers has increased substantially over the last decade, and constitutes an appreciable additional mass loss. This seems to be related to the intrusion of warm water into the coastal seas around Greenland, but it is not clear whether this phenomenon is related to inter-decadal variability, such as the North Atlantic Oscillation, or a longer term trend associated with greenhouse gas–induced warming. Projecting its effect on 21st century outflow is therefore difficult, but it does highlight the apparent sensitivity of outflow to ocean warming. The effects of more surface melt water on the lubrication of the ice sheet’s bed, and the ability of warmer ice to deform more easily, may lead to greater rates of flow, but the link to recent increases in outflow is unclear. Change in the net difference between surface ablation and accumulation is projected to contribute between 10 and 160 mm to sea level rise in 2081-2100 (relative to 1986-2005), while increased outflow is projected to contribute a further 10 to 70 mm (Table 13.5).
The Greenland ice sheet has contributed to a rise in global mean sea level over the last few decades, and this trend is expected to increase during this century. Unlike Antarctica, Greenland has no known large-scale instabilities that might generate an abrupt increase in sea level rise over the 21st century. A threshold may exist, however, so that continued shrinkage might become irreversible over multi-centennial time scales, even if the climate were to return to a pre-industrial state over centennial time scales. Although mass loss through the calving of icebergs may increase in future decades, this process will eventually end when the ice margin retreats onto bedrock above sea level where the bulk of the ice sheet resides."The most important points are the uncertainty as to whether the large increase in ice loss is due to the NAO or to global warming, and the fact that any runaway process will ground out (last sentence in the quote).
As it happens, Jason Box was a contributing author to that chapter. That does not mean the chapter reflects his views, but it does mean his views were given due consideration. Therefore to the extent that his views differ, they do not reflect the consensus of relevant experts.
Having said that, there is a divide among the relevant experts between those favouring "process based" and those favouring "semi empirical" based projections. The later give consistently higher projections than those obtained by the process based methods (on which the IPCC headline results are based, as shown in the IPCC Fig 13.12:

Figures a, b, c and d are for RCP scenarios 2.6, 4.5, 6.0, and 8.5 respectively. The black line is the median process based projection with the likely (66%) range shown in grey. Blue estimates are based on temperatures, red on forcings, with the bars showing the "extremely likely" (95%) range.
Based on that, sea level rise one or even two meters greater than IPCC projections cannot be excluded, but there is no basis in the literature for Hansen's projection of 5 meters. It should be noted that the IPCC preffers the process based projections because they are assessed as having medium confidence, while the semi emperical projections are assessed as having low confidence.
Moderator Response:[Rob P] - Tom, recent ice sheet modelling, (yet to be published in the peer-reviewed literature AFAIK) that incorporates new physics, simulates a collapse of parts of the Antarctic ice sheet over the next half-millennia.
"The new model simulates an Antarctic contribution to sea-level rise of ~15m during peak mid-Pliocene warmth and ~4.25m during the LIG, in approximate agreement with (albeit uncertain) geological sea-level indicators. When applied to long-term future simulations assuming extended RCP greenhouse gas emission scenarios and using high resolution atmosphere and ocean components, the same model physics show a dramatic retreat of Antarctic marine-based ice over the next 500 years, beginning within a few decades in the Pine Island Bay sector of West Antarctica. In the most extreme RCP scenarios, subsequent retreat of the Siple Coast margin results in the near-total collapse of the West Antarctic Ice Sheet (WAIS) within a few centuries, followed by retreat into the deep subglacial basins underlying the East Antarctic Ice Sheet (EAIS). Antarctica is shown to contribute up to 9m of sea level rise within the next five centuries."
This seems more consistent with marine sediment core samples taken from around Antarctica which imply swift dynamic responses to warming.
-
Riduna at 10:12 AM on 13 September 2014Thousands of ‘Nameless Short-Lived Lakes’
The article concludes that … By the end of the century, at that rate, [decadal doubling of ice loss] Greenland alone would be accounting for about one meter per year [of sea level rise].
This is akin to the conclusion reached by Dr Hansen in 2007 – one which has been studiously ignored by glaciologists and rejected by those contributing to 2013 IPCC report on sea level rise this century. Why? Apparently because of doubt that doubling of ice sheet mass loss per decade will be sustained over the rest of this century.
Hansen was referring to mass loss from both the Arctic and Antarctic, concluding that consequential average global sea level rise of 5m by 2100 should be an expected outcome. IPCC rejection of this does smack of common agreement by contributing scientists to ignore Hansen. In the absence of cogent scientific refutation of Hansen, does this amount to cherrypicking on their part – or is it just a healthy “concensus”?
Given the observations referred to in the article, the expectation that greenhouse gas emissions associated with permafrost thawing, on-going aerosol soot deposits on the Greenland ice sheet and loss of albedo due to sea-ice depletion – should we really cling to the notion that average global sea level will rise by no more than one metre by 2100?
-
wili at 07:39 AM on 13 September 201497 hours of consensus: caricatures and quotes from 97 scientists
So what is the post-mortem on this project? Was it a success? Did it get out into the internet? Has there been a strong response one way or the other? Do we think it persuaded some of those it was designed to persuade?
Moderator Response:[Rob P] - John Cook is very busy at the moment, but will have a post up in the next few days. I can say that it looks to have been a very successful project.
-
franklefkin at 00:27 AM on 13 September 20142014 Arctic Sea Ice Extent Prediction
5.35 million sq km looks to be a winner!
-
Dikran Marsupial at 19:44 PM on 12 September 20142014 SkS Weekly Digest #36
Just to answer Philips question more directly, no, McKitricks method is not a legitimate way of determining the length of the hiatus. The correct way would be to use changepoint detection, also known as piecewise regression, which attempts to see if there is evidence for a change in the slope of the regression function at some particular point. If there is, then the point identified would be the inferred start date of the hiatus. The major problem with this is that the standard methods (e.g. the Chow test) do not account for the autocorrelation of the time series, which means that it will tend to identify suprious changepoints.
Using the statistical test with the null hypothesis being that the underlying rate of warming has continued unchanged would also be a valid approach, and as KR says, in this case the null hypothesis would not be rejected and there would be insufficient statistical evidence to claim that there has been a hiatus.
I don't think anybody disagrees that there has been a hiatus, that much is evident from just looking at the data, however that does not mean that climate change has stopped, or is called into question, as it seems that it is likely to be due to a change in the redistribution of heat between the oceans and surface. Such redistribution is noise, not signal, but naive statistical tests do not properly account for the full range of unforced variability.
-
Dikran Marsupial at 17:14 PM on 12 September 20142014 SkS Weekly Digest #36
Philip Shehan There are two ways in which the scientific community deal with journal papers which contain fundamental errors. The most usual way is for scientists to read the paper, raise their eyebrows, think "boy, the reviewers have let that author down!", and then ignore it. The result of this is that the paper rarely gets cited and the authors' academic reputation slips somewhat. The second way is that someone writes a comment paper (a "letter to the editor") pointing out the errors, and then the scientific community continues as in the first way.
I suspect in this case, nobody will be very interested in Prof. McKitricks paper, I doubt it will get many citations (outside e.g. Energy and Environment), and it won't change anything. The fact that Prof. McKitrick published it in a lowly journal that few people read and rarely contains ideas worth using (c.f. h-index mentioned by Tom) suggests that even Prof. McKitrick doesn't think his method has much value. If he did, he would have sent it to a more prestigeous journal.
So asking you to write a journal paper on this is basically their way of saying "we have no answer to your criticism, but we are not going to admit that, and we are not going to change our minds". In this case, there is little value in publishing a comment as the journal is not sufficiently prestigeous for the paper to attract much scientific interest, and it is unlikely that the skeptics on the blogsphere would pay any attention to the comment anyway.BTW I have written several "letters to the editor", and whether they are effective depends on the nature of the audience. I wrote a paper explaining why Prof. Essenhigh's argument about the residence time of atmospheric CO2 does not mean the rise is not anthropogenic. However that has not stopped the skeptics from citing Prof. Essenhigh's paper and ignoring the refutation and not also citing my paper (e.g. the NIPCC report). I wrote another explaining the flaws in a paper about estimating the body mass of dinosaurs from their long bone measurements. While the authors of the original study were unable to accept their method was incorrect for this particular application, the research community often cite my paper, whenever the original one is cited. This rather shows a difference between some skeptics in the climate debate and the way in which scientists generally behave.
-
2014 SkS Weekly Digest #36
Philip Shehan - Sounds like a basic misunderstanding of statistics. Failure to reject the null hypothesis of no warming does not mean no warming has occurred, merely that you have insufficient data to exclude it.
To perform a frequentist test of 'no warming', you need to posit a null of warming continuing at previous rates and show that it is excluded. That simply hasn't happened.
Examining any time-span starting in the instrumental record and ending in the present:
- Over no period is longer term warming statistically excluded.
- Over no period is the hypothesis of "no warming" statistically supported against a null hypothesis of the longer term trends.
- And over any period with enough data to actually separate the two hypotheses – there is warming.
The people at JoNova's blog, not to mention JoNova herself, simply don't understand statistics or the evidence you can gain from it. Their misperceptions lead them to false (i.e., wrong) conclusions.
-
Philip Shehan at 12:59 PM on 12 September 20142014 SkS Weekly Digest #36
I might add that on Jo Nova's blog, when I raised these points, i was challenged to submit a manuscript for publication to the journal and see what the reviewers made of them.
This is a typical "skeptic" response and I pointed out that a few observations on a paper do not constitute 'original research' worthy of publication, but it did cause me to check on the Open Journal of Statistics (the 'open' in the title is enough to raise suspicions).
-
Philip Shehan at 12:53 PM on 12 September 20142014 SkS Weekly Digest #36
I will say at this point that I suspected on viewing the paper and comparing the results with those provided by the excellent skeptical science trend calculator that McItrick was converting 'warming no longer statistically significant (that is, the trend error margins include values below zero)' to a statement that this constitutes evidence for a pause, but as I noted previously, his statistics is beyond my level of expertise (limited to applications in biomedical research).
I have previously said on skeptic blogs that the requirement for statistical signficance for warming or cooling (the error margins do or do not cross the zero trend line) is "unfair" as far as a hiatus is concerned. By definition, a hiatus means that the trend is (or is very close to) zero, so any error margins no matter how small will include positive and negative trend values. It is difficult to see haow you can get a "statistically significant" pause by this criterion.
So I was wondering whether McItrick's stistical manipulations (not meant pejoratively) were a legitmate way of dealing with this problem, but considering the comments here, I remain unconvinced.
Any further comment welcome.
-
Philip Shehan at 12:11 PM on 12 September 20142014 SkS Weekly Digest #36
Thank you to all those who responded to my request for opinions on this.
It will take me some time to properly read and consider your answers, but in the meantime, thanks again very much.
-
Bob Loblaw at 09:53 AM on 12 September 201497 hours of consensus: caricatures and quotes from 97 scientists
"No person growing up has time or ability to check every fact they accept for themselves."
This jives with a saying (from the Canadian Aviation Safety Letter) I have used many times over the years: learn from the mistake of others - you won't live long enough to make them all yourself.
-
Tom Curtis at 06:43 AM on 12 September 201497 hours of consensus: caricatures and quotes from 97 scientists
dhf @40:
"Very many are trained through education and profession to recognize and disregard arguments containing logical fallacies."
Being in fact trained in formal logic, and having some practical experience in rehtoric, I can recognize your argument as an "argument from assertion".
Of course, that does not make it a logical fallacy. A logical fallacy is formally described as an "invalid argument", ie, and argument for which the premises can be true, and the conclusion false. Clearly, the argument by assertion, as the formal form of p⇒p (read as p, therefore p, where p is any proposition). That is so far from being a logical fallacy, it is in fact a tautology. It also in no way gives us more reason to believe that "p" than we had initially, and is thus a rhetorical fallacy (or from some points of view, a strong rhetorical move if you can disguise what you are doing.
Unfortunately, that which you argue for by assertion is false.
I know that becuase both induction and abduction are also logical fallacies. (I leave aside mathematical induction, which may be formally valid, but cannot be shown to be formally valid without assuming that it is.)
In the classic example of induction is the argument that because all (non-albino) crows that we have seen are black, therefore all (non-albino) crows are black. Clearly the proposition that all members of a set, S, have a given property is not logically entailed from the fact that all members of a proper subset of S, S', have that property. But the argument from induction asserts that inference to be valid. Ergo the argument from induction is a logical fallacy.
To take a practical example, it is a universal experience of humans that not all points of the Earth's surface are directly visible from one location no matter how high. It does not follow logically from that that tomorrow no human will directly see the entirety of the Earth's surface from one location. Assuming that they will is a logical fallacy, known as the argument from induction.
An even more practical example is the belief that that asperin has a high probability of reducing the pain from a headache (supported by a vast body of experience) will continue through tomorrow. It is logically consistent with all past experience that from tomorrow asperin will cause humans to die after 48 hours of excruciating agony. Any time you take asperin in the confident belief that it will reduce your headache and cause no appreciable harm, you are indulging in the logical fallacy known as induction.
Abduction (the inference to the best explanation), is even more fun in that it has the apparent form of a named fallacy, ie, that of affirming the antecedent. It is none-the-less the basis of all science. Admitedly, some scientists try for a Popperian science, but as even Popper admitted, falsification is a matter of convention - and hence even Popperian science is inductive. Indeed, as Imre Lakatos has pointed out, the inductive leap based on the fact that a theory has not been falsified is always false. As he says,
"In the distorting mirror of naive falsificationism, new theories which replace old refuted ones, are themselves born unrefuted. Therefore they do not believe that there is a relevant difference between anomalies and crucial counterevidence. For them, anomaly is a dishonest euphemism for counterevidence. But in actual history new theories are born refuted: they inherit many anomalies of the old theory. Moreover, frequently it is only the new theory which dramatically predicts that fact which will function as crucial counterevidence against its predecessor, while the "old" anomalies may well stay on as "new" anomalies"
It is clear from that last example that the very professions you probably had in mind (medical doctors, engineers) are not trained to ignore arguments based on logical fallacies. Rather, they base their careers on at least one logical fallacy, and probably many. Indeed, certainly many if they are any good.
Appeal against an argument because it is a "logical fallacy" really amounts to the old classical cannard of assuming all knowledge is certain - that only that which can be known deductively can in fact be known. In fact, in real life most of what we know is known inductively - from arguments that are not formally valid, but are reliable. That is necessarilly the case, or our knowledge would be restricted to logical tautologies, and mathematics. Indeed, at a most fundamental level, did we not accept the argumentum ad populum in our youths, we would speak no language. It is only because all around us (or nearly all) call crows "crows" and swans "swans" that we know the meaning of those words.
The reason some (at least) of the "logical fallacies" have such a hold on our minds is that they are in fact reliable ways to obtain knowledge, or at least were so under the conditions in which we evolved. Under those conditions the knowledge base of all the people was based on their every day experience of the world over generations, and within its limits was reliable (although it could sometimes be false). We did not need to check that black mambas were poisonous because we were told so by "all the people", and trusting them was a far more reliable way to obtain that knowledge (even if less certain than direct experimentation).
Not only were they reliable, they were essential. No person growing up has time or ability to check every fact they accept for themselves. That was true in the past and is even more so in modern societies with a substantial scientific and technical base.
What has changed with the development of science is not that we need no longer rely on "arguments from authority" or "arguments from all the people", but that we have realized the reliability of the people on whom we rely depends essentially on the type of experience they have. We have realized with respect to science that reading ancient greek classics is not a reliable source of knowledge, but that detailed experimentation and scientific reasoning is. Therefore we no longer include classics scholars among the people we relly on to understand physics. Instead we relly on scientists.
Doing so, of course, remains a 'logical fallacy'. It is also a reliable guide to knowledge. The key is we must ensure that scientists do not themselves relly on the argumetum ad populem in the area of their specialization. Rather, they should relly on those other 'logical fallacies', induction and abduction. So, unless you are yourself a climate scientists, you are a fool to not relly on the 97% in determining your knowledge on science. You are giving up the most reliable source of knowledge to which you have access. You are even more a fool if you do so based on myths about "logical fallacies" which have no bearing on the real world.
Climate scientists themselves, on the other hand, should not be persuaded one iota in any direction from the fact that they are in the 97%, or the 2% or the 1%. And from my experience of their works, they are not.
-
Earth Encounters Giant Speed Bump on the Road to Higher Sea Level
sailingfree, yes. However, you have to keep in mind that the "hiatus" is for surface temperature and starts roughly in 2007-2008. Not much of the accumulating energy (global warming) is going into warming the troposphere/surface. Most is going into the oceans. Not much of a hiatus there.
-
sailingfree at 05:31 AM on 12 September 2014Earth Encounters Giant Speed Bump on the Road to Higher Sea Level
From a newbie: Does the continued rise in SL during the recent temperature hyiatus show continued GW?
Moderator Response:[Rob P] - Yes, that's how very simple this is. Sea level rise is a combination of extra water volume from the melt of land-based ice, and the expansion of seawater as it gets warmer. The ongoing rise in sea level, although complicated by a number of factors, is a clear indication the oceans are continuing to warm.
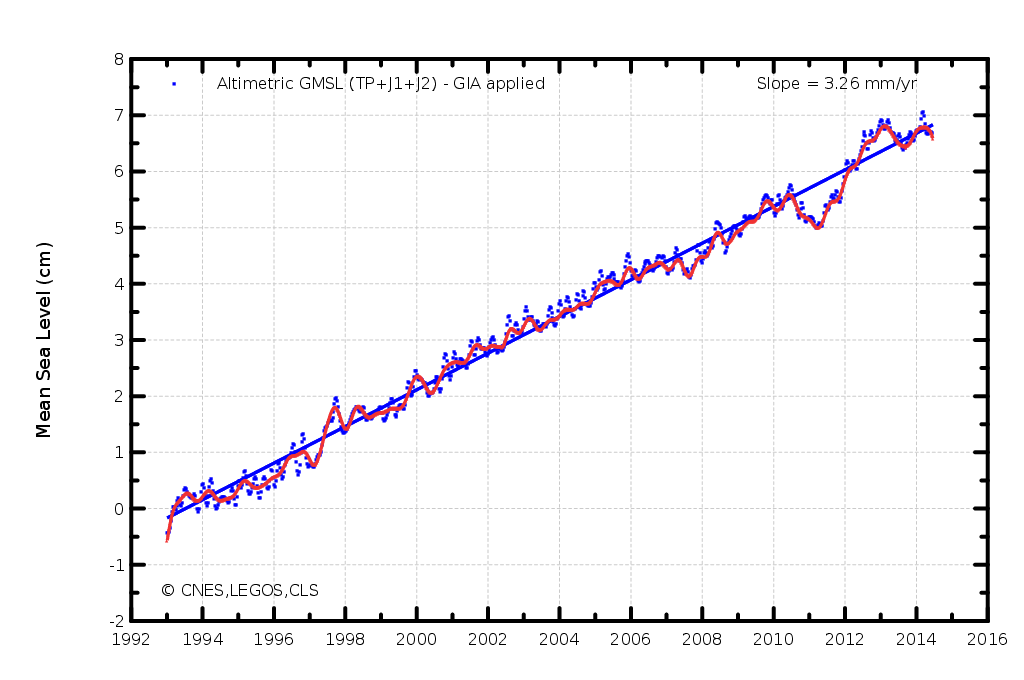
As for surface warming, the rate appears to have slowed over the past decade or so, but one needs imagination to describe it as a pause or hiatus. Plenty of people possess the necessary imagination of course......
-
knaugle at 05:10 AM on 12 September 201497 hours of consensus: caricatures and quotes from 97 scientists
I fully accept that all but a very few climate scientists are convinced AGW exists, and is of concern, and has strong science behind it. Even Richard Tol admits 90+% of scientists are convinced. Still the 97% number has been around as long as Naomi Oreskes and hasn't changed in 11 years. Numbers that constant (pi notwithstanding) usually make me suspicious, not of the science but how we are communicating it.
Moderator Response:[Rob P] - Richard Tol only accomplishes a lowering of the consensus to 91% by magicking up 300 extra rejection papers - he camouflages this with technobabble in his paper. IIRC only 78 were found in the entire rating process of Cook et al (2013). To my knowledge, not even one extra rejection paper has been found let alone 300.
As for 97% & Oreskes; I think you may be misremembering - Oreskes (2004) found no papers at all that rejected the consensus.
-
Phil at 04:52 AM on 12 September 201497 hours of consensus: caricatures and quotes from 97 scientists
dhf @36 and 40
You are incorrect, the argument is only an "appeal to the masses" if the argument is being presented to the 3%, i.e. if someone used this argument to try to persuade Lindzen, Spencer, Pat Michaels, etc.
However it is being used to convince a much wider, less knowledgable, audience, and thus is, in fact, an appeal from authority ( http://en.wikipedia.org/wiki/Argument_from_authority )
-
Atom at 03:36 AM on 12 September 2014Water vapor is the most powerful greenhouse gas
I have a question. Since warming causes more atmospheric water vapor and more atmospheric water vapor causes warming, why doesn't the water vapor feedback become self sustaining as a result of any natural change in global temperature, such as an El Nino? The effect must be self limiting or the planet would just keep heating up. What breaks, interrupts or stalls the feedback loop?
Moderator Response:[TD] Good question! See the answer in the post on positive feedback.
-
Tom Curtis at 00:29 AM on 12 September 20142014 SkS Weekly Digest #36
Dikran @30, indeed. Number 405 on the list.
-
Dikran Marsupial at 23:38 PM on 11 September 20142014 SkS Weekly Digest #36
Tom, I understand it is also on Beal's list of predatory open access (author pays) publishers - more or less academic vanity publishing. I definitely won't be sending any papers there! ;o)
-
Ferroequinologist at 23:22 PM on 11 September 2014We didn't have global warming during the Industrial Revolution
Alan Titchmarsh was correct when he said you couldn't have seen across the street in the early days of the Industrial Revolution for all the carbon emissions and crap- If you take Carbon emissions literally- i.e. NOT CO2; just soot!
-
Lionel A at 23:21 PM on 11 September 201497 hours of consensus: caricatures and quotes from 97 scientists
Lars, I wonder if Pat and Judy will be annoyed or relieved at being absent?
-
Tom Curtis at 23:19 PM on 11 September 20142014 SkS Weekly Digest #36
Dikran Marsupial @28, the Open Journal of Statistics has a Google Scholar h5 ranking of 5, with a h5-median of 4. That is, in the last five complete years, the journal has just 5 articles which have been cited 5 or more times, and for those five articles, the median number of citations is 7. That compares the mean h-5 ranking of the top 20 statistics journals of 41.45, with a mean h5-median of 65.5.
Such a low h5 index could well be achieved by self citations alone.
It is no wonder that the first thing the website for McKittrick's paper informs you is that it is "An academic publisher". Without that flag, it is dubious that you would notice.
-
Lars Karlsson at 23:15 PM on 11 September 201497 hours of consensus: caricatures and quotes from 97 scientists
And Spencer is the last one of the three against!
-
Dikran Marsupial at 22:56 PM on 11 September 20142014 SkS Weekly Digest #36
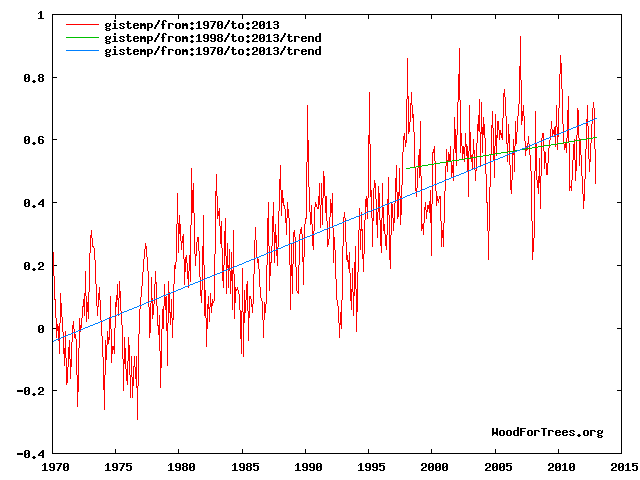
Philip Shehan, just to add to the already excellent answers on this, the ridiculousness of McKitricks' conclusion is shown by just plotting the trend for the 26 year hiatus in the RSS data along with the trend for the entire dataset:
You can immediately see that the OLS trend during the hiatus is almost exactly the same as the trend over the whole period. Also there is no obvious evidence of any change in the rate of warming in 1988 (1998 perhaps!), which is what you would expect at the start of a hiatus.
McKitrick's error is in calling a period where the trend is not statistically significant "trendless". A Failure to reject the null hypothesis in a statistical hypothesis test does not mean that the null hypothesis is true, and never has done. To see why this is true, we can consider flipping a coin (which is much easier to analyse).
Say I have (unknown to you) a double headed coin, and you want to determine whether the coin is biased. The first thing to do is to state the null and alternative hypotheses:
H0: The coin is unbiased - p(head) = p(tail) = 0.5
H1: The coin is biased, p(head) != p(tail)
We then observe some flips of the coin, and evaluate the probability (known as the p-value) of a result at least as extreme as the one we observe assuming that H0 is true. This is an important point, you suspect me of cheating and have a biased coin, but to provide self-skepticism, the test by starts by assuming you are wrong and that the coin is unbiased. If the p-value is sufficiently small, often 1 -0.95 = 0.05, then we consider the observations sufficiently unlikely and we "reject the null hypothesis" and can continue with the alternative hypothesis. Otherwise we "fail to reject the null hypothesis" and should keep quiet about H1 for the time being.
Note the purpose of the test is to avoid getting carried away by our enthusiasm for H1, so we have the hurdle of at least being able to reject H0.
Right, say we flip the coin four times, and get heads four times in a row (unsurprising as it has a head on both sides). The p-value (assuming an unbiased coin - which is H0) is 0.5*0.5*0.5*0.5 = 0.0625. This is more than 0.625, so we "fail to reject the null hypothesis", but does that mean that H0 is true? Definitely not, the coin is as biased as it could possibly be!
So what went wrong? The problem is that if you only flip the coin four times, we will never be able to reject the null hypothesis as the p-value can never be smaller than 0.0625. This is because if we don't have enough observations, the test lack statistical power. The power of a test is the probability that the H0 would be rejected if it actually is false. If the test has very high power, then not being able to reject the null hypothesis is evidence that the null hypothesis is true. If the test has low statistical power, then a failure to reject the null hypothesis may be because it is true, or because we don't have enough data to confidently show that it is false.
The bottom line is that a failure to reject the null hypothesis does not imply the null hypothesis is true, unless the test has high statistical power. McKitrick does not evaluate statistical power, but he really should have done! In saying that the period is trendless, he is asserting that the null hypothesis is true. Just plotting the diagram shows this clearly isn't reasonable in this case.
The other key problem is that he is looking (cherry picking) the longest period possible to get a trend that just fails to achieve statistical significance. This means that the observed trend would be a rather unlikely thing to see even if there were a hiatus. Essentially if we had a large number of Earths in parallel universes that were undegound a hiatus (and H0 were true) then about 95% of them would have a trend that is lower than the one we have observed.
This really is a STATS101 issue, and it is dissapointing that this wasn't picked up by the reviewers of a statistics journal.
-
Tom Curtis at 22:12 PM on 11 September 20142014 SkS Weekly Digest #36
Philip Shehan @24, this topic came up at And then there's physics. The key point is that the V-F method used by McKittrick indicates the pause starts at the earliest year such that for that year, and for each following year, the trend to the terminal year is not significant. That permits, however, that there be trends from the initial year to years prior to the terminal year that are significant. In such cases (and it is the case with every temperature set examined by McKittrick) it clearly begs the question to assume that there is a "pause" over the entire period, including over that subperiod in which there is a statistically significant warming trend. That, however, is just what McKittrick does. Indeed, I would go further and say they assymitrical treatment of trends to the terminal year and other trends shows the statistical analysis to be rubbish.
For the record, here are the longest statistically significant warming trends from the year the "pause" started according to McKittrick's method, as determined on the SkS trend calculator:
"RSS: 1990-2010: significant; -2013: not significant (24 years)
UAH: 1993-2010: significant; -2013: significant (21 years)
HadCRUT4: 1995-2011: significant; -2013 not significant (19 years)
NCDC: 1995-2007 significant; 1995-2013 not significant (19 years)
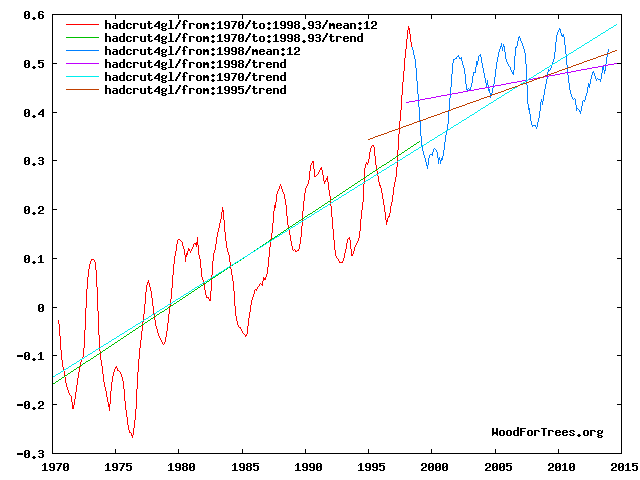
GISS: 1996-2010 significant; -2013 not significant (18 years)"Finally, here is HadCRUT4 running 12 month means from 1970 showing various trend lines. It is plain from the data that it has warmed since 1995 in that data set, and indeed that it warmed through to about 2007. The apparent "hiatus" is almost entirely an artefact of the strong El Nino in 1998 coupled with the record breaking La Nina in 2011-12:
-
Tom Curtis at 21:54 PM on 11 September 20142014 SkS Weekly Digest #36
MA Rodger @16, a light correction. Fig 1a (shown by you) is the regression against ENSO, volcanic record, and solar only. Fig 1b is further regressed against the AMO defined as the linearly detrended NA temperature:

Jim, As I commented above, the result is near linear which is unsurpising given that the AMO used is just the North Atlantic temperatures minus a linear trend. Had the AMO been defined as the North Atlantic temperatures minus total CO2 forcing, the result would have mirrorred GHG forcing over the twentieth century. A paper doing that would have been rejected by AGW deniers as being circular (for good reason), but the same is equally true of Zhou and Tung. (Note, it is not strictly circular. To be strictly circular they would have needed to define the AMO as the linearly detrended global temperatures.)
In fact, the only sensible definition of the AMO from twentieth century data I am aware of is that from Ting et al (2009) (third panel), which is discussed in reference to Tung and Zhou by KR here:

Leaving aside, however, which is the correct AMO signal of the three (in order, linearly detrened NA, NA-Global Oceanic Mean, and NA-NA forcings), it is plain that very different results would be obtained by using either the second or third definition to that obtained by Zhou and Tung.
And finally, seeing as I'm showing figures, here is the CET series at 10, 15 and 50 year running averages. If anybody can show me the consistent approximately 60 year oscillaiton in that series I will be very impressed. Absent that persistent oscillation, there is no reason to think the AMO is a genuine mode of internal variability in global temperatures, rather than an artifact of the forcing history of the twentieth century.

-
MA Rodger at 19:21 PM on 11 September 20142014 SkS Weekly Digest #36
Philip Shehan @24.
This may or may not help but...
I always see four different flavours of "hiatus" being discussed. The first is the David Rose of the Daily Rail version. This version simply shows that the present global temperature is still below the temperature of some cherry-picked temperature of time gone-by. Thus the 'hiatus' is, to be as silly as possible, using HadCRUT4 24 years and 4 months long. The silliness becomes plain when average temperatures over a year or a half decade are compared, rather than single months.
The second flavour is courtesy of Dickie Lindzen who fed the question to Prof Jones via the BBC's Roger Harrabin. Has gobal temperature rise been statistically insignificant over the last X years? The answer given was "Yes, but only just," which I consider to be correct but the wrong answer. The answer should be 'Yes, just like the period of Y years previous to that, and the previous period of Z years before that again. No statistically-significant rise does not mean no significant rise.'' The actual value of X is a function of the rise as well as the size of the wobbles. (Stat significance is not proportional to X but to X^1.5 (or is it X^2.5?) which is why X and Y and Z don't change much.). For the same rate of rise, bigger wobbles means X will be larger. X is usually ~16 years for the likes of HadCRUT (although HadCRUT(T&W) would perhaps be more appropriate to use). Using satellite data UAH or RSS gives you bigger wobbles and so gives you larger X.
The third flavour is the answer to the question "When did the 'hiatus' in global temperature begin?" and I would suggest that happened in 2007. Doing what Ross the Mac did but forwards not backwards so you've got more data and significance is maintained. This method shows that the global temperature record modelled as a linear trend was accelerating (the slope getting steeper) up to that point. See graph of GISStemp regressions two clicks down here. The slope peaks so the rise stops accelerating only in 2007. To say an accelerating linear trend is subject to a 'hiatus' would be an difficult statement to substantiate (although that will not stop fools saying it).
The fourth flavour leads to a more grown-up discussion and it is about when the symptoms that lie behind the 'hiatus' first appear, which is during the half-decade prior to the impact on global temperatures.
-
Dikran Marsupial at 18:42 PM on 11 September 201497 hours of consensus: caricatures and quotes from 97 scientists
dhf it is dissapointing that you appeared to have ignored the responses to your initial post on this thread.
Do you think it is rational for those unable to understand the science of climate change to base their views on the balance of expert opinion on the topic, yes or no? If no, please explain why.
-
Philip Shehan at 16:41 PM on 11 September 20142014 SkS Weekly Digest #36
In the last week the “skeptic" blogs have been agog with Ross Mc Itrick’s statistical analysis that the haiatus goes back 16, 19 or 26 years depending on the data set.
file:///C:/Documents%20and%20Settings/user/My%20Documents/Downloads/OJS_2014082814175187.pdf
Reliably, Watts puts up a graph of the Hadcrut4 data set (1995 to April 2014) from WFT but decides not to put in the WFT trend line which like the data in Mcitrick’s paper indicates a warming trend of 0.0925 °C/decade (the skeptical science trend calculator gives Trend: 0.093 ±0.100 °C/decade (2σ)) but substitutes a cooling slope.
http://wattsupwiththat.com/2014/09/01/new-paper-on-the-pause-says-it-is-19-years-at-surface-and-16-26-years-at-the-lower-troposphere/
My problem with McItrick’s paper is that he appears to be claiming that unlike the skeptical science trend calculator, his data shows that the hiatus is statistically significant. The stats is a bit beyond me , Does anyone have any ideas?
-
Leto at 15:50 PM on 11 September 201497 hours of consensus: caricatures and quotes from 97 scientists
dhf @40... Do you have a point? If so, make it.
-
97 hours of consensus: caricatures and quotes from 97 scientists
Very many are trained through education and profession to recognize and disregard arguments containing logical fallacies. The reputation of individuals and organizations are at risk when they use logical fallacies in their argumentation.
Moderator Response:[JH] You are already skating on the thin ice of sloganeering which is prohibited by the SkS Comments Policy.
Please note that posting comments here at SkS is a privilege, not a right. This privilege can be rescinded if the posting individual treats adherence to the Comments Policy as optional, rather than the mandatory condition of participating in this online forum.
Please take the time to review the policy and ensure future comments are in full compliance with it. Thanks for your understanding and compliance in this matter.
-
97 hours of consensus: caricatures and quotes from 97 scientists
On the other hand, the consensus of evidence . . .
-
Dikran Marsupial at 04:56 AM on 11 September 201497 hours of consensus: caricatures and quotes from 97 scientists
dhf Ironically it is the skeptics that initiated this with their petitions suggesting that there isn't a consensus and that the basic science is seriously questioned amongst scientists. Pointing out that this is not true is not a logical fallacy.
The point is that nobody is seriously suggesting that the existence of a consensus actually has any bearing on the science (actually the causal arrow is in the opposite direction). Those who understand the basic science are unlikely to care about the consensus. How should those who don't understand the science evaluate the issue? I would suggest that following the consensus view of the experts is a fully rational thing to do. That is the point.
-
97 hours of consensus: caricatures and quotes from 97 scientists
dhf - Please be careful with the alternative 'Galileo gambit' fallacy frequently offered by the pseudo-skeptics, that they are iconoclastic geniuses who see everything more clearly than the vast majority of scientists studying the data.
From RationalWiki:
In reality, taking up the mantle of Galileo requires not just that you are scorned by the establishment but also that you are correct — that is, that the evidence supports your position. There is no necessary link between being perceived as wrong and actually being correct; if people perceive you to be wrong, you usually are wrong.
There are far far more cranks than Galileos - the consensus generally reflects the most reasonable interpretations of the data. And it doesn't help 'skeptic' arguments to see that every self-identified climate Galileo holds different, contradictory hypotheses, sometimes with a single pseudo-skeptic expressing multiple contradictions simultaneously.
I will note that the last time the scientific consensus shifted on this topic was mid-20th century, the '50s and '60s, when accumulating evidence began to convince climate scientists that we affected climate change - the shift to acceptance of AGW. Reversing that consensus would take a completely new and convincing set of evidence - and none is apparent.
-
97 hours of consensus: caricatures and quotes from 97 scientists
Please be careful with the consensus argument.
"In argumentation theory, an argumentum ad populum (Latin for “appeal to the people”) is a fallacious argument that concludes a proposition to be true because many or most people believe it. In other words, the basic idea of the argument is: “If many believe so, it is so.”
This type of argument is known by several names,[1] including appeal to the masses, appeal to belief, appeal to the majority, appeal to democracy, appeal to popularity, argument by consensus, consensus fallacy, authority of the many, and bandwagon fallacy, and in Latin as argumentum ad numerum (“appeal to the number”), and consensus gentium (“agreement of the clans”)."
http://en.wikipedia.org/wiki/List_of_fallacies
-
jim10940 at 03:09 AM on 11 September 20142014 SkS Weekly Digest #36
I agree that the contrarian blogs are very bad nonsense. But the 2013 and 2014 papers by Tung were somthing i was not able to work through on my own. The references and discussion KR and Tom provided helped very much! Now back to thesis writing!
-
2014 SkS Weekly Digest #36
jim - Regarding Curry contradicting her own work, see Rabett Run, Curry vs. Curry, where he describes the situation far better than I could.
Christy is, if anything, worse - he habitually presents irrelevant, uncorrected, cherry-picked (Sierra Nevada winter snow extent _only_ while ignoring yearly anomalies and the greater Rockies), or simply deceptive information (graph from Christy), and claims from those that climate change either isn't happening or isn't having an impact. I consider his impact on public policy to be strictly destructive.
I would suggest reading a wider variety of work.
-
2014 SkS Weekly Digest #36
jim - Ah, that explains the Duarte mention. Happens to everyone, I'm really bad at remembering names myself.
We are facing the first clear evidence of a dangerous climate change. However, some of the researchers and some of the media are plunged into a semantic debate about whether the Arctic Sea-Ice has reached a tipping point or not. This all is distracting the attention on the need to develop indicators that warn about the proximity of abrupt changes in the future, as well as on the policymaking to prevent them.
I would consider this a well-reasoned statement against hysteria. I would not consider him to be optimistic regarding climate change, however, as his work has also stated:
Loss of Arctic ice due to anthropogenic climate change is accelerating, with the extent of Arctic sea ice displaying increased variance at present, a leading indicator of the proximity of a possible tipping point. Reduced ice extent is expected, in turn, to trigger a number of additional tipping elements, physical, chemical, and biological, in motion, with potentially large impacts on the Arctic marine ecosystem.
Hardly an optimistic outlook, IMO.
Side note: your mention of "I keep getting exposed to" Curry, Duarte (Jose), and Tung give me the impression that you've been reading denialist nonsense blogs that emphasize those particular positions. You should avoid those - they rot the brain.
-
saileshrao at 02:05 AM on 11 September 2014When their research has social implications, how should climate scientists get involved?
Sapient Fridge@36: Good point, sorry for not cutting those out.
Moderator@31: I'm unable to access the Comments Policy link as it is behind an authentication firewall.Moderator Response:[JH] Click here to access the SkS Comments Policy.
-
jim10940 at 02:02 AM on 11 September 20142014 SkS Weekly Digest #36
KR @ 17 I am in an Agricultural Engineering department which does a lot of work with extention and I attend the Southeast Climate Conference of which John Christy and Judith Curry are prominent. I think in my department, which does a lot of extension work, most members don't want to emphasise climate because frankly our clients (farmers, water managers) don't want to hear about it. It seems adaptive response to current climate variability is an acceptable argument for the extension work but don't talk about climate change.
-
jim10940 at 01:44 AM on 11 September 20142014 SkS Weekly Digest #36
KR @17 this is very embarrasing. I am confuseing my Duarte's. I meet Carlos Duarte and he seemed to downplay the effect the severity of the climate threat, giving reasons for optimism. But I dont even whant to attribute that position to him maybe he was just making the argument.
-
Tom Curtis at 01:38 AM on 11 September 20142014 SkS Weekly Digest #36
jim @13, I am not claiming that is what Tung did. I am claiming it is what you can do with Zhou and Tung's data, and that when you do it falsifies the claim that 40% of warming over the last 50 years was due to internal variability. Further, using Zhou and Tung's data if you accept the 40% claim, you are then required to accept that for a 30 year period from 1974 onward where natural variability accounts for 100% of warming (indeed, more than 100% once ENSO is included). That, however, is strictly inconsistent with the known relative strengths of anthropogenic and natural forcings, and the idea that anthropogenic forcings effect temperature. In other words, Zhou and Tung require the physics of climates to change on a decadal time scale for their regression to make sense.
In Zhou and Tung 2013, they do infact determine a residual after removing solar, volcanic, and ENSO components. The result is close to a straight line, which is no surprise given that they defined the AMO as the North Atlantic temperature minus a linear trend. To the extent that NA temperatures follow global temperatures, it follows that the residual of the regression will be a straight line and overstate the AMO component. The result is close to circular, and of little interest as a result.
-
2014 SkS Weekly Digest #36
jim - WRT Tung, not even the most prominent and respected people can be expected to bat 1000. And he's hardly alone in misidentifying the textbook definition for AMO (linearly detrended N. Atlantic SSTs) as correctly depicting internal variability in the Atlantic; internal Atlantic variation is change over and above what occurs due to the non-linear forcing changes (natural and anthropogenic) over the period under consideration.
Cognitive bias certainly plays a part in interpreting science, particularly in the public policy arena, but it really doesn't have any significant effect on the science, the data, itself - reality is a very harsh critic. Unless you're a fan of Stephen Colbert, who's noted, "Reality has a well-known liberal bias." :)
Judith Curry is a curious case, someone who overemphasizes uncertainties to the point of contradicting her own prior works. Just keep in mind that there are very very few scientists unconvinced by the evidence for AGW, for our role in climate change, and that those very few get overamplified by the blogosphere and media, overrepresented, because they are the only ones to ask for contrary opinions and false (i.e., unsupported) 'balance'. That overrepresentation doesn't make them right, and in fact is a useful heuristic for identifying extremely minority positions.
[ If you're actually a grad student in climate related work I'm very puzzled by your mis-identification of the recently blogging Duarte as an ocean ecologist - to the best of my knowledge he's actually a PhD candidate in Social Psychology, one who appears to have ideological axes to grind, personal issues seemingly disconnected from the work he then criticizes. ]
-
MA Rodger at 01:15 AM on 11 September 20142014 SkS Weekly Digest #36
jim @13.
The MLR analysis carried out by Zhou & Tung (2013) is a single process which takes a data series (D) and a set of functions (Fa Fb Fc etc) and calculates the best fit such that D= xFa +yFb +z Fc + residuals. Zh&T did this without AMO and produced their Figure 1a.

This is all non-controversial. It is when ZH&T repeat the exercise but with AMO (shown in the inset with the de-trended residuals) added to Sol Vol & ENSO and various profiles for Anthro that it all starts to go wrong. But attributing AMO is their whole purpose, so without it there is no MLR analysis.
The strength of AMO's input into HadCRUT (where they get their 40% from) is a simple output from the MLR. You can fire off a whole pile of objections as to why using AMO in the MLR is simple curve-fitting but even when we had KKTung here last year (here and here) to present his version of it, answers were not forthcoming.
-
2014 SkS Weekly Digest #36
You have elevated Jose Duarte to a position he has yet to earn. The kid's loud, confident and wrong.
-
jim10940 at 00:13 AM on 11 September 20142014 SkS Weekly Digest #36
The reason I am pursuing the climate literature so closely is that I am troubled by the role cognitive bias plays in climate science. It seems that those that those that support global warming as severe and imminent threat are classic liberal while those who doubt its severity are libertarian or republican. Now I personally think that global warming is a severe threat but then I'm a classic liberal. If only I were libertarian and believed global warming was a severe threat this would be so much easier!
I am currently a graduate student doing climate related work but i keep getting exposed to prominent scientists that seem to downplay the severity of global warming. i.e. Judith Curry (climate scientist), Jose Duarte (ocean ecologist) and now I suppose in the literature Tung. My explanation is that they may be biased by their social beliefs but than this makes me question my own biases.
-
jim10940 at 23:57 PM on 10 September 20142014 SkS Weekly Digest #36
Tom @11 That was my thought at first was well, that it seemed ridiculous just to plot the increase over the last upward swing of the AMO cycle. But i dont think thats is what Tung is doing. I think he is using the residual after removing the oscillation. I could be wrong, but if he is doing what you claim that would truly be ridiculous. I don't think that would have gotten through the review process.
-
jim10940 at 23:52 PM on 10 September 20142014 SkS Weekly Digest #36
KR @10 the link to posts where Tung laid out his defence were very helpful. I think i now understand what the problem is. The AMO has an 80yr oscillation and the completes 2 cycles in the modern record since 1850. But it also is undergoing a nonlinear increase. I take it that Tung is calling this increasing temperature in the AMO in the recent decades as partially explaining global temperature rather than a response to global temperature. I am not able to get much deeper into it but I think its more likely long term warming (longer than the AMO cycle) is likely to be a response not a driver.
This is so puzzeling to me because Tung does great work. Its very technically adept and his latest paper published in Science is a very important document of the response of the Atlantic to global warming.
I get the sense that his 2013 paper is good but the review process failed in letting him make a such a strong claim. I get the impression that he wanted to make similar strong claims in his 2014 paper but here the review process did not allow that.
-
DerekfromBerwick at 22:48 PM on 10 September 2014Cutting Emissions Pays for Itself
This is not a surprise but what scale of activity is required to see a payback of this order? Would a small town of a few thousand see an impact in terms of health benefits or does the unit size need to be larger? What would be useful to know is how the benefits breakdown as this would allow for a better understanding of how policy changes would impact on a population.
-
Lionel A at 21:27 PM on 10 September 201497 hours of consensus: caricatures and quotes from 97 scientists
I see Richard Lindzen has indeed joined the group, between David Karoly, Keith Shine and Veerabhadran Ramanathan.
Prev 673 674 675 676 677 678 679 680 681 682 683 684 685 686 687 688 Next


