


 Arguments


Recent Comments
Prev 718 719 720 721 722 723 724 725 726 727 728 729 730 731 732 733 Next
Comments 36251 to 36300:
-
michael sweet at 20:15 PM on 20 May 2014Behind The Times - another manufactured climate controversy conspiracy theory
Roy Spencer also has polotical connections (see linked list of associations from Desmog blog) inlcuding the Heartland Institute and the George C. Marshall Institute. That makes 3. How many of the 3% of climate scientists that deny AGW are members of these organizations?
-
chriskoz at 16:17 PM on 20 May 2014Behind The Times - another manufactured climate controversy conspiracy theory
Michael Mann, who among all of us, is in the best position to comment on this episode of denial campaign, has written an OP in huffingtonpost. A good complementary reading, well agreed with Dana's article herein.
-
scaddenp at 14:54 PM on 20 May 201497% - A Statistically Representative Debate On Global Warming
You might also perfer to comment "Its a natural cycle" as place to comment. Your commentary might be better if you look at the paleoclimate section of the IPCC report first however.
-
Tom Curtis at 14:11 PM on 20 May 2014Sense and climate sensitivity – more evidence we're in for a hot future
Klapper @38:
First, you are confusing two issues. First, wind disperses aerosols from their source of emissions. That means the area over which the forcing applies does not exactly coincide with the area of emission. In China, the wind initially disperses aerosols to the WSW. but as the aerosols gain in altitude that reverses and they are dispersed to the ENE. These directions vary with season, as does the distance aerosols typically travel before exiting the atmosphere. In China, that means the dispersal is to the WSW for two seasons of the year, and largely static with a thin tail to the ENE for the other two seasons.
In addition to this effect, air that is warmed (or cooled) by a given regional forcing is then carried downwind. There it mixes with cooler (or warmer) air. Cooler (or warmer) air upwind of the regional forcing will also be carried down into hte area of the forcing. The consequence is that the temperature effect of the forcing is more dispersed than the forcing. That is, you have two stages of dispersion. In the first, the aerosol becomes more dispersed than its source; and in the second stage the temperature effect of the aerosol becomes more dispersed (and diffuse) than its source.
Chriskoz (@29) was referring to the later effect. That effect is purely a funtion of surface winds because it is the surface air temperature we are discussing. The more complicated case with the dispersion of aerosols has already been discussed above, and is a seperate issue. Your confusing of the issue looks like your trying to have two bites of the cherry. Having been comprehensively refuted on aerosol dispersion above, you appear to argue aerosol dispersion must be greater than observed, and more favourable to your case than is observed because of some effect of wind which is in addition to the observed dispersion of aerosols.
Second:
"Looking at the Bejing/Shanghai zone, it can be boxed by 110 to 122.5 and 27.5 to 42.5."
Seriously?
After all the discussion above, your just going to exclude Chengdu (104 E) from consideration, even though it is the only area to have red or greater aerosol concentrations year round in China; and restrict yourself to the Peking/Shanghai corridor despite the fact that for half the year it shows yellow or less aerosol concentration; and just totally ignore the temperature dispersion from prevailing winds even though you (following Chriskoz) brought it up?
Your new region of choice is a blatant cherry pick that simply ignores the prior discussion. Having been shown wrong on almost every point you simply attempt to start the argument again showing that you have learnt nothing, and that it is a waste of time continuing the discussion with you.
-
scaddenp at 13:42 PM on 20 May 201497% - A Statistically Representative Debate On Global Warming
Terranova, perhaps the best way (often used and I should have done it too), is to respond in the appropriate thread, and then post a pointer to response in the originating thread. At the top of a comment, is a link with the date. Copy this link and then use as a referrer.
In those appropriate places, by all means give us examples of "over the top" predictions in papers or IPCC reports; and also evidence that we see now is part of natural cycle. Use the search function at the top to find appropriate threads.
-
Klapper at 12:24 PM on 20 May 2014Sense and climate sensitivity – more evidence we're in for a hot future
@Tom Curtis #37:
I disagree with your surface winds argument. Aerosols don't just hang close to the ground and their forcing is not just at ground level, it's all the way up the atmospheric column as volcanic episodes show. Your AOD map in post 34 shows dispersion to the NE, out over the Pacific, which is the direction of the prevailing winds on the maps I found and which you noted in your post 32.
Your PM2.5 map in post 28 shows the aerosol maximums in the Bejing/Shanghai corridor. I think you would agree to this? Also in post 28 the warming map for China in this same area shows "red", in the range of 0.4 to 0.6C, although I'm not sure over what time period this is.
Looking at the Bejing/Shanghai zone, it can be boxed by 110 to 122.5 and 27.5 to 42.5. If you take a land only dataset (I choose CRUTEM4.2 since the grid is 2.5 degrees not 5), the warming rate in this area is 0.30C/decade for the last 30 years. For the global land CRUTEM4 shows 0.28C/decade.
So the most aerosol polluted geographic area on the planet is warming slightly faster than the globe. Again I ask the question: how do you reconcile this basic fact with the interpretation that anthropogenic aerosols are a negative (cooling) forcing?
You are right that
-
Terranova at 11:53 AM on 20 May 201497% - A Statistically Representative Debate On Global Warming
To JH @ 17:
Since you asked, I assume I will be able to reply here. First, I would like a clear explanation of the SkS definition and use of the term "sloganeering".
Second, I come here to learn, and to discuss. I'm hardly interested in debating or lecturing. When I am asked a question about one of my comments, and I take the time and effort to directly reply with written or graphical data, only to find that reply gets "disappeared" - it becomes frustrating.
I don't mind taking the discussion to another thread, but if a point I raise in Thread A is challenged in Thread A, and I reply to the challenge in Thread A with the requested data and/or reasoning, and then that response is moderated or removed because it is off-topic, it begs a question.
I prefer civil, intellectual discourse on a level playing field. With that being said, I think this website can still offer that type of interaction in spite of what appears to be biased moderation as described in the above paragraph. If a topic needs to be moved to another thread, then start the moderation with that and don't allow rebuttals on the original page.
Moderator Response:[JH] What you are looking is contained in the SkS Comments Policy.
Please note that posting comments here at SkS is a privilege, not a right. This privilege can be rescinded if the posting individual treats adherence to the Comments Policy as optional, rather than the mandatory condition of participating in this online forum.
Please take the time to review the policy and ensure future comments are in full compliance with it. Thanks for your understanding and compliance in this matter.
-
Tom Curtis at 10:06 AM on 20 May 2014Sense and climate sensitivity – more evidence we're in for a hot future
Klapper @35, first, Chriskoz reffered to the effects of air bodies that are warmed, or cooled at one location being carried downwind thereby warming or cooling a location further downwind. As we are talking about the surface (2 meter) air temperature, it is surface winds we are talking about for this effect. Downwind for surface winds is West-SouthWest from the line from Beijing to Shanghai, not NorthWest (or indeed North-NorthWest) of it as required by your theory.
Second, you claimed @27:
"As I pointed out in my original post #26, the fact that China has experienced both a faster than global SAT warming rate and extremely high local aerosol forcing is reason to question the "anthropogenic aerosols are a negative forcing" assumption."
That is a significantly stronger claim than the "no evidence" claim you now indicate was your main point. Further, from the evidence I have shown above, even the "no evidence" claim looks dubious. The strongest warming in China is north of the line in which there have been a substantial increase in anthropogenic aerosols. The weakest warming has been downwind at the surface from the area of major emissions from Beijing down to Shanghai, and around, and downwind of Chengdu, another major area of aerosol emissions. Qualitatively, that is what we would expect of aerosols were a significant negative forcing.
Further, there are good physical reasons to think sulfates, at least are a negative forcing - reasons confirmed by the impact of stratospheric aerosols from volcanoes. An argument to the contrary from Chinese data would need to be very convincing to overturn that data, not to mention data from the US and Europe that indicates the aerosol forcing is negative.
Having said that, there are complexities. The relative composition of emitted aerosols (BC vs NOX vs sulfates) probably varies regionally and by time and will have an impact on the overall forcing. Latitude, closeness to oceans, and ocean fluctuations are also complicating factors. Nor has it escaped my attention that the northern band of strong warming in China more or less coincides with the region where the easterly trade winds (ie, blowing to the west) are replaced by the Westerlies (blowing to the east), and hence represents the area where local ocean influence is minimized and where Chinese temperatures are most impacted by influences over all of Eurasia.
Given these complexities, I seriously doubt a blog scientist will have the resources to disentangle all the issues. They certainly will not if they use a single block grid to represent Chinese temperatures.
-
CBDunkerson at 08:47 AM on 20 May 20142014 SkS Weekly News Roundup #20
"U.S. insurer class action may signal wave of climate-change suits"
Yes! Finally. I have been waiting for climate change related legal action to go mainstream for a long time now. Farmer's is out on a limb with this one, but it is just the first domino to fall. There will be more cases suing for failure to prepare for climate change... and those will in turn result in suits of fossil fuel companies for causing climate change damage... and eventually for knowing about the damage and covering it up.
This is how big tobacco eventually fell and it has always been the only way to truly stop the climate change deniers. Get them in a court of law... where the lies that have served them so well in the press suddenly become the anchor dragging them down.
-
KR at 05:42 AM on 20 May 2014Sense and climate sensitivity – more evidence we're in for a hot future
Klapper - I'm really scratching my head over your last response. Tom Curtis has documented that the larger region warming in China is not correlated with aerosols, rather the contrary (actually less warming in high aerosol areas), and pointed out significant errors in your argument including spatial distribution and erroneous winds. The majority of your assertions and arguments in this regard have been demonstrated to be incorrect, that the data indicates aerosols are in fact a cooling factor.
And yet after all that you end by asserting that your original statement regarding aerosols was correct? I'm sorry to say so, but it appears to be simply an argument by assertion at this point.
-
One Planet Only Forever at 03:26 AM on 20 May 2014Behind The Times - another manufactured climate controversy conspiracy theory
The increased better understanding of the unacceptability of already developed actions that have allowed some people to get undeserved benefits and become wealthy and powerful will always be challenged by those who cannot rationally justify the actions they want to continue to get away with.
Human history is full of examples of attempts to prolong the popularity of unacceptable unjustifiable attitudes and actions. Whenever benefit has been able to be obtained from unacceptable actions and attitudes those who got away with developing wealth and power unacceptably can be expected to fight against losing their undeserved opportunities to get more wealth and power. And they will not care about better understanding how to develop a sustainable better future for all life on this amazing planet. Though that type of development is clearly the only viable future for humanity, it is not in their interest.
Continuing to develop the best understanding of what is going on and striving to fully inform the entire population is the best way to disappoint those who want to benefit from unacceptable unsustainable and harmful actions and attitudes. When better understanding clashes with unacceptable ways of benefiting those who know they are threatened can become fierce and can be expected to be irrational.
Keep up the good fight againstly the fiercely irrational.
-
Klapper at 03:23 AM on 20 May 2014Sense and climate sensitivity – more evidence we're in for a hot future
@Tom Curtis #34:
I think calculating warming rates by 5 degree lat/long boxes is too small. Chriskoz pointed out in #29 that temperature response to forcing is mixed well outside the forcing subareas in this case the Bejing/Shanghai aerosol zone. In any case my zone of 105 to 120, 25 to 45 degrees could be refined to 22.5 to 42.5 and 102.5 to 120 if I can find grid compilers with that resolution. Maybe I will try the RSS or UAH TLT datasets when I get home.
You are right that I ignored some complexities but I got the conversation started. You have addressed a lot of the detail, but my main point remains: there is no evidence for cooling from anthropogenic aerosols in China over the last 30 years.
-
Alpinist at 02:29 AM on 20 May 2014Behind The Times - another manufactured climate controversy conspiracy theory
Look, a squirrel!
There's always another squirrel.
-
wili at 20:48 PM on 19 May 20142014 SkS Weekly News Roundup #20
Awesome. Thanks. He does good stuff. "Scribbler" is of course a pseudonym. Thanks, as always, for all your great work here!
Moderator Response:[JH] You're welcome.
[KC] Name removed per policy.
-
Tom Curtis at 20:05 PM on 19 May 2014Sense and climate sensitivity – more evidence we're in for a hot future
Klapper @33:
1) The map in question is generated from satellite data. Therefore, your claim that it is of surface pollutants only appears highly conjectural. In fact, it looks like a claim asserted to be fact only because your argument collapses if it is false.
Still, if you want to be certain, here is the global spring (MAM) anthropogenic aerosol optical depth averaged over the years 2003-2010:

You will notice:
a) That no red zones(0.4 +) are found north of Liaodong Bay (the northernmost extension of the Yellow Sea), so that the most intensive aerosol effect in China remains south of about 41 degrees north, is well south of your northern limit. Although you cannot see it here, Spring has the most northerly distribution of Chinese aerosols, with no green (0.2->0.3) showing north of Liaodong Bay in Autumn (SON) or Winter (DJF). Summer (JJA) shows more intense aerosol distribution around Beijing, with red intensities across the Yellow Sea, but the northern edge graduates more quickly so that there is less aerosols over north east China than in spring.
b) The area around Chengdu shows as dark red (0.5 +), as it does in all seasons. Chengdu is China's fourth largest city, a major industrial city and 104 degrees east, ie, outside your mapped area. Its pollution effects extend significantly to the west. As it happens, and unlike Beijing, its effect on aerosol optical depth is year round. Beijing's dissipates in autumn and winter bases on satellite observations.
c) The south China coast, which you exclude, shows red intensity. It shows red intensity also in autumn, yellow intensity in winter, but only green in summer. It is thus never has less aerosol concentration than north east China, and for much of the year has as intense an aerosol concentration as Beijing.
All in all, your claims about aerosol concentrations are not born out by the observations, and you have included areas in your field with consistently low anthropogenic contribution to aerosol optical depth, and excluded areas with consistently high anthropogenic contribution to aerosol optical depth.
2) The upper atmosphere winds are more or less the reverse of those in the lower atomsphere. Looking at the map you can see that means polution in China from Hong Kong north to Beijing will be carried primarilly east across Korea and Japan, with only a slight northerly set. Even in spring, with the most extensive northerly component of the aerosol drift, aerosols are largely confined south of a line from Beijing to the north tip of Sakhalin Island. Thus confined, it means only about a third of north east China (close to the border with North Korea) has a significant anthropogenic aerosol effect at any time of year, and for half of the year the effect is negligible.
3) Thoroughly dealt with above and below. Your assertions are, on the information available, simply wrong.
4) I sampled three 5 degree by 5 degree areas, using NCDC land only temperature data from the KNMI explorer. They were:
North West China (80-85 E, 45-50 N) 0.47 +/- 0.18 C/decade
Beijing (115-120 E, 35-40 N) 0.31 +/- 0.09 C/decade
North of Liaodong Bay (120-125 E, 40-45 N) 0.17 +/- 0.16 C/decade.
The strong warming is in the North West, which is not impacted by anthropogenic aerosols. In those areas impacted by anthropogenic aerosols, the warming is much less. Further, the your claim that the norht east is were the strongest warming is to be found is distinctly dubious.
You might reasonably claim the to north easter samples are also coastal, and so should have lower trends. They also may be more strongly effected by ENSO or the PDO. Those, however, are complexities you have simply ignored in your analysis. If you wish to apply them in defense of your claims, you must apply them when making the initial analysis as well, something you have completely failed to do.
-
Klapper at 16:34 PM on 19 May 2014Sense and climate sensitivity – more evidence we're in for a hot future
@Tom Curtis #32:
1. But only at ground level. The forcings occur at all levels of the troposphere. The sources, at least for some elements of anthropogenic aerosols are predonminately in the north of China, not the SE (like coal fired power plants).
2. Sorry my typo. You're correct the prevailing winds are to the NE, which is where the the higher warming rates are.
3. You're confusing me. Let's get back to basics. North of 30N the prevailing winds are to the NE (agreed). The maximum emission areas are the Bejing to Shanghai corridor and slightly SW of that. So the wind blow the upper level pollution to the NE of this area which is coincidently the area of max warming rate for China.
4. OK, land vs. land makes sense. But shouldn't China be cooling or at least warming a lot slower if aerosols are a negative forcing? I checked the BEST dataset for my prescribed geopgraphic window and the warming rate is 0.31 from the Berkeley dataset. Note this is slightly above the global rate, not below, or cooling despite the very high anthropogenic aerosol emissions from China. Chengdu is almost within by capture area and if the prevailing winds are to the NE, then its effects on the warming rate are within my window.
-
Glenn Tamblyn at 13:19 PM on 19 May 201475% of Americans want to see climate change taught in schools, and four more graphs
Joel
The reality is a bit more complex. Yes the ozone hole allows energy to reach the surface rather than be absorbed in the stratosphere. However, because this is happening in just the Antarctic its effect is only modest compared to if the effect were global. Still the same amount of energy absorbed is unchanged, just variations in its location and altitude of absorption.
The ozone hole is having another effect which is counter-intuitive - it is cooling Antarctica.
Antarctica is surrounded by powerful air currents that tend to isolate it from weather systems further north which otherwise can transport heat southwards. This goes under the unfriendly name of the Southern Annular Mode (SAM). One effect of the ozone hole allowing more energy through to low altitude is that it appears to be increasing the speed of the SAM, reinforcing Antarctica's isolation and exerting a cooling effect on the continent. So the increased energy reaching the surface in Antarctica due to the hole is probably outweighed by the reduction in energy reaching Antarctica from lower latitudes due to the increased blockage caused by the SAM.
So, counter-intuitively, the rest of the planet may be warming a fraction faster because Antarctica is warming slower because of the Ozone Hole.
There was a discussion of this a few years ago at RealClimate here.
Moderator Response:[PS] Interesting as this discussion is, it is also very offtopic. Could I suggest that it be taken to a more appropriate thread please? (Maybe this one)
-
chriskoz at 12:38 PM on 19 May 201475% of Americans want to see climate change taught in schools, and four more graphs
[JH & PS],
Tom@5, by using "pernickity" (sic!), he made a typo, adopted by urban slang. Unless he meant to use urban slang here, which is unlikely.
The correct spelling of the term is "pernickety" (brit.) or "persnickety" (amer.)
Australian written language (excluding local slang terms) is very close to British English, always distinct from American.
-
scaddenp at 11:47 AM on 19 May 201475% of Americans want to see climate change taught in schools, and four more graphs
[JH] I think you will find that "persnickity" is North American for the English "pernickity". Check your favourite (English for "favorite") dictionary.
Moderator Response:[JH] What language is spoken by Aussies?
[PS] Apparently the same language as the English given "pernickity" and "favourite" but with terrible vowels. (and a lot of "colloquialisms").
-
Tom Curtis at 09:19 AM on 19 May 201475% of Americans want to see climate change taught in schools, and four more graphs
Joel_Huberman @4, if I was being pernickity I would point out that "climate change" and "global warming" are not strict synonyms, and that the ozone hole is having a significant impact increasing wind speed near Antarctica, which is a type of climate change. Such hair-splitting exactness is, however, inappropriate when "criticizing" public communication where the important thing (and the rare thing in most media) is to get the fundamentals right.
In this case the fundamentals are that stratospheric ozone more likely acts against global warming than advances it. Whether it acts against or in favour of it, the total effect is very small relative to the effect of tropospheric ozone, itself a small effect relative to that of CO2, though comparable to that of methane. Given that, I am not going to quibble about Donald's statement. It accurately reflects the best current knowledge.
With regard to your assessment, "I don't know", while probably an accurate assessment is an assessment of the respondents knowledge, not of the impact of stratospheric ozone. It is a non-response rather than a correct response. Further, "possibly a little bit" is accurate, but "a little bit" is inaccurate on current knowledge. On the other hand, "not at all" is not the same as "slightly negatively" so that it could also be considered technically wrong so if you want to count both statements as "correct", fair enough. That leave 77% of Americans who claim knowledge in error, with 19% of all Americans at least knowing enough to know they are completely uninformed on the topic. Not a good performance, though I have no reason to think my fellow Australians would do any better.
Moderator Response:[JH] Is "pernickity" Australian for "persnickity"?
-
Tom Curtis at 08:57 AM on 19 May 2014Sense and climate sensitivity – more evidence we're in for a hot future
Klapper @31:
1) The image I showed @28 shows the presence and intensity of particulate pollution - not the sources of emission. Adjusting the figure to suite your peculiar views of the prevailing wind direction in China is simply to fudge the data based on prejudice.
2) In any event, the prevailing winds in China, which are to the North East, not the North West, so that even your fudge in based on an error:

Upper tropospheric winds will be opposite in direction to surface winds, ie, blowing to the North East, thereby carrying the pollution over Korea, Japan, and eventually to Alaska.
3) Your latitude and meridionally restricted region leaves out the heavilly polluted southern coast of China, not to mention the heavilly polluted region around Chengdu (which has the lowest temperature increase of any area in China over recent times), but includes a large region of lightly, or unpolluted (and rapidly warming) area north of Beijing, stretching into the Gobi desert and Mongolia. In short, it seems well tailored to misrepresent the relationship between aerosols in and temperature trends in China.
4) You compare the trends found in that area to the global trends which include the low trends over ocean. Warming is much higher over land, so the comparison should be with global land temperature, where the trend is 0.296 +/- 0.08 C/decade (NOAA; 0.288 +/- 0.114 C/decade, BEST) since May 1984. That is, the global land surface temperature trend over the last thirty years is indistinguishable from the trend you find in your cherry picked latitude and meridionally restricted area. Had that area included the region around Chengdu and the south coast of China, and excluded the lightly polluted band north of Beijing, the trend would have been lower than the global land surfact temperature trend.
-
One Planet Only Forever at 02:07 AM on 19 May 20142014 SkS Weekly News Roundup #19B
Correction in my Comment @2, "If the Oil Sands ever are developed it needs to be done without burning up better fossil fuels".
-
One Planet Only Forever at 02:04 AM on 19 May 20142014 SkS Weekly News Roundup #19B
Klapper,
I agree that investors may be able to get away with profiting from Alberta Oil Sands. However, their ability to do so is simply and clearly not acceptable.
The Alberta Oil Sands are probably the most damaging fossil fuel source on the planet. They probably have the highest total impacts per unit of usable energy obtained (Venesuela's oil sands are far less degraded). And their extraction, transportation and processing involve major risks of harm.
Since so much of the already known fossil fuels need to be left unburned, the Alberta Oil Sands really should be left in the ground. Maybe some future generation will have a legitimate emergency need for the resource.
And given the need to limit the impacts of fossil fuel burning it also makes no sense for so much natural gas to be burned up to make heat and electricity for extracting Oil Sands transporting it, and processing it into a useable fuel. If the Oil Sands ever are developed it needs to be done with burning up better fossil fuels.
The fact that the current global socio-economic system encourage things like investing in burning up Oil Sands is clear proof that the current global socio-economic system is fatally flawed. It is not encouraging development toward a sustainable better future for all. It has only ever encouraged the development of ways of getting away with unsustainable and damaging actions because those will always be more profitable if they can be gotten away with.
The facts of the matter are clear. The best understanding of what is going on leads to the conclusion that the global socioeconomic system must be changed.
-
Klapper at 00:11 AM on 19 May 2014Sense and climate sensitivity – more evidence we're in for a hot future
@Glen Tamblyn #30:
I looked at ozone as a proxy for aerial pollution and Bejing and the area west of the Bonsai Sea down to Shanghai seems the highest concentration. NO2 looks to be the same pattern.
The prevailing winds north of 30N would push higher level aerosols to the NW, so towards one of the fastest warming areas of China.
Anyway my calculation on the SAT warming rate of China used a window of 25 to 45N and 105 to 120E so it disincluded the west and NE most parts of China, but did include the major source areas for anthropogenic aerosols. Warming rate within that geographic window is about 0.3C/decade over the last 30 years.
-
Joel_Huberman at 22:37 PM on 18 May 201475% of Americans want to see climate change taught in schools, and four more graphs
Tom Curtis @ 3: Many thanks for your helpful, interesting explanation. I should have thought of referring to the IPCC AR5 report. But the uncertainty in, and low magnitude of, the IPCC's estimate of the stratospheric ozone RF suggest that the "correct" response to the question in the poll (discussed in the article by Ros Donald above) should have been either "a little", "not at all", or "don't know". It's good to see that 39% of Americans responded correctly (in my view) to this tricky question. In other words, I quibble with Donald's statement that 73% responded incorrectly.
-
wili at 21:18 PM on 18 May 20142014 SkS Weekly News Roundup #20
I'm not sure whether in rises to the level of "Weekly News," but robbertscribbler has a nice summary of where we are now sitting wrt El Nino predictions, including an interesting video interview with Kevin Trenberth.
http://robertscribbler.wordpress.com/2014/05/16/deep-ocean-warming-is-coming-back-to-haunt-us-record-warmth-for-2014-likely-as-equatorial-heat-rises/
Trenberth predicts a permanent rise in global temperatures of up to .3 degrees C from the event and from a likely flip in Pacific Decadal Oscilation (PDO) from cool to warm. That would put us well above the 1 C above pre-industrial temperatures mark and on our way to 2.
Moderator Response:[JH] Thanks for bringing Robert Scribbler's excellent post to our attention. I have incorporated it into the OP.
-
Glenn Tamblyn at 19:06 PM on 18 May 2014Sense and climate sensitivity – more evidence we're in for a hot future
An additional point to add wrt pollution in China. A significant part of the 'pollution' around Beijing is dust. Beijing and its surrounds are very prone to dust storms coming in from the Gobi desert.
Further south, towards Nanjing & Shanghai you start to get interactions between pollution and humidity. Lots of 'sfog' - mists and fogs where pollution provides condensation nuclei for water vapour.
-
chriskoz at 16:37 PM on 18 May 2014The passing of a climate giant, Tom Crowley
I honestly haven't heard of Tom Crowley before. However I'm learning now that the ice ages "trigger" theory (that I've attributed to David Archer and his "jumper" model), in fact comes from Tom... The comment@1 by David Karoly confirms my appreciation. We should do better job recognising those people on whose shoulders our science stands. Tom should have his place in the Interacive history of climate science button on the left.
-
chriskoz at 16:09 PM on 18 May 2014Sense and climate sensitivity – more evidence we're in for a hot future
Klapper@27,
In addition to Tom Curtis' response, please note that China is not isolated from the rest of the world. The heat (or negative change in heat in this case resulting from scatering of incoming shortwave radiation) is transported by the atmospheric circulation and can result in warming in other place. Therefore, before you start mounting nitpicky claims from the comparison of Tom's images, e.g. "Beijing area, where the pollution levels are the highest, is actually one of the warmest", you need to at least find the GCM models confirm the Cinese aerosol forcings indeed influence local weather, for your claim to be meaningful.
-
scaddenp at 14:32 PM on 18 May 2014The passing of a climate giant, Tom Crowley
Very sad. His visit to our institute some years ago was very stimulating and I hope other colleagues will be continuing to work with some of his ideas.
-
peter prewett at 14:30 PM on 18 May 20142014 SkS Weekly News Roundup #20
David Suzuki - Suzuki tells Moyers link at the bottom does not work.
Peter
Moderator Response:[DB] Fixed. Thanks to all who helped point this out.
-
Tom Curtis at 12:38 PM on 18 May 201475% of Americans want to see climate change taught in schools, and four more graphs
Joel_Huberman @2, the reduction in stratospheric ozone mostly results in ultraviolet light (shortwave radiation) that would have been absorbed higher in the stratosphere being absorbed lower in the stratosphere, although some does get through to the troposphere. That does indeed have a warming effect. However, it also cools the stratosphere. The stratosphere reradiates the energy absorbed from UV light as IR radiation (longwave radiation). This is mostly reradiated by CO2, H2O and O3 (ozone). Reducing the temperature of the stratosphere by removing O3 also reduces the amount of IR radiation radiated from the stratosphere to the troposphere - a cooling effect. Further, reducing they O3 reduces that radiation directly by reducing the proportion of the atmosophere that can re-radiate the IR radiation downward (also a cooling effect). The question then becomes which of these effects dominates - the warming effect from increased UV, or the cooling effect from reduced IR.
The IPCC AR5 says this:
"The decreases in stratospheric ozone due to anthropogenic emissions of ODSs have a positive RF in the shortwave (increasing the flux into the troposphere) and a negative RF in the longwave. This leaves a residual forcing that is the difference of two larger terms. In the lower stratosphere the longwave effect tends to be larger, whereas in the upper stratosphere the shortwave dominates. Thus whether strat- ospheric ozone depletion has contributed an overall net positive or negative forcing depends on the vertical profile of the change (Forster and Shine, 1997). WMO (2011) assessed the RF from 1979 to 2005 from observed ozone changes (Randel and Wu, 2007) and results from 16 models for the 1970s average to 2004. The observed and modelled mean ozone changes gave RF values of different signs (see Table 8.3). Negative net RFs arise from models with ozone decline in the lower- most stratosphere, particularly at or near the tropopause."
(Chapter 8, section 8.3.3.2)
So by the best judgement of the IPCC, your reasoning is good, but incomplete. The result is that you have probably made a small error. (Probabily because a positive forcing is still within the error bounds.)
Here is the historical forcings for both tropospheric and stratospheric ozones from AR5 (Figure 8.7):

-
Joel_Huberman at 11:47 AM on 18 May 201475% of Americans want to see climate change taught in schools, and four more graphs
I am one of the 73% of Americans who--incorrectly according to this article--think the ozone hole probably contributes at least a small amount to global warming. Here's my reasoning. Stratospheric ozone absorbs ultraviolet light (UL), preventing it from reaching the surface of the Earth. The ozone hole permits more UL to reach the Earth's surface. To balance that increased incoming solar radiation, the Earth's surface temperature would need to increase. So the ozone hole would be expected to increase global warming. Is my reasoning incorrect?
-
Tom Curtis at 07:38 AM on 18 May 2014Sense and climate sensitivity – more evidence we're in for a hot future
Klapper @27, China is a big place. It's air pollution problems are not uniform, and neither are its temperature trends. In fact, the temperature trends are highest in the unindustrialized North of the country:

In contrast, the air pollution (aerosols) are to be found predominantly in the South East of the country, and around Beijing:
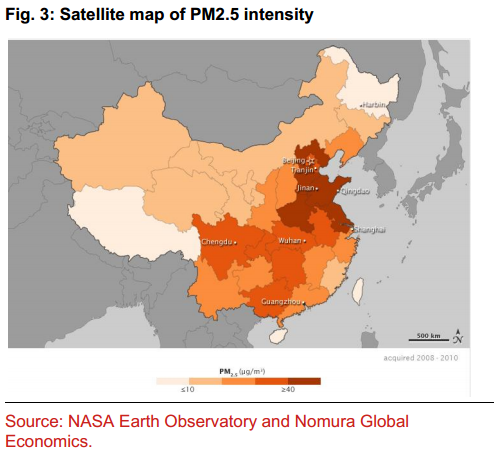
The correlation between lower temperature trends and higher aerosol polution in China is noticable (though not perfect). If you want to mount the argument that China's temperature trends prove aerosol pollution is a positive forcing, you are going to need a far more detailed analysis than merely mentioning national average trends.
-
Klapper at 01:02 AM on 18 May 2014Sense and climate sensitivity – more evidence we're in for a hot future
@Chriskoz #26:
I see my post #26 is missing in action. Your 2nd sentence is only valid if you believe that the net effect of anthropogenic aerosols is negative. Tom's post #11 indicates the range of AR5 estimates for aerosols forcing extends into the positive. As I pointed out in my original post #26, the fact that China has experienced both a faster than global SAT warming rate and extremely high local aerosol forcing is reason to question the "anthropogenic aerosols are a negative forcing" assumption.
Moderator Response:[PS] Not moderating here, but you need to back assertions with evidence/references and skip the pointless remarks (eg pink unicorns) if dont want to be moderated for sloganeering. Try again with backing data.
-
mlyle at 00:50 AM on 18 May 2014The passing of a climate giant, Tom Crowley
All of us in paleoclimate will miss him. I had wondered why had been relatively quiet over the last couple of years.
-
chriskoz at 23:11 PM on 17 May 2014Sense and climate sensitivity – more evidence we're in for a hot future
Klapper@26,
I agree with your general point. Kummer 2014 can be used as a rebuttal to the claim "climate sensitivity from 20th century observations is low", because they showed with very simple math that observational estimates should not assume human aerosol efficacy of 1. We can be quite confident that said efficacy is > 1, therefore the feedback factor lambda becomes smaller, yielding ECS values higher than claimed before. But the uncertainties are so high (if you look at the last column of their Table 1) that talking about a meaningful value of ECS thus obtained is pointless. I do much prefer the methods that accually measure (via proxies in paleo methods) the dT in equilibrium, according to the definition of the term.
-
austrartsua at 14:13 PM on 17 May 2014We're heading into an ice age
How is Figure 4 determined?
(-snip-).
Moderator Response:[DB] Figure 4 is based directly on Figure 3 from Archer 2005.
Sloganeering and arguments from personal incredulity snipped.
-
dkaroly at 13:20 PM on 17 May 2014The passing of a climate giant, Tom Crowley
John and Dana, Thanks for helping people better understand the very important role that Tom played in building links between the palaeoclimate community and the climate modelling and modern climate communities. He was indeed a giant of a scientist, and it is by standing on the shoulders of giants that we can see and influence the future. Tom was also a gentle and welcoming giant, who cooked a mean steak on the barbecue. He will be missed!
-
Tom Curtis at 11:20 AM on 17 May 201497% consensus on human-caused global warming has been disproven
tlitb1 @20, sorry, my computer ate my long response, so you will have to make do with the short.
1) I agree with you about Lai et al (2005), which I would rate as (6) "explicitly rejects but does not quantify".
2) From the full rating data, which has been released by John Cook, it can be determined that there is an initial rating error rate between "endorsement levels" of 12.9% on average, which results in an expected error rate between levels after dispute resolution of 4.7%. Given that distinctions between "implicit" and "explicit" are graduated rather than binary (things can be more, or less explicit) such an error rate is unsurprising. It is also overstated in that it treats a large number of ratings of "0" (= uncertain) as errors, which is not the case.
3) The error rate between endorsing or rejecting AGW falls to a low 0.04%. That is because the vast majority of errors are between categories just one level apart, and because nearly all errors (98%) for initial ratings of (4) involve mistakenly identifying an implicitly endorsing abstract as being neutral. Overall, adjusting for errors based on internal data appears to slightly increase the endorsement percentage. (That is a provisional result using simplifying assumptions. More accurate results may change teh sing of the result but will not significantly change the magnitude which is less than 1%. Note that Richard Tol's claim that this adjustment makes a large increase in the "dissensus rate" depends on the false assumption that the error rate and distribution for all rating values is the same.)
4) Despite the low overall error rates, the sheer number of endorsing abstracts means a small fraction will have been incorrectly rated, ie, should have been rated as rejecting the consensus. On the figures above, we would in fact expect two such abstracts. Those figures show only internally detectable errors, however, so the number may by slightly larger.
5) Because we expect some such errors as a matter of course, no amount of highlighting single abstracts being correctly rated will show the Cook et al results to be false. That is because such anecdotal evidence does not provide a basis for statistical analysis. At most the response required is to adjust the values reported for endorsement and rejection in Cook et al by the number of individual abstracts found to be in error. Thus, you have found two abstracts in error. Therefore we would adjust the Cook et al figures of 3896 endorsing and 78 rejecting to 3894 endorsing and 80 rejecting, which changes the percentages (as a percentage of papers endorsing or rejecting) to 97.99% endorsing, down from 98.04%. Even that ignores the probable existence of papers with errors in the other direction, and makes no difference worth mentioning. Even if you were to find a net error of 100 abstracts in favour of endorsement, after correction you still have an endorsement rate of 95.52%, which again is not a challenge to the Cook et al result.
6) Because of this, the only valid method to challenge Cook et al is to do another survey yourself, of at least 2000 abstracts (and prefferably more). Make sure you state your classification criterion clearly. You will find either a result within 5% of the Cook et al value, or your classification criteria will be transparently tendentious.
-
Tom Curtis at 10:41 AM on 17 May 2014Climate's changed before
wcgulick @410, I'm sorry, you are simply boring and arrogant. Arrogant because you assume that because you certainly do not know something, scientists do not know it either. Boring because your position if adopted consistently would cause you to reject all science, not merely climate science. There is no scientific subject about which we know everything. Never-the-less there are many scientific subjects about which we know much, including climate science. I am more than willing to work through the details of climate science with those who are willing to discuss it rationally. I am, however, totally disinclined to waste time discussing it with those who hold their ignorance to them as a shield against learning.
-
wcgulick at 09:25 AM on 17 May 2014Climate's changed before
Tom Curtis @ 409:
What I mean is that I still see serious problems with "stating as a fact" that the planet is warming due to human activity.
To wit:
The people doing this reseach are working with an incomplete data set. This is the largest kinetics problem anyone has ever tried to solve and it's not solveable unless you know the inputs and outputs of the overall system, which we don't.
Related to this problem is a second one, where people are making a series of assumptions based on said incomplete data set. The real cold (no pun intended), hard truth is that no one really knows if things like water vapor in the atmosphere, which is present at levels orders of magnitude greater than carbon dioxide, create a positive or negative feedback loop or any feedback loop at all. It could produce a slow (or rapid) occilation. As I said, no one knows.
On top of that, with a system as complex as the climate, data on prior occurances is not necessarily predicitive of future occurances. Simply put, we don't know exactly what was happening to all inputs and outputs when this occured.
On top of that there is no way that anyone can argue in a situation like this that the researchers don't bring their own biases to their research. This isn't something you can prove or disprove rapidly in a chemistry lab, in fact there are no experiments being done at all (so it's not science, it's research). Therefore, unlike real hard science where experiments can prove or disprove a hypthoisis, we have no way of controlling for biases that may be introduced by the researchers themselves.
Long story short, my real issue here is that the data set is incomplete and there is absoultely no way to know how all of the variables (including researcher bias) are acting at any given time in the past. Therefore, any conclusions we draw from the data are, IMHO, unreliable at best.
Moderator Response:[TD] You need to post comments on relevant threads. You must read the original post for the relevant thread, and if you comment, address that original post. Many posts have Basic, Intermediate, and Advanced tabbed panes; read all three before commenting.
For your "incomplete data" claim, see "Are Surface Temperature Records Reliable," among other posts.
For water vapor, see "Explaining How the Water Vapor Greenhouse Effect Works."
Projecting future climate is not done merely by extrapolating from past trends; climate models are physical models, not statistical ones. In any case, the proof is in the pudding. See "How Reliable Are Climate Models?" That same post addresses your incorrect and inappropriate claim that researchers' biases cannot be controlled; the empirical data have and continue to validate the theoretical projections that have been made for over 150 years.
All your claims are incorrect. You are most welcome to make claims on Skeptical Science as long as you do so on the relevant threads, as long as you specifically address the original posts of those threads, and you respond to other commenters with specific data rather than merely your opinions.
-
tlitb1 at 08:39 AM on 17 May 201497% consensus on human-caused global warming has been disproven
@Tom Curtis at 16:39 PM on 15 May, 2014
I'm glad you agree with me about the Shaviv assessement. My attention was only drawn to Shaviv because I had just for the first time read the Schulte paper, which itemises 6 papers (including Shaviv) as examples rejecting the consensus, and I picked Shaviv to compare first.
I've now had a look at the remaining 5 papers picked out by Schulte as rejecting the consensus - with an aim to see how they stack up against Cook et al. - and found: 2 dont appear in Cook et al, 2 agree, and I think have found one other paper, Lai et al. (2005), which Cook et al rates as supporting the consensus but seems actually to be rejecting it. IMO the abstract certainly is not clearly stating a position on anthropogenic contribution being >50%
Global warming and the mining of oceanic methane hydrate Chung-Chieng A. Lai, David E. Dietrich, Malcolm J. Bowman
http://www.skepticalscience.com/tcp.php?t=search&s=&a=dietrich&c=&e=&yf=&yt
If you look at the abstract I think you will see there is nothing that puts it in the consensus. If I am wrong I would love to know what I missed. In fact I think these two statements alone
"However, the extent to which anthropogenic factors are the main cause of global warming is still being debated."
and
"we propose a new hypothesis for global warming."
by rights should be enough to define this abstract as *not* being in the consensus.
I think the statement "we propose a new hypothesis for global warming" is as near enough to saying 'this paper is not in the consensus' as you can get! ;)
The Shaviv paper just happens to be one of the demonstrably small number of mistakes in classification in Cook et al. It is silly to think that a project like the Consensus Project would be mistake free.
I certainly wouldn't expect Cook et al to be mistake free but I have to say finding a disagreement between 2 of the 4 overlapping examples here in the Schulte paper, a paper which Cook et al itself draws attention to, is quite interesting; interesting because I think the two examples also indicate an insight as to why they were mis-rated, and why more papers could be too.
I think the mis-rating of Lai et al. (2005) could be explained if the raters were slavishly only looking for quantification, and not really parsing any deeper, then at a push I could see it being put in the neutral category, however its being rated in the endorse category still seems wrong.
And again with Shaviv, there is some dispute about the 'wording' indicated in the article above, as if it wasn't playing by the rules, i.e. as Dana Nuccitelli implies above, "he worded the text in a way to slip it past the journal reviewers and editors" . But surely if Shaviv did not lie in his abstract, no matter how it was 'worded' , Cook et al's methodology should have been robust to correctly rate it?
It clearly seems not in this case, could that have happened in more cases?
-
Tom Curtis at 08:18 AM on 17 May 2014Climate's changed before
wcgulick @408, we can hardly help you with so vague a criticism. I suggest that you start reading the basics, eg, here or here, and raise any specific concerns you have with that aspect the theory on those pages. If you have no concerns at that level, we can then move on to other relevant pages and discuss them there.
-
Tom Curtis at 08:12 AM on 17 May 2014CO2 limits will hurt the poor
Have the moderators taken a holiday?
On this thread cool breeze has continuously violated the rule against sloganeering, and by now must surely also be violating the rule against excessive repetition. He is patently simply a troll, interested only in getting his views published and having no regard to either evidence or rebutal.
Meanwhile on the "water vapour" thread, Arthur is making repeated accusations of malpractise without any basis.
Moderator Response:[DB] There are no holidays for moderators. Life, however, does impede sometimes. Moderation implemented.
-
wcgulick at 08:10 AM on 17 May 2014Climate's changed before
Interesting website. A lot more data that most sites which just say something and offer no evidence to back it up.
That said, I'm still somewhat skeptical of the overarching theory.
Moderator Response:[TD] Your comment violates the Skeptical Science comment policy, by being devoid of substance and therefore being sloganeering. Future content-free comments will be deleted without warning. Please carefully read the original post above this comment thread, and if you want to complain about lack of evidence, then describe specifically what of that evidence in that post you believe is inadequate, and why.
-
scaddenp at 07:14 AM on 17 May 2014CO2 limits will hurt the poor
Coolbreeze, ignoring the flippancy, I think there is an important principle missing. If your farming stuffs a waterway, then it is local in effect. Your nation makes the mess, it has to deal with the consequences.
The negatives of CO2 emissions however are global. The idea that is it okay for one group of people to enjoy all the benefits of something while another group of people pay the price is I would suggest a rather "unAmerican" attitude? In particular the rich countries are getting to enjoy the benefits you point out of cheap FF while non-emitters in very poor countries pay a disproportiate amount of price through the effects of climate change.
It largely comes down to problem that what you pay for FF does not reflect the actual full cost of using it. Its cheapness leads to poor usage of the resource and false pricing compared to other forms of generation.
Substition is possible. So is using less. Average energy use for USA is 250kWh per person per day. Europe and Japan are around 120 while here in NZ it is 90. I strongly suspect that US citizens could lead rich, useful and meaningful lives with rather less energy use.
-
grindupBaker at 07:08 AM on 17 May 2014We can't count on plants to slow down global warming
"Rising CO2 levels threaten human nutrition, study says" CBC News. "Iron and zinc levels were found to be much lower in some vital crops grown under future carbon dioxide scenarios". I've forgottern whether I only heard this on CBC or whether I also read it here on some post and I'm just repeating it back to you. Crops for nutrition and sequestering of carbon in vegetation are distinct topics of course, but somewhat related. I'd never thought of this nutritional content aspect.
-
grindupBaker at 04:54 AM on 17 May 201475% of Americans want to see climate change taught in schools, and four more graphs
2. "The sun" should have been asked as "Changes in the sun". Otherwise it looks interesting about what Americans think about this science topic, especially surprising that American-type humans think anything about petrol. I'm testing that when I cross the border this summer weekends.
-
Composer99 at 03:18 AM on 17 May 2014CO2 limits will hurt the poor
Coolbreeze:
even when the IPCC reminds us that the global temperature has warmed a whopping 0.85 degrees celsius in a span of over 140 [130/whatever] years.
I must say that this kind of comment is one of my pet peeves. Small changes in global mean temperature have large, far-reaching consequences. I do not feel this is a terribly difficult concept to grasp.
I mean, it's only a 4-6°C drop from now to the depths of the last glacial period. You'd hardly notice that change in an afternoon, but in terms of global mean temperature it's the difference between what we have now and mile-high ice sheets covering large portions of the northern hemisphere.
So I strongly encourage you to look at the evidence of current impacts (e.g. impacts as described in IPCC WG2, US National Climate Assessment, etc.), rather than apparently dismissing global mean temperature changes to date just because the number looks small.
Like pretty much anyone alive, I will gladly choose some climate impacts over starvation
As far as I can see, one of the things that others have been trying to get at in this thread is that, owing to chronic reductions in crop yield, acute crises from droughts or flooding, and (in the case of ocean acidification) reduced productivity of ocean biomes exploited for food sources, starvation is a potential (if not yet 100% certain) climate impact, especially in tropical/subtropical regions.
Prev 718 719 720 721 722 723 724 725 726 727 728 729 730 731 732 733 Next


