


 Arguments


Recent Comments
Prev 721 722 723 724 725 726 727 728 729 730 731 732 733 734 735 736 Next
Comments 36401 to 36450:
-
Brian Purdue at 15:02 PM on 13 May 201497% - A Statistically Representative Debate On Global Warming
Comedy is a great messenger – well done indeed John Oliver.
-
Tom Curtis at 14:41 PM on 13 May 2014Sense and climate sensitivity – more evidence we're in for a hot future
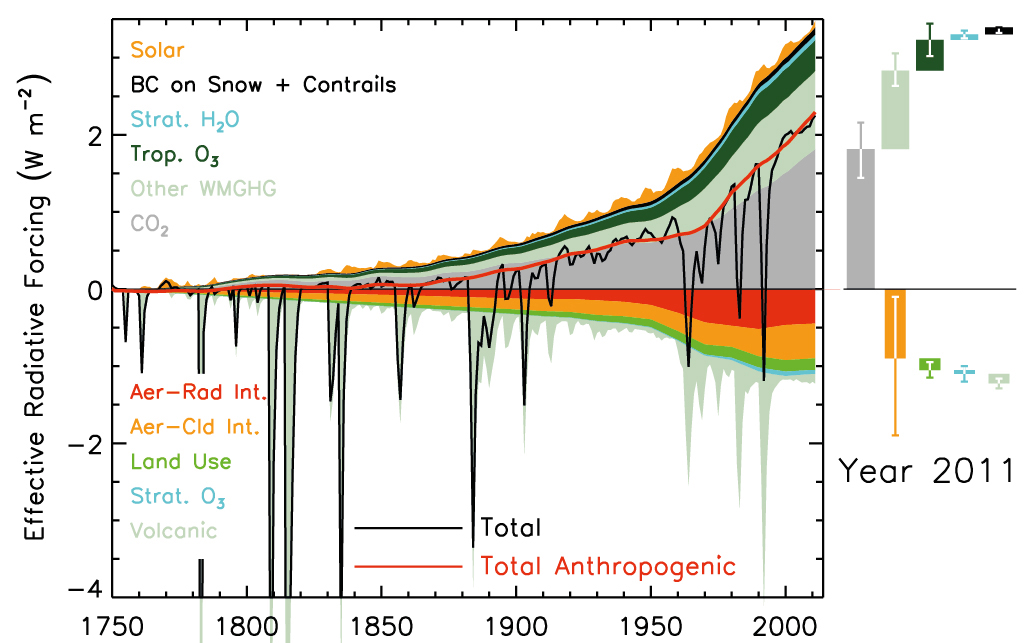
BC, I don't see how that implication follows from the OP. If you look at the first image in my post @7, you will sea the aerosol forcing has the largest error range. Indeed, from table 8.6 we find that while the mean estimate of aerosol radiation interactions has declined from -0.5 to -0.35 W/m^2 from AR4 toAR5, the uncertainty has risen from a 0.8 W/m^2 ranged (-0.1 to -0.9) to a 1.0 W/m^2 range (0.15 to -0.85) so that overall uncertainty is greater.
The key point on which the OP is based is not the uncertainty of the aerosol forcing, but the fact that the aersol forcing is regionally localized, specificly around areas of significant industrialization (Europe, North Eastern US, China). That, combined with the fact that the NH responds more rapidly to forcings simply by virtue of its large land mass (and consequently less thermal inertia provided by the large oceans of the SH) implies that there will be a larger response to a given aerosol forcing than to an equal GHG forcing, given that GHG forcings are globally homogenous.
-
Tom Curtis at 14:25 PM on 13 May 2014Sense and climate sensitivity – more evidence we're in for a hot future
The following comment was made by BC, and accidentally deleted:
"James Hansen made much in his book 'Storms of My Grandchildren' about our lack of understanding of the forcings caused by aerosols due to a lack of funding for a satellite to measure their impact. And when Glory was eventually sent up there was a launch failure. This posting seems to imply that we don't have a problem with estimating aerosol forcings any more?"
Sorry for any inconvenience.
-
One Planet Only Forever at 13:59 PM on 13 May 2014Sense and climate sensitivity – more evidence we're in for a hot future
I meant to end my previous comment with the importance of remaining focused on the scientific best understanding of the temperature increase that should be a concern (1.5 C), especially when referring to the potentially ever increasing "political popularity target".
As global leaders reset their "targets" out of "pragmatic expediency" balancing popular support for unacceptable actions against common well understood decency, there needs to be constant reminders of how much further they are from acceptable impacts of one group of people, the most fortunate at a point in time, on all others, especially on future generations (no group should be able to excuse getting benefit from the creation of negative consequences for others).
Even the IPCC reports regarding mitigation make the fatally flawed claim that discounting future costs is a legitimate methodolgy for evaluating acceptability of a lack of concern about future impacts that another group of people will face. That is deemed excusable because, of course, the economy will always grow, in spite of the fact that the only rational way for the economy to sustainably grow is for that growth to exclusively be in activities that are sustainable and not damaging to the future, meaning any perceived beneficial economic growth through increased burning of fossil fuels is a lie deliberately created by uncaring people.
-
One Planet Only Forever at 11:08 AM on 13 May 2014Sense and climate sensitivity – more evidence we're in for a hot future
It is important to remember that a 1.5 degree C rise of global average above the pre-industrial level is still the threshhold of concern regarding signficant difficult to predict and difficult to adapt to climate change consequences.
The change to a 2 degree target occurred in the 2009 Copenhagen meetings. That was when it was admitted that the 1.5 degree target was no longer achievable because of the lack of reduction of pursuit of benefit from burning fossil fuels, primarily by the most fortunate who refused to participate in leading toward a sustainable better future for humanity (less reliant on the ultimately unsustainable burning of fossil fuels).
The continued deliberate lack of concern by many of the most fortunate for anything other than their personal potential benefit, including their deliberate desire and efforts to discredit the best understanding of what is going on, is likely to make 2.5 degrees the target discussed in 2015, then 3.5 in 2020, then 4.5 if anyone even bothers to care after that.
-
Tom Curtis at 10:39 AM on 13 May 2014Sense and climate sensitivity – more evidence we're in for a hot future
JoeK @2 and @5:
First, Kummer and Shindler are simply wrong in saying the forcing data is referenced to the late 19th century.
Second, here is the forcing data over time from AR5 (Fig 8.18):
And here is the temperature data over time, also from AR5 (Fig 2.14):

It is very clear that there is a large negative forcing over the period 1880-1900, primarily due to volcanoes, and in particular the Krakatoa erruption of 1883. It is also clear that the associated temperature excursion is nowhere near as large in relative terms. That is because of the thermal inertia of the oceans, which prevents temperatures from fully following large but short term forcing excursions.
One immediate consequence of that difference is that the energy imbalance at the TOA durring the period of 1880-1900 was reversed in sign relative to the average over the twentieth century. To estimate climate sensitivity starting from the base period of 1880-1900 you need a reasonably accurate estimate of that energy imbalance, which we do not have. To estimate it from the forcing and temperature data, you would need to know the climate sensitivity, which is what you are trying to estimate in the first place.
Rather than do that, you could take a simple fudge factor that approximates to a 0 W/m^2 forcing at the time by reducing the forcing excursion to match qualitatively the temperature excursion. It is very clear that such a fudge factor would reduce the forcing estimate below the underlying trend estimate, but that it would be far closer to zero than the simple average of the forcing as used by Nic Lewis.
I think there are better ways around this problem, but Kummer and Dessler's "solution", however accidental, is plainly superior to Lewis's solution. I doubt it is 100% accurate but the error may be in favour of a lower climate sensitivity, although it is more likely a small error in favour of a higher climate sensitivity.
-
Dean at 09:28 AM on 13 May 2014Sense and climate sensitivity – more evidence we're in for a hot future
Nice article, though I miss some analysis of the carbon cycle feedback and how much of an effect this will have. You recently wrote about the vegetational response. But there is also the transient uptake by the ocean and of course the melting permafrost issues.
"...that gives us a best estimate of about 5°C warming above pre-industrial temperatures by 2100..." Does this take into account carbon cycle feedback or does it implicitely assume it is zero?
-
StElias at 08:29 AM on 13 May 2014Antarctica is gaining ice
"Two papers scheduled for publication this week, in the journals Science and Geophysical Research Letters, attempt to make sense of an accelerated flow of glaciers seen in parts of West Antarctica in recent decades."
"The collapse of large parts of the ice sheet in West Antarctica appears to have begun and is almost certainly unstoppable, with global warming accelerating the pace of the disintegration, two groups of scientists reported Monday."
"The new finding appears to be the fulfillment of a prediction made in 1978 by an eminent glaciologist, John H. Mercer of the Ohio State University. He outlined the uniquely vulnerable nature of the West Antarctic ice sheet and warned that the rapid human release of greenhouse gases posed “a threat of disaster.” He was assailed at the time, but in recent years scientists have been watching with growing concern as events have unfolded in much the way Dr. Mercer predicted. (He died in 1987.)"
Moderator Response:Fixed link
-
JoeK at 07:52 AM on 13 May 2014Sense and climate sensitivity – more evidence we're in for a hot future
Really, I don't want to fill up this thread with irrelevancies, and the moderators should feel free to remove this comment if it's just a distraction, but I don't find michael sweet and ubrew12's responses very helpful.
michael sweet refers me to Drew Shindell's Realclimate post, which I was already familiar with. He states
it seems to me that if Lewis has a real point he would be more effective taking it to Real Climate where people are qualified to review it.
The Shindell paper is not the same as the Kummer and Dessler paper. The Realclimate thread addresses the Shindell paper. This thread is about the Kummer and Dessler paper.
Leaving aside advice for Lewis, what should I do if I want to find an answer? Is sweet saying that Skeptical Science is not an appropriate venue for this question (and that Realclimate is)? It seemed to me that it would be somewhat more appropriate for Skeptical Science but if others agree not then I will take it elsewhere.
sweet continues
Most of the comments at Bishop Hill were of the "Dessler used a model so it must be wrong" type. The OP at Bishop Hill disparages Dressler's paper based on a review of the abstract. It has no substantiative analysis or data.
which may be true, but it doesn't help me. In fact, that was one reason I didn't persist in trying to get an answer there and came over here.
ubrew12 also refers me to Shindell's post, pointing out that one can use either a 1750 or an 1880 reference, which may be true. But Nic Lewis is claiming that Kummer and Dessler mixed two legimate options in an illegitimate way - using one reference for temperature and another for forcing. An initial check showed a prima facie contradiction in Kummer and Dessler. I thought someone here may be able to offer a quick clarification.
-
ubrew12 at 07:15 AM on 13 May 2014Sense and climate sensitivity – more evidence we're in for a hot future
JoeK @2: the answer may be in the comment stream of your link. 'John L' in that stream points to a similar argument made against Shindell's paper and links to Shindell's Realclimate response. To quote: "Lewis’ claim that the my TCR results are mistaken because they did not account for 1750-1850 aerosol forcing is incorrect because he fails to use consistent time periods for all forcing agents." You can use either reference, 1750 or 1880. As long as the reference is applied equally (to GHG as well as aerosol) the calculation yields the same result.
-
michael sweet at 07:13 AM on 13 May 2014Sense and climate sensitivity – more evidence we're in for a hot future
JoeK,
Reading to the end of the comments at Bishop Hill, another commenter states that Shindal's post at Real Climate (linked at Bishop Hill) addresses Nic Lewis complaints. I cannot review the matter, but it seems to me that if Lewis has a real point he would be more effective taking it to Real Climate where people are qualified to review it. Most of the comments at Bishop Hill were of the "Dessler used a model so it must be wrong" type. The OP at Bishop Hill disparages Dressler's paper based on a review of the abstract. It has no substantiative analysis or data.
-
JoeK at 05:32 AM on 13 May 2014Sense and climate sensitivity – more evidence we're in for a hot future
Nic Lewis makes the following claim at Bishop Hill:
Kummer & Dessler seem to have performed their basic calculations improperly.
They claim that the AR5 forcing time series are referenced to the late 19th century, and therefore deduct from the temperature time series the 1880-1900 average temperature. But the AR5 forcing time series are, as stated in Table 8.6 (which they cite), referenced to 1750. They should therefore have likewise deducted the 1880-1900 average forcing from the forcing time series.
(Not sure how to link to the exact comment, but you can search for "Nic Lewis".)
I was able to check:
- Kummer and Dessler do cite Table 8.6 of AR5
- Table 8.6 is referenced to 1750 (source)
- Kummer and Dessler state:The forcing time series is referenced to the late- 19th century, which means that the temperature anomaly time series must also be referenced to that same time. To do this, we offset each time series so that the 1880-1900 average is zero.
It would be useful to get clarification on whether this is a genuine error, and if so how much it matters.
-
Dikran Marsupial at 04:31 AM on 13 May 2014It's cooling
I will respond to jetfuel's most recent post tomorrow, after JH has had a chance to review it, as requested.
Moderator Response:[JH] Thank you.
jetfuel's most recent post violated three SkS comment restrictions, i.e., no sloganeering, no excessive repetition, and no moderation complaints. His comment was therefore zapped.
-
Rob Honeycutt at 03:36 AM on 13 May 2014CO2 is not a pollutant
fake progress @27... I believe they would be the same thing.
-
Jose_X at 02:19 AM on 13 May 2014Answers to the top ten global warming 'skeptic' arguments
Skeptical101, a recap to some responses above: ... so short trends are currently deemed very unpredictable and the modellers know this. They aim at the more predictable long-term trends (even in hindcasting), where internal variability tends to wash out. As evidence, if you add in the internal variability details to past forcasts (volcanoes, ENSO, PDO, etc), you get decent short-term results. We also note that currently all analyses/studies of the models necessarily are in the short term range, making easy to create strawman arguments (eg, since models don't claim to be accurate short-term) especially those arguments that also ignore the law of large numbers. And Spencer and others further push their "luck" by cherry-picking years like '98 and by ignoring the best (BEST) data sets to focus on rose-colored data sets.
-
wili at 02:13 AM on 13 May 2014Sense and climate sensitivity – more evidence we're in for a hot future
Right after the Hansen quote, you have: "Shindell found that correcting for this faulty assumption in brought the 'instrumental' climate sensitivity estimates much higher in the models he looked at."
Drop the "in" or add something after it. Also, it would help me, at least, if you added a parenthetical clarification right after 'faulty assumption' to state clearly exactly what the nature of the faulty claim is.
Check the original of the Dessler quote. In the third sentence that starts "What we show our paper is that..." is there an "in" after show? If so, put it back in. If not, put it in [square brackets].
(In general, if you would like another pair of eyes to proof papers before posting, feel free to contact me. I'm not perfect--especially at proofing my own work--but I kind of do this kind of thing for a living.)
Great article, by the way.
-
fake progress at 02:13 AM on 13 May 2014CO2 is not a pollutant
I need a link to EPA's listing of CO2 as an air pollutant. This blog states "...the US Environmental Protection Agency (EPA) Administrator must publish a list of certain air pollutants....Greenhouse gases including CO2 unquestionably fit the Clean Air Act's broad definition of air pollutants and must be listed and regulated by the EPA if it can be determined that they endanger public heath and/or welfare." However, I cannot find an EPA list of air pollutants that includes CO2, and the links in this blog don't help. They lead to an EPA Endangerment Finding but not a statement that CO2 is an air pollutant. Or is that the same thing? I appreciate it.
-
John Hartz at 22:29 PM on 12 May 2014It's cooling
All: Please do not immediately respond to jetfuel's next post. I would like to review it and determine whether or not it constitutes sloganeering and/or excessive repetition. If it does, the comment will be deleted.
-
John Hartz at 22:24 PM on 12 May 2014It's cooling
All: A friendly reminder — Dogpilling is prohibited by the SkS Comments Policy.
-
MA Rodger at 20:02 PM on 12 May 2014It's cooling
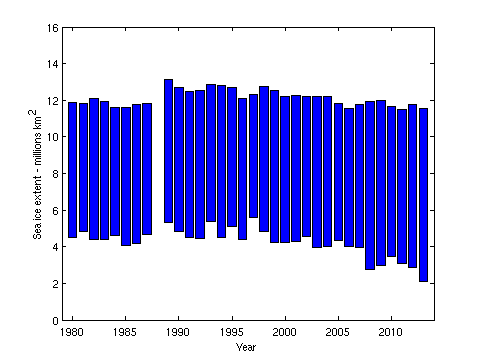
I thinkthis graph well illustrates the point that all this blather about "record freeze" is away with the fairies.
The black line is the increase in Arctic SIE from minimum to maximum. The blue line is the March SIE displaced for reasons of comparison. It is very evident this maximum has no significant bearing on the black trace. And it is evident from the red trace that the minimum, the outcome of the previous melt season, has everything to do with it.
I hope I didn't make it more complicated than kerosene.

-
Klapper at 19:46 PM on 12 May 20142014 SkS Weekly News Roundup #19B
Re: Oil Sands risky investment
This is not true in the geopolitical sense. Consider the belligerence of Russia, the nuclearization of Iran, and the volatile nature of middle east politics as evidenced by the events in Egypt, Libya and Syria. Or for that matter, the disintegration of the social structure in Venezuela.
Investment in the Canadian oil sands is by comparison very low risk. And the Keystone Pipeline will be built, if not under Obama, then the next president.
-
Dikran Marsupial at 18:55 PM on 12 May 2014It's cooling
Jetfuel wrote "Dikran, I looked at the NH min sea ice trend you predict.It looks like a good fit, but 2013 (not incl) bounced back to the very upper limit of grey shaded area (@5.1M) and 2014 will have to be less than 5.1M min for the 95% CI to continue to match."
That was not the result to which I directed your attention, as I suspect you are fully aware. I was directing your attention to the fact that sea ice extent is decreasing more slowly in March than it is in September, which explains why we expect the annual increase to be increasing. The reason I showed the graph that I did in my previous message was you make sure you knew what part of the post was relevant. In disregarding this, you have given a strong impression that you are not interested in the truth and are just trolling.
"Your graph ends with 2012. The 2012-2013 recovery reasonably matches the largest of any shown, that of 1997-8. Looks like 2032 is the min=0 prediction without 2013 data included. I presume this chart will be redone if Sept 2014 min exceeds 5.1M?"
Again you are just avoiding acknowledging that an increasing recovery is exactly what we would expect, i.e. you are trolling.
See Toms' excellent post for a further illustration of this.
Do you accept that we should expect an increasing trend in the recovery from the September minimum to the March maximum. Please give a straight answer, yes or no.
-
scaddenp at 14:04 PM on 12 May 2014It's cooling
Another way to think about this - imagine what happens when the artic is ice-free in summer. The "recovery" in winter is even larger - because the oceans will have to warm a great deal before a sunless sea will not develop a layer of thin ice on top. But this is not "recovery". Recovery is when there is more ice at a particular time of the year than at the same time in other years.
-
DSL at 13:11 PM on 12 May 2014It's cooling
jetfuel, another thing to keep in mind is that the Arctic is largely land-bound. Sea ice growth is limited by land. Summer ice is free to drop according to climate (troposphere/surface/ocean) conditions. Winter ice is free to grow southward only up to a certain point. If winter growth were unfettered, the winter max would be much larger, especially earlier in the record, and the negative trend would be much steeper.
-
Stephen Baines at 13:09 PM on 12 May 2014It's cooling
jetfuel
I'd like to add that in all your interactions so far, you've tried to find ways to make the data say what you appear to want it to say, rather than engaging in an honest give and take about what the data actually says. This is a one way street at present, with commenters here providing helpful context, and you, so far, largely ignoring them to push your predeteremined interpretation.
Look, no one (and I really mean nobody) I know is happy about what these data imply, but the tale they tell is very straightforward. Arctic sea ice is melting, as we would expect giving warming sea and air temperatures. It's just not that complicated. If you have to do intellectual summersaults to say otherwise, that is a giveaway that you are arguing a losing case.
BTW...I meant DM in the previous post...not DK.
-
Stephen Baines at 12:51 PM on 12 May 2014It's cooling
Jetfuel
"Was this ever exceeded before?"
No...and by saying that you are essentially agreeing with the point that Tom and DK are making. Let's make sure this is clear. Summer sea ice minima and winter sea maxima in the Arctic are both declining. Because the decline in summer ice minuma has been faster than the decline in winter sea ice maxima, a record low summer minimum is very likely to show a record seasonal increase in sea ice extent. Rather than suggesting that sea ice is recovering, the large seasonal increase means that more and more of the ice at the start of spring melting season tends to be thinner first year ice, which tends to melt more readily the following summer, contributing to larger seasonal variation.
"...a last 11 year trend line with a positive slope for maximums."
Why 11 years? Why not 20? Or maybe the whole length of the data set? Can you show that the trend of the last 11 years is statistically different than the entire record?Before you try, I'd point out that the 2014 arctic sea ice maximum in the NSIDC graph presented by Tom falls almost exactly on the long term trend line.
-
Composer99 at 12:40 PM on 12 May 2014It's cooling
I added in sept 2013 and sept 2014
... wait, what?
-
jetfuel at 11:51 AM on 12 May 2014It's cooling
TC, in #235, The trendline looks OK. .0447M km2 per year shown as straightline decline of maximums and so an 11.675 M increase in one seasonal swing 2012-13 is 261 times the .0447M/yr decreasing trend. I added in sept 2013 and sept 2014 since they are now on the books and could draw a last 11 year trend line with a positive slope for maximums.
How I get 11.675M for sept 2012 to Mar 2013: Was this ever exceeded before?

-
Tom Curtis at 10:20 AM on 12 May 2014It's cooling
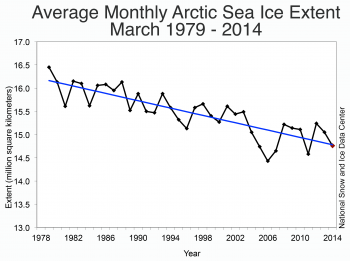
jetfuel @236, here are the relevant figures taken from the NISDC, and converting the percentage trends given by the NISDC to trends in area for ease of comparison:
March 1981-2010 mean Sea Ice Extent (SIE): 15.53 million km^2
March SIE trend: -0.404 million km^2/decade
September 1981-2010 mean SIE: 6.52 million km^2
September SIE trend: -0.893 million km^2/decade
1981-2010 mean SIE recovery: 9.01 million km^2
SIE recovery trend: +0.489 million km^2/decade
From this it is easy to sea that we expect the 2013-2014 to be one of the largest known based on comparative trends alone. We expect 2012-2013 to be the largest, or very close to the largest known, because the September 2012 sea ice extent was the lowest ever known and March sea ice extents do not decline as fast as September sea ice exents.
You are, to put it bluntly, trying to convert evidence that both summer and winter sea ice extents are declining, but the winter sea ice extent is declining slower into evidence that the sea ice extent is recovering (ie, growing larger). You now have all the relevant facts before you in a very clear fashion. Persistence in your obsession on this point will merely prove you to be an utter fool, or dishonest. Consequently if you fail to respond acknowledging this point, I will strongly recommend to the moderators that you be barred from SkS on the grounds of persistent sloganeering.
-
Tom Curtis at 09:45 AM on 12 May 2014Global warming theory isn't falsifiable
Dikran Marsupial @64, here is the latest model/observation comparison from Real Climate for September SIE:

Looking closely we see one or possibly two values below two StDevs of the multi model mean. We see a further six (seven counting 2013 more than one but less than two StDev from the multi model mean. Given 34 observations (35 including 2013), that yields a p-value well above 0.05 even though the p-value for one (possibly two) observations by itself is less than 0.05. If the observations were randomly clustered, therefore, the models would not yet have been falsified. That is because, as you well know, the probabiliy of a particular event occuring increases with the number of trials.
Of course, the events are not randomly clustered. They show a distinct trend, and an analysis of trends may show that with regard to trends the observations have a p value less than 0.05 relative to distribution of the models. Unfortunately, I don't know that as I have not seen that analysis. If it is, by convention the sea ice modules for C-MIP3 might be considered falsified. Of course, as you know, the standard that data with a p value less than 0.05 falsifies a model is a fairly arbitrary convention.
My point, however, is that the potential falsification of the sea ice models does not equate to a falsification of O-A General Circulation Models of which they are components. For the GCMs, the sea ice modules are just one component. Because the models have statistical output, a p value less than 0.05 for one module does not mean a p value less than 0.05 for the total output of the GCM - and it is only the latter that would falsify the GCM (even under the standard convention). That is because even if the models were entirely correct, over a number of predicted observations, some would be expected to have p values less than 0.05 just by chance.
As an aside, at Real Climate, Gavin wrote:
"Sea ice changes this year were again very dramatic, with the Arctic September minimum destroying the previous records in all the data products. Updating the Stroeve et al. (2007)(pdf) analysis (courtesy of Marika Holland) using the NSIDC data we can see that the Arctic continues to melt faster than any of the AR4/CMIP3 models predicted. This is no longer so true for the CMIP5 models, but those comparisons will need to wait for another day (Stroeve et al, 2012)."
(My emphasis)
Consulting Fig 9.24 in AR5 WG1 Ch9, we see that the models are not falsified with regard to Sept sea ice extent (which is not the same as saying they perform well). Apparently, however, they now have a problem with Arctic winter sea ice extent.
-
jetfuel at 09:38 AM on 12 May 2014It's cooling
Dikran, I looked at the NH min sea ice trend you predict. It looks like a good fit, but 2013 (not incl) bounced back to the very upper limit of grey shaded area (@5.1M) and 2014 will have to be less than 5.1M min for the 95% CI to continue to match. Your graph ends with 2012. The 2012-2013 recovery reasonably matches the largest of any shown, that of 1997-8. Looks like 2032 is the min=0 prediction without 2013 data included. I presume this chart will be redone if Sept 2014 min exceeds 5.1M?
-
Tom Curtis at 08:58 AM on 12 May 2014It's cooling
DM @234, the graph you show shows almost no trend for sea ice extent maximum. It also shows sea ice extent maximums substantially less than the March average sea ice extents from the NSIDC:
As the link to the image you use mentions Goddard, how sure are you of its reliability?
In any event, here is the EEA arctic SIE analysis for Nov 2012 (there most recent), which has the advantage of showing the trend lines:
As can be seen, the trend for both March and September are both negative, but the absolute value of the September trend is more than twice that of March. It follows, as you point out, that the sea ice extent recovery increases, on average every year.
It is very clever of jetfuel to turn evidence of decreasing sea ice extent at all times of year into proof that the Arctic is cooling /sarc
-
Dikran Marsupial at 03:55 AM on 12 May 2014It's cooling
jetfuel wrote "All from nsidc: In Sept 2012: 3.425M sq km ice area. In Mar 2013 peak day: 15.10M sq km. 15.1-3.425=11.675M sq km increase. I will eventually learn how that compares since 1981. "
perhaps you should perform this analysis before making claims about how unusual the increase is. Now had you been paying attention to the replies to your comments, you would know that the answer has already been pointed out to you more than once. Here is the important graph:
The increase isn't that dramatic compared to previous years, and is due to the fact that winter maximum is declining a bit more slowly than the summer minimum (for fairly obvious reasons). However the trends in both are downwards. Look at the trends, not the noise.
-
jetfuel at 03:47 AM on 12 May 2014It's cooling
Geographic area: Central Indiana, Yes, sorry, I did have the last two winters switched for ice area growth. The second to last season was the one with over 11M of increase.
All from nsidc: In Sept 2012: 3.425M sq km ice area. In Mar 2013 peak day: 15.10M sq km. 15.1-3.425=11.675M sq km increase. I will eventually learn how that compares since 1981. Then after that huge increase, the following winter saw only 15.229-5.1=10.129M sq km. Sorry I had the two years confused with each other. Still, one would think that both years are normal or above normal ice increase (10.129 and 11.675 million sq km). For instance, Sept 23, 1997 to March 1998 increase was only 9.328M sq km of increase, and that was one of the the coldest recent winters, peaking at 15.955M sq km of ice area.
Warmest Arctic air in a while causes nearly the most ever (10.1M), if not most ever (possibly the previous year with 11.675M), sq km of ice to form during the same time puzzles me as to why the warm air didn't stunt ice growth comparatively.
Records, records, and more records: from mlive.com: clarifies my earlier estimates:
"Lake Superior is still over 60 percent covered in ice as of yesterday Saturday April 26, 2014. The satellite pictures shown above were the latest I could find that had clear skies and good vision of the ice. These high resolution satellite images come from April 23 and April 24, 2014.
On Wednesday April 23, 2014 Lake Superior had 68 percent ice cover. According to the Great Lakes Environmental Research Laboratory, the previous highest amount of ice on that date was in 1979 when there was 38 percent ice cover.
So the ice on Lake Superior is currently almost twice as much as recorded for this late date in the ice season. The records go back to 1973.
On Wednesday, Lake Michigan still had 15 percent ice cover. The highest amount in the records on that date was five percent in 1979. This means Lake Michigan has three times the previous highest ice amount on April 23.
Lake Huron was still reporting 25 percent ice, with the previous late season high at 11 percent in 1996."
I learned that while area never eclipsed the 1979 mark, the lasting of ice was the highest on record. This tells me that possibly the volume of ice was surely a record since accurate records of area started in 1973. Some said 2014 was going to be the summer of zero Arctic ice. It may turn out to be the summer of June Lake Superior ice. In other news media statements, I'm led to believe that I live in the only part of Earth that is cooling over last 30 months. US Midwest.
Moderator Response:[JH] Posting a potpurri of factoids is akin to sloganeering which is prohibitied by the SkS Comments Policy. Future posts of this nature will be summarily deleted.
Since you have repeatedly posted poturris of factoids, you are also engaging in excessive repititon which is also prhobitied by the SkS Comments Policy.
You are now skating on very this ice indeed.
-
Dikran Marsupial at 01:05 AM on 12 May 2014Global warming theory isn't falsifiable
Tom, there is a distinction between the models being falsified (which they are by the sea ice extent, where the observations are far enough from the models to be falsified at a sufficently low alpha for us to be confident that they do get sea ice extent wrong) and the theory underpinning the models. mbarret was talking about the falsification of the models. It isn't a big deal that the models are falsified as GEP Box's famous quote tells us that all models are wrong (but some are useful). If we gather enough data all models can be shown to be wrong, however that doesn't mean the underlying theory is wrong, just that some particular refinement or detail is missing from the model.
However, my point remains, even without the models, the scenario I mentioned would falsify the theory within a reasonable timeframe, so mbarret is still wrong!
-
michael sweet at 23:33 PM on 11 May 2014Global warming theory isn't falsifiable
mbarrett:
Your claim that Climate Science is falsifiable only after we are dead is false on its face. In 1896 Arrhenius predicted that the climate sensitivity was 4.5C/doubling of CO2. That number (calculated with a pencil) is still within the IPCC accepted range (although it is at the high end of the accepted range). His calculation has been validated by observations since then. Skeptics ignore the history of climate science when they say the science is not falsifiable.
Likewise, in 1989 James Hansen and denier Richard Lindzen testified before congress. Hansen asserted that the warming signal could be observed while Lindzen testified that it was not warming. The observations currently are "unequivical" that Hansen was correct and Lindzen's position has been falsified. Lindzen has proposed many skeptical theories over the past 40 years. All have been decisively falsified. He will be remembered as an abject failure and a hinderance to determination of the facts about Climate Science.
Numerous other examples exist where Climate Science has correctly predicted changes in advance. The recent National Academy of Science and American Association for the Advancement of Science Reports contain myriad examples of effects predicted decades to centuries ago that are now measured. Skeptical claims that changes will be small have been decisively falsified.
The question before us now, that scientists are currently debating, is will the changes be catastrophic or just really bad? How long will you live? If the drought currently occuring in Texas and Caifornia turns out to be the first major (USA) agricultural hit from AGW we will know if 5-10 years. I expect to live about 30 years. That is enough to see big changes from BAU.
Your claim of "It seems to me a climate science model is not sufficiently falsifiable for many years." is only true if you ignore all the evicence that has already been collected. Of course if your standard is that anything learned before today doesn't count, it will be longer before AGW is proven again.
-
Kevin C at 18:22 PM on 11 May 2014We can't count on plants to slow down global warming
Among the many interesting sociological studies to be on the online response to climate change stories, I think there may be an interesting investigation to be done into the types of stories which don't attract comments. This is a data stream which is missed by more typical studies. (As an extra bonus, the ethics approval would be very simple).
-
Tom Curtis at 10:58 AM on 11 May 2014Global warming theory isn't falsifiable
mbarrett @59:
"I don't think its pointless. In fact, the lack of expertise of, well, everyone who is not an expert, is entirely the point, (remember the objective of this website)."
You should learn, and remember Werner Heisenberg's definition of an expert:
"An expert is someone who knows some of the worst mistakes that can be made in his subject, and how to avoid them."
There are two corrollaries:
1) Mistakes made by experts tend to be interesting, in the sense that you have to learn something new (expand the emperical content of the theory) to refute them; and (more relevant to this discussion)
2) Non-experts do not know all the basic mistakes in a theory, and will tend to repeat them.
Arrogant non-experts repeat them ad nauseum.
You can see the efforts of (often arrogant) non-experts trying to "falsify" climate science by repeating basic mistakes, often mistakes refuted decades, and in some cases centuries ago, in most of the comment threads on SkS. An informative introduction to the arrogance of non-experts can be found by reading the comments in the 2nd Law of Thermodynamics thread.
In any event, there is a clear disparity between experts and non-experts. The criticisms of non-experts will almost inevitably be uninteresting - mere repetitions of mistakes that have been refuted beforehand. Because they are not experts, they do not know any better. In order to effectively criticize the theory you have to be able to distinguish between the interesting criticisms (those which are not mere repetitions of past mistakes), and the uninteresting repetition of basic mistakes - and to do that you need to be familiar enough with the literature to know of those past occurences of the basic mistakes and the papers that responded to those past mistakes, and refuted them.
In contrast, when responding to basic mistakes, you do not need to know what was wrong with all basic mistakes, but only that to which you are responding. Likewise, to understand the basic concepts of the theory, you do not need to be expert. You should, however, recognize that understanding the basic concepts (which takes a few hours study) does not provide the platform for criticizing the theory that comes from many years of intensive study as found in experts.
As an anology, I understand the basic principles of carburetion. That does not mean I am able to effectively criticize the design of any modern carburettor or fuel injection system. I would be a fool to think my limited knowledge gave me that ability. But that in know way means I am unable to show the errors by bigger fools who think carburettors would be improved by placing an impermiable membrain across the barrel, or by removing the jets. Sadly, most inexpert criticisms of climate science show little more sophistication or cogency than those the analogy (I again refer you to the 2nd law of thermodynamics thread if you don't believe me).
For some strange reason, most people are willing to respect expert knowledge in nearly all topics. But they seem to think that expert knowledge ceases to exist if the topic is relevant to public policy. They seem to think that just because the refutation of their particular objection was not included in a basic presentation of climate science (or just as often, included but simply not understood by them), that therefore the refutation does not exist and that they have refuted with a few moments of uninformed thought the work of thousands of experts. They are deluding themselves, and you do them no favour by pretending otherwise.
This does not mean that they should not attempt to refute climate science. In fact I encourage them to do so. But to do so they must put in the effort to become genuinely expert.
Moderator Response:[JH] How about transforming this very informative comment into a SkS article?
-
Tom Curtis at 10:08 AM on 11 May 2014Global warming theory isn't falsifiable
Dikran Marsupial @60, the models have not been falsified by Arctic Sea Ice extent. A climate model predicts a very large number of variables. For any given variable, it may show values with a p value of 0.01 (for instance), but with 20 or more variables predicted, the probability of any one variable showing a p value that low is quite high. With 20 variables it is 0.1821, which is well above the conventional 0.05 falsification standard. Climate models, of course, have far more than 20 variables.
Having said that, if we consider the sea ice modules of climate models in isolation, arguably they have been falsified. Arguably because, according to Popper, whether or not a theory has been falsified is always a matter of convention. (Indeed, given the Duhem-Quine thesis, that falsifications are matters of convention follows by necessity.) As such they may need to be replaced with better modules, and the climate modelling community and particularly the sea ice extent community are very busy trying to assess to what extent the discrepancy is a statistical fluke, and to what extent their theory needs modification.
Here, it is necessary to bear in mind Lakatos statement that all research programs "... grow in a permanent ocean of anomalies", that "All theories, in this sense, are born refuted and die refuted". As a result of this, in his opinion, the important feature of science is not falsifiability, but the determination to eliminate anomalies only by growing the emperical content of the theory - something which is very evident in climate scientists and notably absent from their critics (who tend to ignore anomalies in their own, very stunted theories).
For what it is worth, Lakatos was a student of Popper's, and considered by Popper to better understand Popper's theory of falsification than any person other then himself - until that is, Lakatos showed signs of independent thought.
-
Tom Curtis at 09:33 AM on 11 May 2014It's cooling
jetfuel @228, it is not part of the polar vortex theory that the large southern excursions of the polar jet stream that brings unusual cold for the 21st century will always occur over Illinois. On the contrary, it is a chaotic process, and can at any longitude. Thus, in 2011 it occured over Europe, and weakly over the US eastern seaboard:

In 2012 over the extreme eastern region of Siberia:

In 2013, over the Siberia, Mongolia, China and Japan:

And as already seen, in 2014 it occured over the majority of the contiguous US.
Further, the theory is not that similar events have not occured in the past. Rather, it is that the warmer Arctic ocean makes such events far more likely.
If you are going to criticize a theory, you need to actually read the theory in the scientific papers, and make sure you understand it. If not, you will inevitably end up criticizing a straw man. You can start with Honda et al (2009), which discusses the connection specifically with connection to Eurasia, and Liu et al (2012) , which extends the theory to include the US.
-
Composer99 at 06:02 AM on 11 May 2014It's cooling
Also, this year's sea ice maximum extent was the fifth lowest in the satellite record. What is more, the seven lowest maximum extents have all occured in the last seven years.
And, now that I've noticed it:
then as winters and summers have gotten colder where I live over the last 30 months,
First, citation please. Second, what of it? A small region on the Earth is very likely to see much more variability in its temperature trends in 30 months than it will in, say, 30 years (which is the usual standard for establishing temperature trends in climate).
-
Composer99 at 05:57 AM on 11 May 2014It's cooling
jetfuel, frankly speaking your sense of personal incredulity about what is going on is not a sufficient substitute for analysis based on the available evidence. Especially not when you are backing that up with sea ice numbers that appear to be coming out of thin air.
I should like to reiterate Tom Curtis' point that winters that are exceptional in the 1990s through the present were once a commonplace, and as such by over-stating their importance you are falling for the shifting baselines fallacy.
I must make a special note about:
used to explain why we were having a normal 1900's winter,
Well, yes. Because in the 2010's a "normal 1900's winter" is exceptional and requires an explanation.
-
MA Rodger at 05:45 AM on 11 May 2014It's cooling
jetfuel @228.
You say "....it formed over 11 million sq km of new ice between Sept 2013 and March 2014." I do not recognise that figure. Using NSIDC monthly data, Arctic SIE rose 9.45M sq km. Daily SIE data from JAXA increases this slightly to 9.64M. Daily SIA yields a yet larger number - 9.92M - but none of these nmbers are "over 11 million sq km" and none of them are "a new record."
I am therefore entirely perplexed as to what it is you think you are about with these numbers you present here. Explain yourself - if you can.
-
jetfuel at 02:49 AM on 11 May 2014It's cooling
2011-2012 winter was hardly a winter. 2012-2013 was normal for winter. 2013-2014 was setting all kinds of records in Indiana. We just broke a record for fewest 70 degree days by late April that stood for 99 years.
Warm air always blows up into the Arctic. whether it stayed there or not this past winter, it formed over 11 million sq km of new ice between Sept 2013 and March 2014, and while that was happening, the Arctic is so unusually warm, that it splits up it's cold air mass and smaller pockets drift down over Canada, Indiana, etc. So this year the bad news is: it's negative 25 instead of negative 35 at the North Pole while a new record is set for newly formed seasonal ice area increase throughout the Arctic?
"One thing that is pretty clear is that the cause-and-effect chain for any changes won't have just two links in it" This is exactly why the Polar Vortex narrative that followed 2 days of media silence on Jan 24th this year, used to explain why we were having a normal 1900's winter, and so universally pushed on me by the media, has me agreeing with this quote and all this PV narrative. If the north pole fell apart in January, then as winters and summers have gotten colder where I live over the last 30 months, it seems that just the opposite is happening. Something about warmest Arctic air causes nearly most ever, if not most ever, ice to form during the same time doesn't sound right. And now I'm told that the PV breakup is common pattern? This was the most uncommon winter since 1993-4 here. What recent year exhibited this same PV disruption?
Moderator Response:[JH] Please specify the geographic that is covered in your characterization of recent winters. Is it North America? The entire Northern hemisphere?
You also state: This was the most uncommon winter since 1993-4 here. Where is "here"?
-
Dikran Marsupial at 02:44 AM on 11 May 2014Global warming theory isn't falsifiable
mbarret models are not necessarily inductive, I could make a mathematical model of a double pendulum (a chaotic system) based on physical laws, or a statistical model of the body mass of dinosaurs. There is a spectrum of model types and GCMs are closer to the double pendulum model than statistical ones.
The length of time required to falsify a climate model is also no where near as long as you suggest. A statistically significant cooling over a period of 30 years, during which CO2 had continued to rise and there was no change in otherf forcings which could explain the cooling would consitute a falsification of the models. Such a test has already been performed and the models were not falsified, but they could have been, which is what makes the theory scientific form a Popperian perspective.
"Or to put it another way, falsification is impossible if one is hindered from falsifying."
This is nonsense on stilts. Climatologists are in no way unusual in their view of falsificationism, and modellers are perfectly happy to talk about the failings of their models.
Besides, the models have been falsified, they predict that Arctic sea ice loss will be slower than that we have observed, so much so that it lies outside the spread of the models. The skeptics don't seem to want to talk about that though ;o)
-
mbarrett at 22:37 PM on 10 May 2014Global warming theory isn't falsifiable
I don't think its pointless. In fact, the lack of expertise of, well, everyone who is not an expert, is entirely the point, (remember the objective of this website). There are two ways falsifiability is valid in climate change science. One is the implicit falsifiability of a given theory or research paper, (obviously the rightful point of this page), the other is the value the scientific community attaches to falsifiability as a tool of the non expert to critique their scientific standards. Or to put it another way, falsification is impossible if one is hindered from falsifying. Popper's political opinions, it seems to me, explain the value he attached to falsifiability. If I may make one criticism of your comments, it's that perhaps don't make it clear that you understand a perfectly excellent scientific theory, such as AGW, is not necessarily a showroom example of falsifiability.
-
Tom Curtis at 21:14 PM on 10 May 2014Global warming theory isn't falsifiable
mbarrett @57, I'm so sorry. I had forgotten that Popper's falsificationsim demanded falsification within a certain time limit. So good to learn that theories that the Sun will eventually become a red giant are unscientific because we will not be around to falsify them /sarc
(As an aside, the climate models have not been falsified yet, and may not be falsified when we are long dead - but could have been falsified on their first production. Your conflation of "has not been falsified" with "is falsifiable" is noted, however. I draw your attention once more to the pointlessness of having a right to examine whether or not climate science is falsified, coupled with a complete lack of ability to deal with the issues involved.
-
mbarrett at 20:32 PM on 10 May 2014Global warming theory isn't falsifiable
Thank you for the interesting reply Tom. I am especially taken by your strong reaction to my comment about models:
The most bizzare claim you make is that the reliance on models is problematic with regard to falsification.
I had always assumed that proponents of falsifiability were specifically thinking of the drawbacks of "induction heavy" methods, such as models, especially when, as in the case of climate science, they will only be proven correct when we're all dead. It seems to me a climate science model is not sufficiently falsifiable for many years. I'd be interested to know what other posters think.
Moderator Response:[JH] Plese note that the all-vounterr SkS author team is constructing a time travel machine a la H.G. Wells.
-
MA Rodger at 19:21 PM on 10 May 2014It's cooling
jetfuel @225.
You appear to be asking a rhetorical question - "This didn't have anything at all to do with this last very cold winter?" What is still a mystery to me is which winter you are trying to refer to. 'This last winter' was not 'very cold' for an Arctic winter. Indeed, it was rather warm. (See this graphic of Arctic Ocean Lower Troposhpere Temperatures - usually 2 clicks to 'download your attachment'.) Nor was the previous winter (2012/13) particularly cold. What was cold was the Arctic summer & autumn of 2013.
Given such circumstance, the use of your rhetorical question appears to be misplaced. Indeed, you point out yourself that extra ice volume is due in part to the "retention of thick, multiyear ice", a situation more associated with low levels of melting than with high levels of freezing which sort of fits with the Arctic temperatures over recent seasons.
So is your use of the term "winter" correct and if so which winter are you attempting to refer to?
-
Tom Curtis at 19:08 PM on 10 May 2014It's cooling
jetfuel @223 writes:
"I'm looking for an anomoly where it is much warmer in the Arctic in the winter so as to cause a once in decades event"
Let's ignore the fact that the cold North American winter was not a once in decades event, but an almost commonplace winter as little has half a century ago; and has only become exceptional by comparison to recent warmth.
Rather, let's focus instead on the unusual situation where jetfuel claims to be looking for anomalous warmth, but does not bother looking at surface temperatures to find that anomalous warmth:

(Gisstemp polar authographic projection of 2014 winter temperature anomaly.)
We'll also not ignore the fact that the theory jetfuel is criticizing is that reduced sea ice extent in late autumn creates greater warmth in the Arctic, destabilizing the jet stream resulting in unusually cold early winters. Therefore references to March sea ice extents, sea ice volume and (most especially) Antarctica are all red herrings. What he should be looking at is the November sea ice extent which was the sixth lowest on record. That was only 6.8% below the 1981-2010 average, but that period (1981-2010) shows continuous decline so that it was much more than that below the 20th century average.
Prev 721 722 723 724 725 726 727 728 729 730 731 732 733 734 735 736 Next


