


 Arguments


Recent Comments
Prev 730 731 732 733 734 735 736 737 738 739 740 741 742 743 744 745 Next
Comments 36851 to 36900:
-
citizenschallenge at 05:49 AM on 9 April 2014Watch Episode 1 of James Cameron's "Years of Living Dangerously"
Thanks for posting this. I hope the video get's around.
FWIW: "Years of Living Dangerously - facing what's happening"
http://whatsupwiththatwatts.blogspot.com/2014/04/years-of-living-dangerously-facing.html
-
Tom Curtis at 04:27 AM on 9 April 2014Climate Models Show Remarkable Agreement with Recent Surface Warming
Klapper @46, sorry for the delayed response.
1) Here are the running thirty year trends on annual inverted SOI:
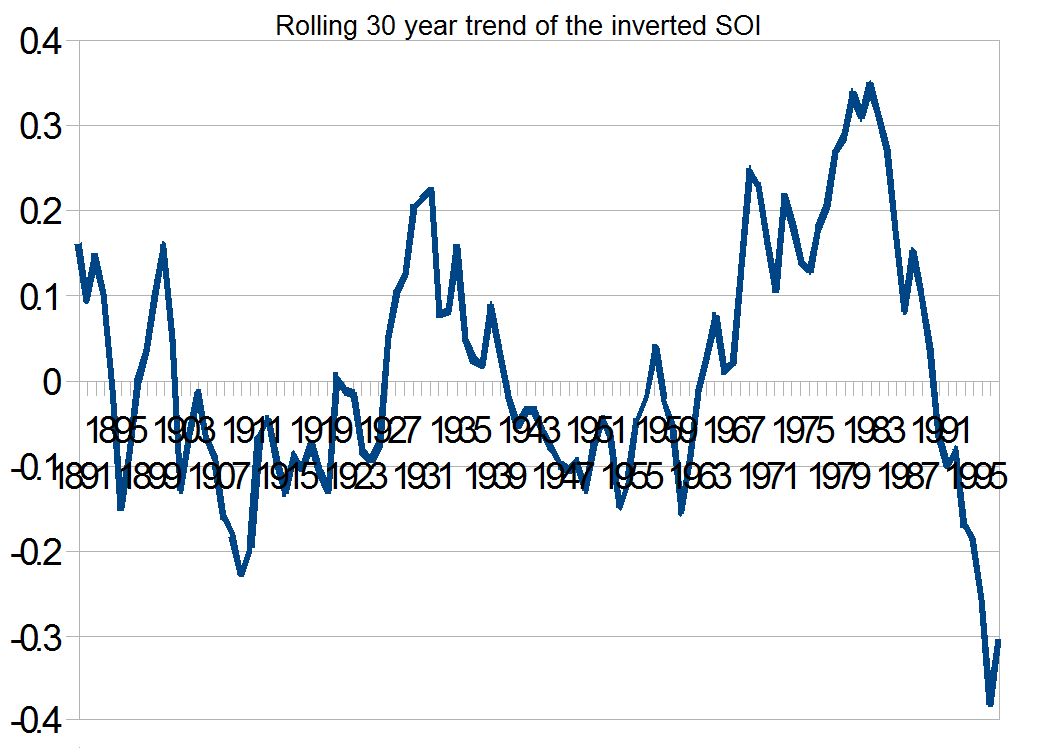
To determine the trend by start and end year, subtract 15 for the start year, and and 14 for the end year. Thus for the trend shown for 1931 in the graph, it has a start year of 1916 and an end year of 1945. You will notice that it has a 30 year trend of 0.213 per annum, a trend you mistakenly describe as "ENSO ... neutral". Rather than being ENSO neutral, it is the highest thirty year trend up to that date. It is just exceeded the following year, but not again exceeded till the trend of 1954-1983 (1969).
2) Here are the successive, inverted 360 month trends in stratospheric aerosol forcing as a proxy for the impact of volcanoes:
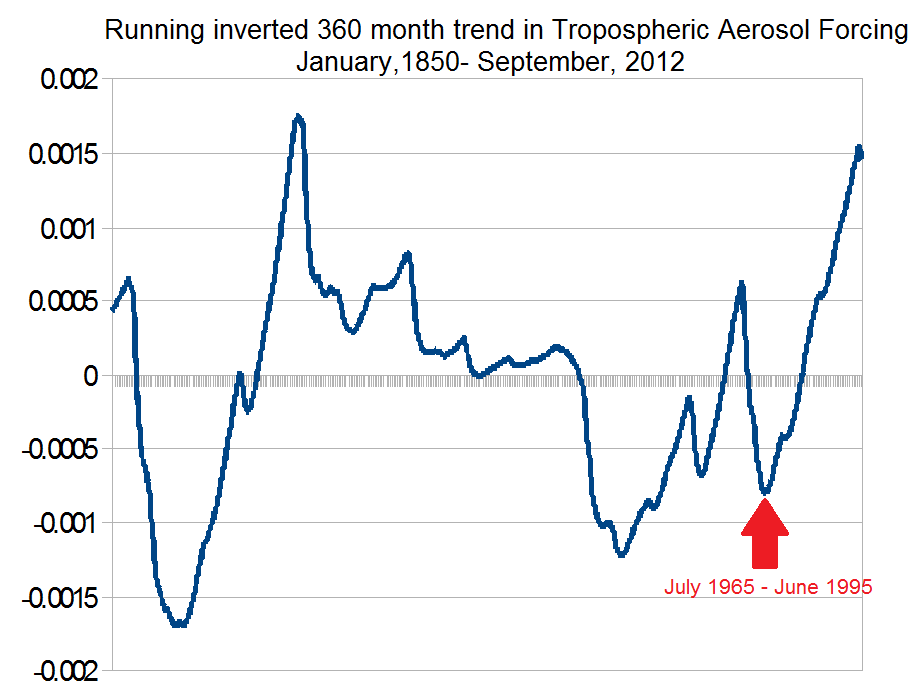
First, I apologize for the lack of dates. My spreadsheet did not want to put them in, and as I am only posting at the moment due to insomnia, I am disinclined to push the issue. The dates given on the graph are for the first initial month, and the last terminal month of the trends. It should be noted that actual volcanic response will be both slower, and more dispersed due to thermal inertia. The trends have been inverted so that positive trends on the graph will correlate with positive trends in temperature, all else being equal.
That brings us to the key point. You point to the strongly positive thirty year trend in ENSO from 1969-1998 as being a point where we would expect divergence between models and observed temperature trends. That period, however, coincides with a period with a significant negative trend in temperatures due to volcanism, as seen above. The actual negative trend for the Jan 1969-Dec 1998 is about half that at the trough indicated, but that strongest negative trend would have been delayed due to thermal inertia. Therefore it would have coincided very closely to the period you point to, suggesting that ENSO and volcanic influences are appreciably mutually cancelling effects in that period so that the observed temperature trend will be close to that due to the underlying forcing.
It should be noted that the volcanic influence becomes positive about terminal year 2002 and becomes strongly positive thereafter - an effect felt strongly in models, but cancelled by the strongly negative ENSO trend in observations.
3) Finally, here are the RCP4.5 vs Observed trends:
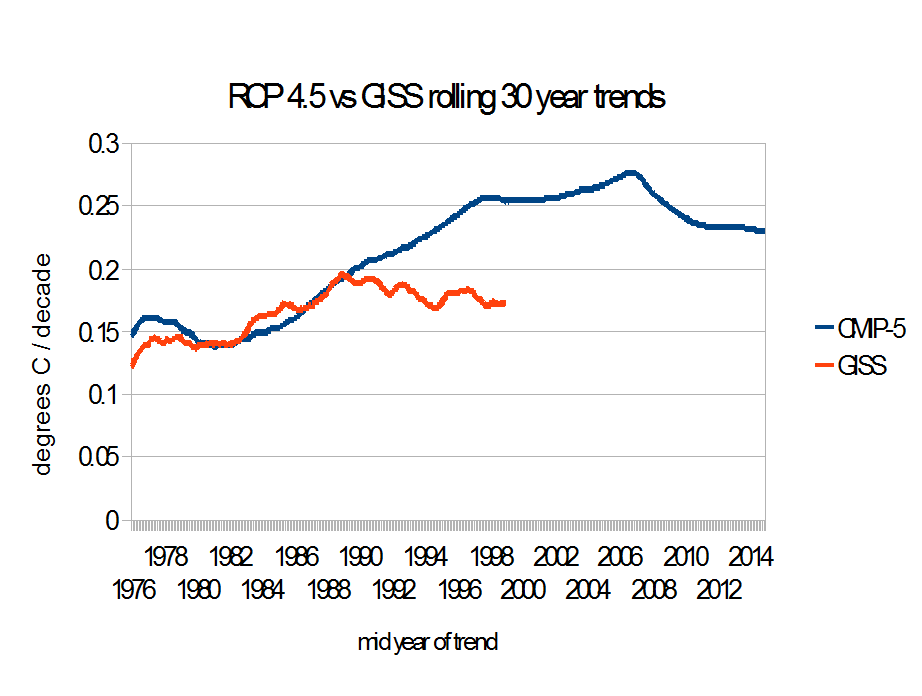
You will notice that in the year 1984 on the graph (initial year Jan 1969, terminal year Dec 1998), the observed trend is greater than the model trend. The precise values are: Modelled trend - 0.148 C/decade
Observed trend - 0.162 C/decade
This is despite the fact that on average observations run cooler than the models. In fact, the baseline trend for the period is about 0.2 C /decade for models, but 0.17 C/decade for observations, showing the modelled trend to have been reduced by approximately 25% due the the effects of volcanism (and a cooling sun), whereas the observed trend is scarcely reduced at all (due the the counteracting effect from ENSO).
You will also notice the clear pattern from the exaggerated model trend due to the effects of volcanism as discussed in my prior post.
To summarize, you presented two counter examples to my claims about the interactions of volcanism and ENSO in influencing the observed and modelled thirty year trends in Global Mean Surface Temperature. One of those counter examples is shown to be invalid because, whereas you describe it as ENSO neutral, it in fact shows a strong ENSO trend, and presumed ENSO influence on temperatures. The second counter example raises a valid point, ie, that we should expect the observed trend to be exagerated relative to modelled trend for the period 1969-1998. However, that fails as a counter example because the observed trend is exagerated relative to the modelled trend over that period, and even more so once we allow for the generally slightly (15%) lower observed relative to modelled trends. Detailed examination of the data, therefore, shows your "counter examples" to be in fact "supporting instances" - and shows the general validity of the account I have laid out here.
It should be noted that I do not presume that ENSO plus the standard forcings (including volcanic and solar) are the only influences on GMST. They are not - but they are the dominant influences. So much so that accounting for them plus thermal inertia results in a predicted temperature that correlate with observed temperatures with an r squared greater than 0.92
(Note, you in fact quoted 31 year trends rather than 30 year trends. I have therefore used the nearest relevant 30 year trends in discussing your points.)
-
One Planet Only Forever at 23:20 PM on 8 April 2014The climate change uncertainty monster – more uncertainty means more urgency to tackle global warming
Poster @ 11:
I'm not sure I follow the basis for your comment that I ignore the burning of fossil fuels in the internal combustion engine. My third point is the catchall of the unacceptability of any burning of fossil fuels. That activity is not just fundamentally unsustainable, putting at risk the future of any economy or society that relies on it, but it creates many harmful unsustainable results in addition to the excess CO2.
My fundamental position is that the only future for humanity is for all human activity to be 'restricted' to truly sustainable activity as part of a robust diverse web of life on this amazing planet.
So my view not only includes the need to curtail any burning of fossil fuels, it includes the need to ciurtail any consumption of non-renewable resources. The only acceptable use of a non-renewable resource should be no accumulating damage done getting the resource and converting it into a useful product and absolutely full recycling of the material...forever...
Humanity has several hundred million years to enjoy on this planet. They can't consume it along the way. The same applies to any thoughts of spreading life beyond this planet. If what we spread is the current attitude we spread a damaging disease, not sustainable life.
-
Poster9662 at 17:35 PM on 8 April 2014The climate change uncertainty monster – more uncertainty means more urgency to tackle global warming
Comment@10. You,apparently, blithely ignore the burnign of fossil fules by the internal combustion engine. This aspect of the "West's" profligacy is rarely mentioned as too many in the "profligate West" rely on this to maintain their lifestyle, Rather than focus on "solar and wind" more Draconian actions on use of the ICE would be appropriate
-
One Planet Only Forever at 13:03 PM on 8 April 2014The climate change uncertainty monster – more uncertainty means more urgency to tackle global warming
A few points:
1. I am pretty sure that the scientific global average surface temperature increase of concern has been, and continues to be, 1.5 decgrees C. That is the temperature beyond which climate changes are likely to become less predictable combined with being more signficant. The 2 degree C limit is the result of global leaders in Copenhagen acknowledging that the failure of the most fortunate to significantly reduce the impacts of their lifestyles, including exporting larger amounts of their impacts to nations like China and India, has made it very unlikely that impacts can be limited to a 1.5 degree C increase.
2. The economic evaluations ignore one critical aspect. The people expecting to benefit most from failing to reduce the burning of fossil fuels is not the group that is expected to suffer the consequences of their irresponsible unsustainable and damaging activities.
3. The economic evaluations also typically ignore the fundamental unsustainability of burning fossil fuels. And they ignore far more unsustainable and damaging consequences than the results fo the excess CO2 that is produced.
4. Many economic evaluations actually discount the future costs, claiming a future cost is not as important as a current benefit. Though this is a valid way of evaluating alternative investment opportunities, it is a totally inappropriate way of evaluting the merits of current day activities. The only legitimate value of a current day activity is the benefit obtained into the future. By that measure it is clear that the current burning of fossil fuels is essentially a worthless activity.
-
KR at 12:21 PM on 8 April 2014Climate Models Show Remarkable Agreement with Recent Surface Warming
Matzdj - My apologies, I overlooked part of your question.
"How are these effects [ENSO, volcanic action, solar changes, etc] removed?"
The scale for the effects of these variations are derived from statistical models, namely by the use of multiple linear regression of the time signatures of those variations against the time signature of temperature. See Foster and Rahmstorf 2011 and Lean and Rind 2008 for details. And in anticipation of one of your potential questions, F&R 2011 in particular examined these variations against various lag times, which means that nonlinear responses of the climate to those forcings average out to zero in the long term - any mismatch between linear/nonlinear response cancels out.
There are other methods for these scale estimates which are in general agreement - see John Nielsen-Gammons estimates of ENSO effects, or any of the many papers on the climate effects of Pinatubo.
-
KR at 12:03 PM on 8 April 2014Climate Models Show Remarkable Agreement with Recent Surface Warming
Matzdj - Your first question was answered quite succinctly by Kevin C above; there are parameterizations for physics below model resolution, which are driven only by the match to observed behavior at those small scales - local physics only. There are, however, no statistically fitted parameters for global temperature response - that is an emergent result of the large scale physics, and certainly not (as you implied in your first post on this thread) a result of tuning the global model to provide a certain answer.
As to the second question, running a GCM takes quite a bit of time and effort, note the amount of computation - they are not something you want to (or can) run every afternoon, even if you have a supercomputer cluster just hanging around. The CMIP3 and CMIP5 model runs started with a specified set of forcings, including projections through the present, and were run on those common forcings for model comparison. If the set of forcings used in those sets of model runs were constantly changing, there would never be a time when all the various modellers were working from the same set of data, no way to compare models or to look at their spread.
But as to what happens when forcings don't match the projections of a few years ago, read the opening post and look at figure one.
-
Matzdj10109 at 11:29 AM on 8 April 2014Climate Models Show Remarkable Agreement with Recent Surface Warming
Thanks to all who responded to my questions above. I have two follow-ups:
1. I believe I am hearing that climate models have no constants in the models whose values are determined by fit to the actual data? is that true? I am very surprised because I have been led to believe that in some cases, for instance cloud formation, that we do not understand the physics well enough to precisely put them into the model ? Can you give me a reference to review one of these models that have no constants that need to be multiple-variable-regression-fit to actual data before they can be used for forecast?
2. I also am hearing that when you remove the effects of El Ninos, La Ninas, volcanic eruptions, etc. that what's left fits the observed data really well. How are these effects removed? How is the effect of a strong El Nino removed differently than the effect of a weak El Nino, or the effect of a big volcanic eruption versus the effect of small one?
If we understand how to remove these from the models at the correct intensity of effect, based only on physics, when they occur, then we should be able to put them into the model as zero effect when they are not occurring and then add their effect each time one does occur with the effect that was predetermined for that intensity of event.
These are major short term forcings. Why aren't they included in the models to incorporate their effect each time they occur?
-
gws at 08:28 AM on 8 April 2014Watch Episode 1 of James Cameron's "Years of Living Dangerously"
Note that the project comes with an educator resource linked through the main page, http://www.climateclassroom.org/. It is sparsely populated yet, but since movies generally make a good entry point for discussion, reinforcement, and motivation, it may become a useful resource, including for house (watching) parties.
-
John Hartz at 07:34 AM on 8 April 2014Watch Episode 1 of James Cameron's "Years of Living Dangerously"
The Tipping Points series cited by Jim Eager premiered on the U.S. Weather Channel in October of last year. An informative article about the series, Weather Channel series takes journey to Earth's tipping points, was posted on the Mother Nature Network website on Oct 10, 2013.
-
Jim Eager at 06:58 AM on 8 April 2014Watch Episode 1 of James Cameron's "Years of Living Dangerously"
Another good series is The Tipping Points,
currently showing on TVOntario
-
John Hartz at 06:41 AM on 8 April 2014Watch Episode 1 of James Cameron's "Years of Living Dangerously"
Another prominent U.S. female climate scientist is Heidi Cullen, who together with Joe Romm functioned as the science advisors to the production of Showtime's ‘Years of Living Dangerously’
Climate Central has posted a video of Cullen's appearnce on yesterday's NBC News Sunday show, Face the Nation. The post is Heidi Cullen Talks IPCC on Face the Nation. Cullen also discusses her role on the Showtime series.
-
gws at 03:46 AM on 8 April 2014The climate change uncertainty monster – more uncertainty means more urgency to tackle global warming
good post, giving context to the risk management nature of climate change
minor detail: IMHO, the text stating
"... the accelerating nature of climate damage costs with more warming would still mean that greater climate uncertainty translates into more climate damages."
should better be
"... the accelerating nature of expected climate damage costs with more warming would still mean that greater climate uncertainty translates into higher risks of climate damages."
since uncertainty does not directly translate to higher costs, by higher risks. The change keeps it more consistent with the remaining text, I think.
-
Rob Honeycutt at 03:34 AM on 8 April 2014Watch Episode 1 of James Cameron's "Years of Living Dangerously"
I watched it just this morning. All I can say is: Fantastic!!
I'm just floored by the important work that Katherine Hayhoe is doing. She's just amazing.
-
Rob Honeycutt at 03:30 AM on 8 April 2014The climate change uncertainty monster – more uncertainty means more urgency to tackle global warming
Poster... Just to add a good visual for what KR is saying about asymmetry:

-
vrooomie at 03:05 AM on 8 April 2014The climate change uncertainty monster – more uncertainty means more urgency to tackle global warming
Re: KR's mention of the 'long tail:' here's but one good explication of why this is a critical, but oft-overlooked aspect of what turns out to be a widespread and poor understanding of risk analysis.
http://earlywarn.blogspot.com/2010/05/explaining-long-tail-climate-risk.html
-
vrooomie at 03:00 AM on 8 April 2014Watch Episode 1 of James Cameron's "Years of Living Dangerously"
I viewed this as soon as I saw a link to do so: it's *great* to see this level of attention paid to this critical and very real issue. Along with this, and NBC's program of last night, I expect a howl of protest from the denialati, which I will listen to with great relish. The louder the scientific community makes them howl, the loonier they will appear, and the sooner we can get down to the brass tacks of doing what we *all* need to do, to mitigate the oncoming damage.
-
KR at 00:19 AM on 8 April 2014The climate change uncertainty monster – more uncertainty means more urgency to tackle global warming
Poster - This is tendency, for uncertainties to increase the cost risks, is exacerbated by the near lognormal distribution of sensitivity estimates. The high tail of sensitivity estimates is much longer than the low tail, meaning that for equal probability estimates the weighted high end will increase the total risk cost far more than the equal probability weighted low end will decrease total risk cost.
Add the asymmetric sensitivity estimate to the rise in risk cost due to larger uncertainty spreads, and the financial risk is considerably higher than if we had a highly constrained estimate of climate sensitivity. Uncertainty is not our friend.
-
Kevin C at 23:28 PM on 7 April 2014The climate change uncertainty monster – more uncertainty means more urgency to tackle global warming
Poster:
The conclusion is based on how financial risk is calculated. If there are multiple possible outcoomes, you have to take into account the cost of all possible outcomes, weighted by the probability of each of those outcomes.
Increasing uncertainty increases the probability of both high and low cost outcomes. However the shape of the cost curve is such that the finacial risk, calculated using the above method, increases.
This is the standard approach used by insurers, investors and gamblers for decades or centuries, however the issue is clearly confusing to a lot of people.
-
Poster9662 at 22:38 PM on 7 April 2014The climate change uncertainty monster – more uncertainty means more urgency to tackle global warming
Reading the summary from the University of Bristol I am puzzled by this comment " Scientists have shown that as uncertainty in the temperature increase expected with a doubling of carbon dioxide from pre-industrial levels rises, so do the economic damages of increased climate change. Greater uncertainty also increases the likelihood of exceeding ‘safe’ temperature limits and the probability of failing to reach mitigation targets" Why is the uncertainty focussed only on increases in temperature (and on sea level rises)? Surely if the uncertainty in rises is increasing, isn't the uncertainty of stabiity or even falls in temperatures (and falls in sea levels) also increasing. Why does greater uncertainty also not increase the likelihood of not exceeding "safe trmperatures'? Why is ths aspect not considered worth a mention?
-
localis at 17:19 PM on 7 April 20142014 SkS Weekly Digest #14
At least future earthlings (if there are many) will find a wonderful record of how accurately we measured our own destruction while doing nothing to stop it.
-
johnsnz at 15:56 PM on 7 April 20142014 SkS Weekly Digest #14
Because the human psych is alien and that intellegence-wise we are barely at the cave mouth, its only natural that way deep down we will get off this planet - perhaps to return home?
In a mad rush theres always stumbling, no and wrong decisions. Lets relax, just embrace GW and over population as prompts to capitalise on our technological prowess to make it all happen.
-
barry1487 at 15:25 PM on 7 April 20142014 SkS Weekly Digest #14
Checked, they are the final drafts, yet to be edited.
-
One Planet Only Forever at 14:47 PM on 7 April 2014Earth has a fever, but the heat is sloshing into the oceans
Bob Laidlaw @ 15,
There are indeed many statistical methods to try to figure out what has been happening in the later part of a set of data points in an extensive series of data with values widely, and occasionally rapidly, fluctuating due to significant random influnces.
However, such evaluations can be challenged, and require reworking, as soon as the next randomly influenced value is added. That does not occur with a simplistic evaluation like a 30 year roilling average. Even wildly aberrant values such as the 0.5 C degrees changes of one month to the next or the 0.35 C chnages form one year to the next in the GISTEMP data set are smoothed by beig averaged with the opposite aberations within the larger set of averaged values.
Also, as I clarified, accounting for the random significant influencing factors would allow a more reasonable evaluation.
-
One Planet Only Forever at 14:31 PM on 7 April 2014Earth has a fever, but the heat is sloshing into the oceans
Klapper @14,
As I mentioned, what I mean by a rolling average is that I calculate a new 30 year average for every new month of data. And the 30 year rolling average can also show 'rates of change'. More importantly, temporary eroneous fluctuations cannot give credence to unjustifiable misleading claims based on evalautions of temepratures since moments like the last major temporary induced extreme in the global average surface temperature data.
-
barry1487 at 12:40 PM on 7 April 20142014 SkS Weekly Digest #14
The Daily Fail has once again posted a pack of lies.
The article claims that conclusions have been changed from the "original" WGII report, but what they actually do is quote sentences on one of a variety of opinions in the body of the report (Chapter 9 on migration, Chapter 12 on conflict), and present them as conclusions.
IPCC have responded to the article.
http://www.ipcc.ch/pdf/press/140406_statement_mail_online_statement.pdf
The references to the underlying report cited by the Mail on Sunday in contrast to the Summary for Policymakers also give a completely misleading and distorted impression of the report through selective quotation. For instance the reference to “environmental migrants” is a sentence describing just one paper assessed in a chapter that cites over 500 papers – one of five chapters on which the statement in the Summary for Policymakers is based. A quoted sentence on the lack of a strong connection between warming and armed conflict is again taken from the description of just one paper in a chapter that assesses over 600 papers. A simple keyword search shows many references to publications and statements in the report showing the opposite conclusion, and supporting the statement in the Summary that “Climate change can indirectly increase risks of violent conflicts in the form of civil war and inter-group violence...”.
For instance, the Mail quotes this sentence as being the "original" conclusion.
While alarmist predictions of massive flows of refugees are not supported by past experiences of responses to droughts and extreme weather events, predictions for future migration flows are tentative at best.
But that is a verbatim quote from the abstract of one paper mentioned in Chapter 9 [Tacoli (2009)], and in no way a concluion.
(Don't know if these are final. Seem to be)
-
Klapper at 12:00 PM on 7 April 2014Climate Models Show Remarkable Agreement with Recent Surface Warming
@Tom Curtis #45:
" ..looking at the effect of adding just eight years data on thirty year trends is little better than focusing on eight year trends..."
I don't agree. There has been a rapid divergence over the last 8 years between the CMIP5 projections and empirical data 30 year linear trends. You've given some reasons, namely the timing of ENSO and volcanos, but in both you are assuming both are just noise confounding the true warming signal.
In the case of ENSO I don't agree that it is just noise. But for the sake of argument let's assume ENSO is just noise. Let us also assume the models also respond correctly to volcanos, so the error between the model and SAT trend cannot be attributed to volcanic espisodes. Again, I don't agree, I think the models overcool during volcanic episodes, but for the sake of argument...
So then let us then run a rolling 30 year trend on ENSO to find the coherence between model and empirical warming trends. Since the models don't replicate ENSO, the coherence should be good in periods when the ENSO trend is neutral and not so good when the ENSO trend is either positive or negative, right?
In some periods where the ENSO trend is basically neutral, like 1936 to 1966, and 1976 to 2006, the CMIP5 trend agrees with the SAT 30 year trend. However, in other periods where the ENSO 30 year is neutral (1916 to 1946), there is significant divergence, indicating the models are in error for some reason, either incorrect treatment of aerosols, incorrect aerosol data, or possibly incorrect treatment of GHG forcing.
Likewise, in some periods where there are strong trends in ENSO, the models have good coherence with SAT, which is puzzling, since in theory they don't "know" about ENSO. Take the 1968 to 1998 period for example, there is a strong positive trend in ENSO, which should mean the models underestimate the warming. In fact in this period the models are in good agreement with the 30year SAT trend.
-
johnthepainter at 11:24 AM on 7 April 2014The climate change uncertainty monster – more uncertainty means more urgency to tackle global warming
The idea is familiar. In fact, I just sent a letter to my congressman in response to his response to an earlier one I sent him. He indicated that the cause of global warming was still in doubt and called (twice) for more study. I argued that we know enough to be aware that the risk is high, and the need to act is urgent. I quoted this excerpt from William Nordhaus's devastating analysis of the letter that sixteen scientists (if you include some engineers and an astronaut/senator in the count) published in the Wall Street Journal in 2012, in which they cited Nordhaus to buttress their position that it was best to do nothing about global warming. He rejected the position they attributed to him and, on the idea of uncertainty as a basis for doing nothing, he wrote,
"One might argue that there are many uncertainties here, and we should wait until the uncertainties are resolved. Yes, there are many uncertainties. That does not imply that action should be delayed. Indeed, my experience in studying this subject for many years is that we have discovered more puzzles and greater uncertainties as researchers dig deeper into the field. . . . Policies implemented today serve as a hedge against unsuspected future dangers that suddenly emerge to threaten our economies or environment. So, if anything, the uncertainties would point to a more rather than less forceful policy—and one starting sooner rather than later—to slow climate change."
Richard Alley made the same point in a lecture, saying, "The less you trust me, the more worried you should be."
The new research is a welcome addition to buttress this argument. -
Bob Loblaw at 11:05 AM on 7 April 2014Earth has a fever, but the heat is sloshing into the oceans
With regard to moving energy or heat from the surface into the deep oceans without warming the middle depths:
Energy transfer by convection or mass transfer has some rather subtle features that may come as a bit of a surprise if someone is stuck in a mind-set of conduction/diffusion thermal transfer.
Let's take the analogy of three rooms with connecting doors. The three rooms have temperatures of +20C, 0C, and -20C. Each room also has a large box, full of air equilibrated to room temperature.
- I pick up the box in the +20C room, walk through the middle room to the -20C room, while at the same time another person picks up the -20C box and walks through the middle room to the +20C room.
- at the end, the +20C room is now colder. It has a box of -20C air, which will (over time) equlibrate with the room, slightly cooling the rest of the room.
- the same happens at the -20C room: it has a box of +20C air which will warm the -20C air slightly as it equilibrates.
Note that there has been no net transfer of mass - each room at the end has lost a box and gained a box of air.
There has been a transfer of energy from the +20C room to the -20C room.
And most important of all: the room in the middle has not changed its temperature (energy content).
The same can heppen in the ocean: warm water from the surface to the deep ocean, offsetting water mass moving from the cold depths to the surface, No net mass transfer, but an energy transfer, and the middle layers just watch in fascination.
-
Bob Loblaw at 10:52 AM on 7 April 2014Earth has a fever, but the heat is sloshing into the oceans
Rolling averages? Not perhaps the best way of smoothing things, particualrly if you are interested in what is happenng at the ends of the time series.
Tamino has a good three-part series on the subject, from earlier this year:
-
John Hartz at 10:21 AM on 7 April 2014The climate change uncertainty monster – more uncertainty means more urgency to tackle global warming
Poster::Your comment is off-topic and therefore was deleted.
-
Klapper at 10:14 AM on 7 April 2014Earth has a fever, but the heat is sloshing into the oceans
@One Planet Only Forever #2:
"I personally prefer to use a simple spread sheet to follow the rolling 30 year average of the GISTEMP Land-Sea monthly average (a new 30 year average for every new month)"
Aren't we more interested in changes in the warming rate? Why not do your analysis on a rolling linear trend of the last 30 years, instead of a rolling average?
-
One Planet Only Forever at 07:40 AM on 7 April 2014Video: Climate science crash course by Dana Nuccitelli with Citizens Climate Lobby
I agree it is great to see examples of faith-based and politically-fiscally conservative individuals who acknowledge the need to change the system to undo the motivation for the unacceptable types of development that the system has been creating.
The need to change the system so that people who try to benefit from unsustainable or damaging activities and attitudes cannot succeed is easily understood by people with a wide variety of value sets. About the only groups that fight against the required change are people who want to benefit from unsustainable and damaging activities as long as they can get away with. And that group has many masks, but they commonly hide behind the Conservative Movement, which is only a sub-set of faith-based and fiscal-conservative people hoping to be confused with, and get support from, the larger population of faith-based people and fiscal conservatives.
-
r.pauli at 03:01 AM on 7 April 2014The climate change uncertainty monster – more uncertainty means more urgency to tackle global warming
Gravity rules.
The airplane has run out of fuel and is going down. The crew is looking for the best place to land, we may find a soft field or we may crash hard. We are uncertain of the exact location.
Uncertainty does not mean that it won't happen.
-
TonyW at 18:33 PM on 6 April 2014Toward Improved Discussions of Methane & Climate
Sorry, I see that saileshrao has posted a link to the Beckwith reponse, but I didn't see a response here.
-
TonyW at 18:26 PM on 6 April 2014Toward Improved Discussions of Methane & Climate
Paul Beckwith "published" a response in the Arctic-News blogspot, on Friday August 9th. I'm not really inclined to link to that site, but the suffix of the link is /2013/08/toward-genuinely-improved-discussions-of-methane-and-climate.htmlHas Chris Colose read that piece and, if so, responded anywhere? -
Rob Honeycutt at 04:25 AM on 6 April 2014Earth has a fever, but the heat is sloshing into the oceans
Topal... "Overall, there is no change in the heat content, it's just redistribution and mixing of existing heat."
Your question was not in regards to changes in heat content. You asked about mixing and how heat gets distributed to lower layers.
If you're actually interested in ocean-atmosphere coupling here's a really great page that explains all the mechanisms in plain language.
http://eesc.columbia.edu/courses/ees/climate/lectures/o_atm.html
-
Rob Honeycutt at 04:22 AM on 6 April 2014Earth has a fever, but the heat is sloshing into the oceans
Topal @6... Previously you asked the question, "What is the mechanism that pumps heat down without mixing it with the layers on the way down? What is the driver or this pump?"
The diagram I showed you @7 explains how it's not a matter of "mixing with the layers on the way down." It's a matter of shifting the thermocline, and the "driver" or "pump" the mechanism is surface winds.
If you understood this in the first place, I'm not clear on why you asked such a question.
-
howardlee at 02:08 AM on 6 April 2014Alarming new study makes today’s climate change more comparable to Earth’s worst mass extinction
Tom - Ii think the climate sensitivity question goes to the heart of the issue. We have on the one hand sensitivities based mainly on modeling and the instrumental record that are 1.5-4.5°C (2.7-8.1°F) (IPCC AR5).
On the other hand, looking at the geological record, it suggests that actual Earth System Sensitivity is double that. For transient sensitivity - relevant to the year 2100 - we have to bridge the gap between what we are doing now to that long term sensitivity. Zeebe does this in this paper: "even if the fast-feedback sensitivity is no more than 3 K per
CO2 doubling, there will likely be additional long-term warming from slow climate feedbacks"Even though The AR5 study included the paleoclimate sensitivity in this paper i worry that by heavily weighting the study with benign glacial-interglacial changes which happen within the slow feeback timeframe, we may have generated an overly benign estimate of climate sensitivity. The carbon-belch scenario - with atmospheric emissions overwhelming the surface ocean and fast feebacks before deep oceans come into play would - intuitively - suggest a much higher sensitivity. That's why study of LIP-generated climate change could be crucial for understanding what's in store for us, more so than glacial-interglacial changes.
-
One Planet Only Forever at 02:03 AM on 6 April 2014Earth has a fever, but the heat is sloshing into the oceans
A clarification of my comment @2.
Evaluation of global average surface temperature for time periods that are not long enough to average in the broad range of the significant influences like ENSO (phase and strength) and volcanic dust (amount, nature of the particles, and height and distribution in the atmosphere), can be performed by reasonably accounting for those influences.
The challenge is getting people who want to believe otherwise to stop choosing to focus on information in a way that suits their interest. Some people may never overcome their struggle to better understand what is going on because they won't give up their strong personal desire to get the most possible personal benefit any way they can get away with.
For the sake of the future of humanity (and all other life on this amazing planet), these people need to be disappointed by policy and actions regardless of the impression of popularity and profitability that can be created for the unacceptable unsustainable actions and attitudes they refuse to change their mind about. (That is delving into the politics, but I mention it because I consider it to be the best understanding of what is going on, which is an assessment of the available observations, which is what science is all about).
-
sidd at 15:21 PM on 5 April 2014Earth has a fever, but the heat is sloshing into the oceans
there is actually a nice dichotomy to be explored herea)isotherm heaveb)water mass changethe first has a short time constant, on the order of montthe second perhaps decadesthis is explored in a fascinating paper by Purkey and Johnson dealing with the southern hemisphere DOI: 10.1175/JCLI-D-12-00834.1also i note that my previous comment is now a)redundant, since the comment previous to it has been removedb)self-referentialheeheeheesidd -
One Planet Only Forever at 12:53 PM on 5 April 2014Earth has a fever, but the heat is sloshing into the oceans
Topal,
A further clarification. El Nino conditions mean that the average surface temperature of the equatorial Pacific is warmer, La NIna means the overall average is cooler. The following link to the NOAA data of the ONI may help you better understand this. You can see that the variation of the average is significant (several degrees C)
http://www.cpc.ncep.noaa.gov/products/analysis_monitoring/ensostuff/ensoyears.shtml
-
One Planet Only Forever at 12:48 PM on 5 April 2014Earth has a fever, but the heat is sloshing into the oceans
Topal,
Here is anopther version of the same thing others have been trying to help you better understand what is going on.
When La Nina conditions exist a large area of the eastern equatorial Pacific Ocean has cold surface waters upwelling as shown to you by ohers, and able to be learned about from a variety of sources if you really want to better understand what is going on. That colder surface is a circulation of the deeper colder waters and it takes heat out of the air above it (wind and wave action), leading to a global average surface rtemperature lower than a norm or avergae ENSO neutral temparature (because the winds result in the cooling affecting more area than just the cooler surface water region.
When El Nino conditions form the entire area of the equatorial Pacific is warmer leading to much warmer air being circulated around the planet and a higher than "norm or average" global average surface average temperature like the one created by the very strong El Nino of 1997/98 (a similarly strong El NIno has not formed since then, but one will)
I hope that helps.
-
Tom Curtis at 11:11 AM on 5 April 2014Alarming new study makes today’s climate change more comparable to Earth’s worst mass extinction
howardlee @16, I agree with you about the ocean currents. With respect to the Permian taiga forest like conditions, that would be consistent with a forcing equivalent to modern forcings rather than with a forcing less than during the last glacial as suggested by the revised CO2 estimates. Having said that, that estimate assumes modern alebedo. Had the albedo decreased to 0.25, the net solar forcing would represent an increase of 11.5 W/m^2 rather than a decrease of 5.2 W/m^2. The unknowns are too large to say anything definitive.
I will say this, though. The forcing calculations show that a change in conditions equivalent to that which drove the Permian extinction event cannot be excluded based on "high" Permian CO2 levels; but nor is it certain that we face one. Based on Sherwood and Huber, we would require four doublings of CO2 at "likely" estimates of climate sensitivity to reach such conditions; but could reach them with two doublings at climate sensitivities within the IPCC "90% confidence interval". That is, a BAU approach with declining conventional fossil fuels being replaced by unconventional fossil fuels (shale oil, tar sands) and diesel manufactured from coal could bring about such conditions from, at a rough estimate, 150-300 years from now.
We could get Permian extinction levels of species loss, however, within 100 years with without such an aggressive BAU approach when coupled with other factors (notably overfishing).
-
Tom Curtis at 10:43 AM on 5 April 2014Alarming new study makes today’s climate change more comparable to Earth’s worst mass extinction
chriskoz @12:
1) While local warming rates may not correlate with local forcings due to heat transfer, for increased insolation to not result in a greater warming at the tropics than at the poles, it must drive a mechanism to reduce the escape of heat to space, thereby forcing greater heat transfer towards the poles. In fact it does drive such a mechanism in the water vapour feedback. However, given that the WV feedback essentially doubles the Planck response to forcing, it is a reasonable approximation that for the same forcing, increased CO2 (which also restricts heat escape to space) will drive a greater heat transfer to the poles than will an equivalent increase in insolation. Indeed, given the same global temperature response from both forcings, and given that CO2 forcing does amplify polar temperatures more than does solar forcing, it follows that solar forcing must generate greater warming elsewhere for the average to come out the same.
2) While relative change from conditions to which organisms are adapted to is the major driver of extinction, there are some hard physiological limits. Clearly no organism can survive the permanent lowering of its body temperature much below freezing. The possibility of evolving some sort of antifreeze for the blood (found in some fish) or or merely seasonal activity makes this "hard limit" a bit fuzzy, but the dominance of warm blooded life forms in Arctic ecology shows that very low temperatures present more than a relative impediment to life.
The same occurs for warm temperatures. Very high temperatures restrict the capability of getting rid of excess heat. This is particularly a problem for large warm blooded creatures, but at higher temperatures becomes a problem for large "cold blooded" creatures, which generate internal heat from the function of muscles and organs, as well. For large warm blooded creatures that use evaporative cooling for heat dissipation, the "hard limit" is sustained wet bulb tempertures of 35 C (SkS summary).
Even for small cold blooded creatures, as sustained temperatures exceed 40-50 C, the disorganizing activity of the heat tends to overwhelm their ability to sustain life - but that limit is nowhere near as hard as it is for large cold blooded, or for warm blooded creatures.
3) While Burgess et al may not attribute the extinctions to high temperatures, Sun et al (2012), linked in the OP under "lethally hot" certainly do. They write:
"The entire Early Triassic record shows temperatures consistently in excess of modern equatorial annual SSTs. These results suggest that equatorial temperatures may have exceeded a tolerable threshold both in the oceans and on land. For C3 plants, photorespiration predominates over photosynthesis at temperatures in excess of 35°C, and few plants can survive temperatures persistently above 40°C. Similarly, for animals, temperatures in excess of 45°C cause protein damage that are only temporarily alleviated by heat-shock protein production. However, for most marine animals, the critical temperature is much lower, because metabolic oxygen demand increases with temperature while dissolved oxygen decreases. This causes hypoxaemia and the onset of anaerobic mitochondrial metabolism that is only sustainable for short periods. As a consequence, marine animals cannot long survive temperatures above 35°C, particularly those with a high performance and high oxygen demand, such as cephalopods."
The lower temperature for marine animals is because of induced anoxia rather than heat stress specifically, but for land animals and plants, it is heat stress that is the killer.
While Sun et al deal strictly with the Triassic, including the aftermath of the Permian/Triassic extinction, Burgess et al show that CO2 levels at the extinction event where higher even, than those at the end Smithian with its 40 C tropical waters. (As a side note, those 40 C waters may have been restricted to the proto-tethys, a very large shallow sea stradling the equator, and may not have been typical of oceanic tropical water.) As it happens, CO2 concentrations were higher during the Permian extinction than the end Smithian, with presumably higher temperatures as a result:

(Corrected version of Burgess et al, 2014 Fig 3)
-
topal at 10:28 AM on 5 April 2014Earth has a fever, but the heat is sloshing into the oceans
Rob, I know how this works. But the warm water that accumulates to greater depths in the west results in colder water being exposed at the surface in the east. Overall, there is no change in the heat content, it's just redistribution and mixing of existing heat.
(snip)
Moderator Response:(Rob P) - No, you don't know how this works. Your line of questioning bears this out.
You appear uninterested in learning, which is my bad because I thought you were interested in learning a little bit about oceanography. Just don't plaster this site with your unsubstantiated opinions as you will find them moderated out - as above.
This is a site reliant on the scientific literature. There are plenty of other sites on the internet that would welcome your unsubstantiated inexpert opinions.
-
Rob Honeycutt at 10:02 AM on 5 April 2014Earth has a fever, but the heat is sloshing into the oceans
Topal... Here's an illustration that's even more simple and easy to understand.
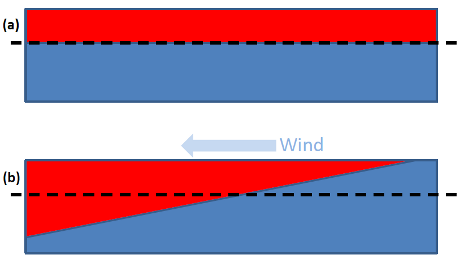
What you can see is that, it's not a matter of the heat going straight down through the ocean layers. It's about warmer waters being shifted.
In diagram (a) the upper layer is warmer than the lower layer. In diagram (b) the same amount of heat shows a cooling upper layer and warming lower layer.
[source]
-
Tom Dayton at 08:38 AM on 5 April 2014Earth has a fever, but the heat is sloshing into the oceans
topal, NASA has a short explanation with pictures.
-
topal at 08:23 AM on 5 April 2014Earth has a fever, but the heat is sloshing into the oceans
@RobP - "more heat has been pumped down into the ocean". What is the mechanism that pumps heat down without mixing it with the layers on the way down? What is the driver or this pump?
Moderator Response:(Rob P) - The driver of the 'pump' are the trade winds which result in the net transport of surface water (ocean currents) at right angles to the wind - to the right of motion in the North Hemisphere, and to the left in the Southern Hemisphere. By blowing toward the west, the trade winds 'push' surface water toward the poles. This divergence of surface water at the equator is why we have upwelling in the central and eastern equatorial Pacific Ocean.
The poleward surface currents out of the tropics collide (in the subtropical ocean gyres) with equatorward surface currents forced by westerly winds at mid-latitudes and, with nowhere else they can go, the currents are forced down into the ocean. Spin-up the wind-driven circulation and you get stronger upwelling at the equator and stronger downwelling in the subtropical gyres. Weaken the circulation and both upwelling and downwelling weaken too. With weak horizontal transport of surface water out of the tropics, the tropical ocean heats up anomalously.
This phenomenon largely exists because we live on a rapidly rotating planet. Vagn Walfrid Ekman realized the seemingly bizarre effects of rotation on the Earth's oceans back in 1905.
We do have some posts coming up on this topic, but I've been dragging my feet because the graphics and animations have to be created.
-
topal at 07:10 AM on 5 April 2014Earth has a fever, but the heat is sloshing into the oceans
Is "sloshing in and out of" the oceans a newly found phenomenon or didi it already happen in the past? If so, when was the last time energy sloshed in and sloshed out and how was it measured? What deterimines the periodicity of this phenomenon? What are the physical mechanisms causing this energy transfer in and out, in other words: where does this energy come from and how is it transfered in and out?
Moderator Response:(Rob P) - multidecadal variations in the strength of the trade winds are responsible for this variation in the rate of ocean heat uptake, see this SkS post: Unprecedented trade wind strength is shifting global warming to the oceans, but for how much longer?.
Since about the year 2000 these trade winds have been much stronger than is typical over the past century. This means that the convergence of surface currents in the subtropical ocean gyres has been enhanced and therefore more heat has been pumped down into the ocean interior than is normal. This will dramatically weaken when the trade winds weaken and, based on some theories of this decadal variability, the intense trade winds have probably shortened the length of the current negative phase of the Interdecadal Pacific Oscillation (IPO).
The oceans will still warm during the positive phase of the IPO, because ocean warming is currently driven by the increased Greenhouse Effect, but the heat uptake should be reduced. Counterintuitively, surface warming will increase much faster - because less heat is being removed from the surface ocean down to deeper layers.
Prev 730 731 732 733 734 735 736 737 738 739 740 741 742 743 744 745 Next


