


 Arguments


Recent Comments
Prev 734 735 736 737 738 739 740 741 742 743 744 745 746 747 748 749 Next
Comments 37051 to 37100:
-
chriskoz at 07:36 AM on 3 April 20142014 SkS News Bulletin #2: IPCC Report (WG II)
Very interesting (and a bit disturbing IMO) development: FF company going after 16-year old April Foul prankster:
ASIC to look into prank Metgasco email from schoolgirl Kudra Falla-Ricketts
A warning to all activists. And as usual, shame on the greedy company. Especially in light of the last paragraph quoting University of Melbourne law expert Ian Ramsay, in whose opinion, the company should have considered the minority status of the offendant and speak to them rather than going after.
-
scaddenp at 06:18 AM on 3 April 2014Climate Models Show Remarkable Agreement with Recent Surface Warming
Klapper, then perhaps you should comment on the article "It's the PDO" and update us with research on this matter.
-
NewYorkJ at 02:17 AM on 3 April 20142014 SkS News Bulletin #2: IPCC Report (WG II)
New study on drought projections:
Benjamin I. Cook, Jason E. Smerdon, Richard Seager, Sloan Coats. Global warming and 21st century drying. Climate Dynamics, 2014;
-
MA Rodger at 02:03 AM on 3 April 2014Global warming not slowing - it's speeding up
scaddenp @49.
If you perhaps restricted an Absolute Ocean Heat Content to thermal & latent energy, a figure for global oceans would be something like 1,000,000 ZJ (assuming the decimal point has behaved itself). That would be half to raise it to 0ºC and half to melt it. (I'm assuming the coefft of heat capacity at temperatures below -100ºC doesn't suddenly drop off more quickly.) There shouldn't be a lot more energy required than that. To raise a 100m mixed layer to an assumed average of 14ºC would be something like a trivial (wrt AOHC) 200 ZJ & I'd guestimate 40,000 ZJ for the rest of the ocean.
Tisdale's graph shows OHC rising from 110 ZJ to 170 ZJ and thus even for a daft-as-a-brush interpretation it has to be ΔOHC of some form. Likewise the graph at the head of the post that shows a pentadal rise of -90 ZJ to (guess what) +170 ZJ.
I'm finding the relevance to OHC of the equasion presented @43 which is for the average translational kinetic energy of a gas molicule (derevation here if you're interested) is a bit more difficult to nail down.
-
pauls at 01:12 AM on 3 April 2014Alarming new study makes today’s climate change more comparable to Earth’s worst mass extinction
Surely this terrible study should be stopped immediately!
-
CBDunkerson at 23:28 PM on 2 April 2014Cherry picked and misrepresented climate science undermines FiveThirtyEight brand
538 printed a rebuttal from Kerry Emanuel.
-
Jim Hunt at 23:23 PM on 2 April 2014IPCC report warns of future climate change risks, but is spun by contrarians
ubrew12@3 - I'm not sure that this counts as "traditional organic agriculture" exactly, but you may also be interested to read about the awkwardly named (IMHO) "biochar". See e.g.
http://forum.arctic-sea-ice.net/index.php/topic,273.0.html
and the references therein. Perhaps surprisingly, I mentioned the concept to the scientific advisor to the National Farmers Union here in the UK, and he seemed quite keen on the idea, as long as the price was right!
http://econnexus.org/food-production-fears-over-devon-solar-farms/#comment-22732 -
Klapper at 23:06 PM on 2 April 2014Climate Models Show Remarkable Agreement with Recent Surface Warming
@scaddenp #40:
1. No. I think the main influence on trends, at least 30 years long is the state of AMO/PDO. On shorter trends, say 10 years, then yes ENSO has the dominant leverage.
2. No. I think the the PDO or some 60 year cycle based on AMO/PDO as identified by Swanson and Tsonis has very large influence over the warming/cooling rate of longer trends, i.e. 30 years.
3. Yes/No. Enso like behaviour shows up in some of the (better?) models, but we can't predict Enso more than about 6 months in advance. Some have tried to predict ENSO based on solar cycles, like the late Theodor Landscheidt. The PDO appears to switch on a 30 year period so I'm not sure I agree with your second point
4. Can't remember positive vs negative states, but I think yes I agree.
As for the Nino3.4 at 1.5 (as predicted recently for this fall/winter), I think it might give some monthly anomalies of +0.6 in early 2015.
-
Klapper at 22:54 PM on 2 April 2014Climate Models Show Remarkable Agreement with Recent Surface Warming
@Tom Curtis #39:
"You then prove that that is the case be quoting an eight year trend"
I think you misunderstand. I was comparing the rolling 30 year trends over the last 8 years. Over the last 8 years the SAT and CMIP5 30 year trends have been diverging sharply. That is in contrast to the period 1965 to 2005 when the 30 year trends between SAT and the models were within much closer. The model vs. empirical warming rates were also very far apart in the 1935 to 1955 period and I've discussed that issue in the past on Skeptical Science.
-
Tom Curtis at 14:39 PM on 2 April 2014Climate Models Show Remarkable Agreement with Recent Surface Warming
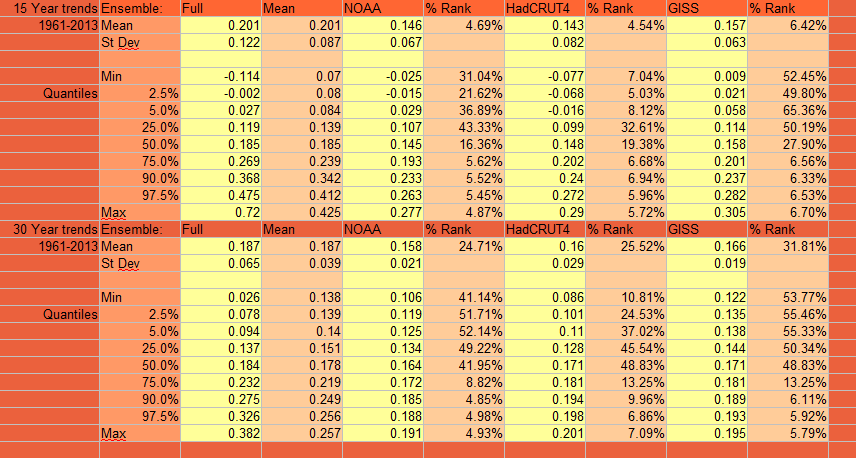
scaddenp @40, the most recent ensemble mean thirty year trend (Jan 1984-Dec 2013) for CMIP5 RCP 4.5 is 0.254 C /decade. In constrast, the mean thirty year trend for the ensemble from Jan 1961 to Dec 2013 is 0.187 C per decade. To Dec 2050 it is 0.222 C/decade. The cause of the unusually high trend is the occurence of the cooling effects of El Chichon and Pinatubo in the first half of the trend period, with no equivalent volcanism in the later half. So while a thirty year period is long enough so that typically volcanic influences will not influence the trend, that is not true of all thirty year periods.
The same can also be said about ENSO.
As it happens, the slope of the SOI over the period Jan, 1984 to Dec, 2013 is 0.287 per annum, or 0.042 standard deviations per annum. That works out at 1.26 standard deviations over the full period - an appreciable, though atypical, negative influence on the trend in global temperatures.
-
scaddenp at 14:04 PM on 2 April 2014Global warming not slowing - it's speeding up
I am also rather intrigued as to how you would define the total heat content of anything as an absolute number.
-
scaddenp at 13:55 PM on 2 April 2014Global warming not slowing - it's speeding up
Bruce, the graph was off Tisdale's blog, not from a published reference, so you would have to check with Tisdale to be absolutely sure. However, his data source can really only be NODC where their metadata explicitly state that it is delta from baseline. Furthermore, if you add NH + SH values, you will see that they range roughly 10 in 2005 to 16 in 2012 - the same values for the total OHC at those time periods shown in graph at the top of article. This graph does have a zero (and negative values), and paper it is based on say delta.
-
scaddenp at 13:34 PM on 2 April 2014Climate Models Show Remarkable Agreement with Recent Surface Warming
Klapper, just a avoid pointless controversy, do you agree with the following:
1/ ENSO is the major cause of variation from trends in the absense of volcanoes.
2/ ENSO/PDO has little/no effect on 30 trends
3/ Models cannot predict ENSO and PDO
4/ A change to positive PDO will increase SAT
And a matter of interest, what is your estimate for what an El Nino of say 1.5 will be on SAT?
-
BruceWilliams at 13:31 PM on 2 April 2014Global warming not slowing - it's speeding up
scaddenp@45
The graph Y axis is Joules, not delta Joules. And there are no zero point dates anywere on the graph. Also, the graph does not annotate that the values are change.
The heading on the Graph specifically says it is:
"NODC Annual Hemispheric Ocean Heat Content (0-2000 Meters)" which is an absolute value heading, not a change heading.
Based on all of this I would tend to disagree with you that the graph represents the change from a date range but rather is the total calculated energy content just as the heading says.
-
BruceWilliams at 13:16 PM on 2 April 2014Global warming not slowing - it's speeding up
scaddenp@44
I understand your confusion. I meant to say energy content is simply 3/2 kT. And since the energy content doubled, the temperature doubled. Mathematically that would be E_k = 3kT/2 therefor T = 2E_k/(3k) and since 2,3, and k are constatnts, the E_k doubled so the temperature doubled.
-
Tom Curtis at 13:12 PM on 2 April 2014Climate Models Show Remarkable Agreement with Recent Surface Warming
Klapper @37, I concluded my comment @36 by saying "... talk of warming rates in models "40 to 50%" to high just shows a lack of awareness of the stochastic nature of model prediction."
You then prove that that is the case be quoting an eight year trend. An eight years, I might add, that goes from neutral ENSO conditions to the strongest La Nina on record as measured by the SOI.
Just so you know how pointless it is to look at eight year trends to prognosticate the future (and hence to vet climate models), the Root Mean Squared Error of eight year trends relative to 30 year trends having the same central year is 0.17 (NOAA) with an r squared of 0.015 between the two series of successive trends. That is, there is almost no correlation between the two series, and the "average" difference between the two trends is very large. The mean of the actual differences is -0.04 C/decade, indicating that eight year trends tend to underestimate thirty year trends. The standard deviation is 0.17 C/decade, giving an error margin 1.7 times larger than the estimated 30 year trend. For HadCRUT4, those figures are -0.04 mean difference, and 0.18 C/decade standard deviation. Therefore, you are quoting a figure just one standard deviation away from the current 30 year trend, and well less than two standard deviations from the predicted trend from the models as proof of a problem with the models. The phrase "straining at gnats and swallowing camels" comes to mind.
And you still want to test models against a single period rather than test their performance across an array of periods as is required to test stochastical predictions!
-
Non-Scientist at 12:35 PM on 2 April 2014Skeptical Science Widget Hacked
Dunno, maybe the hack has an angle.
Which of these is more urgent:
1. Save people living on overdeveloped, already sinking land Florida from invasive species, heat, fire and finally a watery doom.
OR
2. Relieve chronic sneezing from 100 billion helpless wittle kitties!!!
I rest my case.
-
Jim Eager at 11:28 AM on 2 April 2014Skeptical Science Widget Hacked
Doh! We was pawned on fools day.
-
scaddenp at 11:19 AM on 2 April 2014Honey, I mitigated climate change
Ranyl, you say solar and wind are not sustainable, but implicit in the assumption is that energy required to make them must comes carbon sources. Not so - it can come from renewable sources too. The energy plans in MacKay cover all energy usage. You need carbon to make steel, because you use CO as the reducing agent, but if the only thing we used carbon for was making steel, then the environment is easily able to mop up the emissions.
Your "power-down" scenario lacks any arithmetic. You have only consider "personal" usage without considering your work usage - 2/3 of the energy use. Furthermore, unless you advocate totalitarianism, you cannot force your lifestyle on other people.
Ultimately, the only renewable source of energy is the sun, (biomass, wind are forms of solar, as is ultimately hydro), tide, and geothermal (in special areas only). Beside that is nuclear. I am surprised to hear you think that PV (with recycling of panels), is more environmentally dangerous than nuclear. Do you also advocate instant stopping of CPUs etc. because, they are the same process? You seems to have dismissed solar CSP completely (no solar panels involved, only mirrors).
The crunch about climate change is the speed. There isnt an optimum CO2 level, but change has to be slow enough that adaptation can take place. Anything that slows climate change will help. Of course, virtually nothing would be more effective than holding world population at current level or below.
-
chriskoz at 11:08 AM on 2 April 2014IPCC report warns of future climate change risks, but is spun by contrarians
wili@8,
That's an interesting news. After having read your link, I can quote the passage that apparently justifies the deletion:
“No scientific body of national or international standing maintains a formal opinion dissenting from any of these main points” is indeed a violation of NPOV, therefore claiming the deletion of the article is valid.
(emphasis original, my embedded link)
I honestly don't see any justification of the apparent violation in the rest of the article and don't understand how NPOV could have been applied to the emphasised statement. Hopefully someone can explain if there is a valid logic here or not.
-
Klapper at 11:06 AM on 2 April 2014Climate Models Show Remarkable Agreement with Recent Surface Warming
@Klapper #37:
I see my graph and last sentence did not get included. Let's try again with the graph:
-
Klapper at 11:02 AM on 2 April 2014Climate Models Show Remarkable Agreement with Recent Surface Warming
@Tom Curtis #36:
I think we have different definition of "good". However, I'm sure we can agree that over the last 8 years (since 2005), the correlation between the global SAT empirical data and the model projections is getting worse. Here is a chart which tracks the rolling 30 year warming rate (plotted at the end of the period) of all major SAT compilations against the CMIP5 ensemble. To deflect some of the criticism that the SAT datasets don't include the Arctic, I have compared the warming rate of the 80 to -90 latitude CMIP5 models, eliminating the highest Arctic from the warming projection.
Moderator Response:[PS] The image you want to post must be hosted somewhere online. You cannot embed data. See details in the HTML tips in the comments policy.
-
ranyl at 10:39 AM on 2 April 2014Honey, I mitigated climate change
"Ranyl,
What type of power do you support? I see you do not like solar or coal, can you suggest alternatives?"
"If you are going to replace the energy generated from coal, (the main problem), then you really need solar (either PV or CSP, and realistically both) or nuclear. If you think you can do it another way, then please show us your arithmetic."
My question is more how much energy can we actually produce sustainably?
Wind is renewable resource for sure but wind turbines aren't are they, just the like the sun is renewable but solar panels aren't, nor are they sustainable in any sense of the word.
Then how much more carbon emissions can we gamble to continue to provide power and transform energy provision by putting in new power production facilities, and that is all additional carbon we are gambling so all this payback is nonsense accounting to make things look good. Basically all power provision is a carbon gamble, and the size of that gamble is dependent on how risk you want to take, and even if we decided to gamble none at all the risks are still very high.
350ppm is a long long long way away, we are 400ppm and 350ppm if the Early Pliocene epoch temperature estimates are right, given 60% warming in a 100 years gives 1.8C to 3C and we'll get more than that as we've already overshot 350ppm by some way, and indeed we are at ~460ppmCO2e, which although basically equivalent to 400ppm CO2 due to sulphur dioxide shading, when that shading goes (stopping fossil fuels) then that puts back to ~460ppmCO2e and from that means 2C by 2050, even if all fossil fuels CO2 emissions are stopped 2010(1), so any extra CO2 to build future power provision is a huge risk and getting to 350ppm means a miracle.
1. H. Damon Matthews1 & Kirsten Zickfeld2 , Climate response to zeroed emissions of greenhouse gases and aerosols, Nature Climate Change Volume: 2, Pages: 338–341 Year published: (2012)
There is also a huge inertia in the system, you can't suddenly change Granny Dot's highly energy intensive house with a coal fire overnight, there is a lag to do the renovations etc, and Granny Dot makes good news headlines if cold, so a substantial part of the gamble is to keep the essentials ticking as transformational change occur.
Therefore all power capability replacement by renewables and their maintenance is part of the additional carbon gamble and not really savings CO2 emissions just over whole service time of the technology is much less of CO2 gamble for the same power generation than coal say, but still a gamble, and Nuclear upfront carbon costs are quite significant, building a nuclear power plant costs lots of carbon emissions, and if not using fossil fuels due to urgency of situation there is no payback to be accounted for.
So what power sources to replace whole current supply?
No chance of doing that if we want to get 350ppm.
Therefore powering down as much as possible becomes essential and is relevant to all on all fronts.
And then there are the other environmental impacts of the energy provision technologies and they all have several which are significant and biodiversity impacting and only biomass (very highly limited (Mackay converted 75% of land to biomass production, anyone noticed the crop failures recently (US drought 2012, Russia 2010 and so and on) so that is extremely limited especially in sustainable production ethos.
So what power production system the one with the least emissions to make and impacts for the most electricity out.
And then of course have to consider secondary thing s for the CO2 emissions budget, like how much carbon emissions will replacing the car fleet to electric costs, how toxic are those batteries, that last how not long, all that new infra-structure, rubber plantations for wheels, electronics (e waste) and so on and on, and as for planes well where do start.
Yes the choices are seemingly difficult, but how many animals, birds, and humans do car kill each year, and thus how healthier would we be, especially if we walked and cycled. Of course that would mean changing whole lifestyles and the way we do things at a fundamental level.
Where do we go from here?
Basically we power down with creative innovation or we don't and we power with through the forces of nature.
Can a low power society be healthy, and well being focused or is that dependent on techno-power generation and all the high power activities we have become too.
Anyway, long long way to go, and at present BAU is full steam ahead, there is no will to power down, thus we are facing a situation beyond adaptation and thus civilization choas is inevitable unless everyone every day starts taking this seriously in every way.
Having said that, I'm down to about 23Kwh/day, 8400Kwh year (including space heating etc)and live a good and fortunate lifestyle with warm house, good food, but I don't drive, fly, travel as little as possible, buy all clothes etc from charity shops, follow very low meat diet, insulated my home etc, have no fridge, lower power appliances (washer, (all drying by natural means), induction hob), primarily heat only rooms used at time (with biomass, don't heat bedroom in UK, stays at about 10C to 14C in winter), have solar hot water, where jumpers and long johns, buy organic, but do still use cpu for work etc, so could go further but that would need a change in work place practices etc, doable.
What power provision technology do I advocate?
Well wind has a limited place so long as not misplaced (do kill birds, bats and biodiversity impacts on oceans need repairs, rare earth magnets, paints, concrete, steel, landscape disturbance, do warm the land, and dry it, can change the localities weather, easily corroded out to sea, but despite all that can be placed well and low'ish impacts ), solar panels so far made should all be used as long as possible (I do think production of them should now stop though, just like coal mining), nuclear has a huge carbon cost but the power plants running will add lots of valuable power, hydro has potential especially in some areas, however it does cause large scale environmental issues to set up and release lots of methane in use (GHG in tropics worse than coal due to this), heat pumps not that efficient really, biomass is very limited resource, fusion would be nice but what happens to the neutron radiation and they haven't exactly cracked it yet, hydrogen need s a source and hard to store and so on, so all quite limited really.
So back to power down and prepare for intermittency, for the amount of power we use now isn't just not sustainable it is going to wipe us out.
Power down, yes involves some apparent sacrifices but also many gains, cheap, easy, low cost, definitely much healthier, no cars (healthier), and makes you more creative to get by which is actualy a good experienjce I find, and so on and so on and of course there will be 9billion people and that is some large scale low CO2 potential power source, so long as they eat a low carbon diet but that might mean much more manual work overall??? -
villabolo at 10:28 AM on 2 April 2014Skeptical Science Widget Hacked
I am seeing the proper display on the following browsers: Firefox, Google Chrome, Safari and Opera. However the "Kitten Sneezes" can still be seen on Internet Explorer.
Moderator Response:[BL] IE isn't as good at managing its cache as other browsers. It will fix itself eventually.
-
Johnny Vector at 07:40 AM on 2 April 2014Skeptical Science Widget Hacked
I think numerobis at #7 has it figured out. Took me a while too. Hey waitaminnit, it's already April 2 in Australia!
Moderator Response:[BL] One of Santa's advantages, helping to fractionally reduce his energy consumption, is that due to timezones and such, it's actually Christmas Eve for 31 hours. It gives him (and the Easter Bunny, and various other holiday workers) some extra hours to play with.
-
Paul Pukite at 07:09 AM on 2 April 2014Skeptical Science Widget Hacked
You would think that they would put that kind of energy into doing something constructive. There are lots of scientific problems that have yet to be "cracked". Why can't they hack way at that kind of stuff?
-
numerobis at 05:51 AM on 2 April 2014Skeptical Science Widget Hacked
You guys are going to be up until midnight chasing down this hack, won't you ;)
-
Jim Eager at 04:34 AM on 2 April 2014Skeptical Science Widget Hacked
I think the original and now this hack demonstrates both how effective SKS is in countering the AGW denial and obfuscation movement, and how marginal and thus how desperate that camp has become as they lose ground in the fight for popular opinion and influence on pubic policy. I expect it will get even more intense with the release of the AR5 WG2 report and the building El Nino.
-
Ladadadada at 03:41 AM on 2 April 2014Skeptical Science Widget Hacked
By the way, serving up a known compromised javascript widget from a trusted domain is irresponsible. It should be taken down until it can be confirmed to be safe.
-
Ladadadada at 03:37 AM on 2 April 2014Skeptical Science Widget Hacked
You have a really old version of nginx running on that server. 4 years out of date and 4 major versions behind the current release. Plenty of exploitable bugs in that version.
You also have a bunch of services listening on other ports, the most critical I would say is X.org listening on port 6000. The version of Apache listening on port 8080 is also quite out of date. Even for the 2.2 branch you should be more recent than 2.2.16. There's no SSL on port 8080 either, which means the password you use there is transmitted in the clear. There are also exploitable bugs in OpenSSH 5.5p1. It wouldn't surprise me if Postfix was just as out of date and exploitable.
Considering the attacker has had plenty of time to plant a rootkit, the nuclear option is the only option with a reliable outcome.
-
Paul from VA at 03:08 AM on 2 April 2014Skeptical Science Widget Hacked
The artwork on the hack is kinda nicely done though. And the energy on the big macs seems to actually be correct rather than nonsense....
April 1 in the USA and Europe.... makes you wonder...
-
bjchip at 03:01 AM on 2 April 2014Skeptical Science Widget Hacked
On second thought. Don't tell any of those details on line. Send to my e-mail if you want. Bad enough without advertising the details so people can plan how to attack.
-
bjchip at 02:59 AM on 2 April 2014Skeptical Science Widget Hacked
How did you build the app, what is the host OS and where is it hosted? There are innumerable ways to get at a service like this but the notion that if YOU change it it just changes back is intriguing. You have tripwire? selinux?
When you built it you retained your source code. No? If the hosting provider is doing its job the virtual machine it is on should be replacable in a matter of hours, not days. Given that this would be in the same EXACT configuration that the hacker has accessed and defaced however, it is not going to suffice. You do have to do something to better secure it.
It is an indication of just how desperate the denialist community is, that they are resorting to this sort of childishness.
-
wili at 00:42 AM on 2 April 2014IPCC report warns of future climate change risks, but is spun by contrarians
Speaking of denialsist spin, persisiten German pseudo-skeptics have convinced German Wikipedia to remove their article about the scientific concensus around climate change. http://climatestate.com/2014/04/01/german-wikipedia-admins-delete-article-on-the-scientific-consensus-on-climate-change/
Time to excert some counter pressure?
-
Jim Eager at 23:43 PM on 1 April 2014A Hack By Any Other Name — Part 7
I think this hack, and the current hack of the widget, show both how effective SKS is in countering the AGW denial and obfuscation movement, and how marginal and thus how desperate that camp has become as they lose ground in the fight for popular opinion and influence on government policy. I expect it will get even more intense with the release of the AR5 WG2 report and the building El Nino.
-
Tom Curtis at 23:37 PM on 1 April 2014Climate Models Show Remarkable Agreement with Recent Surface Warming
Klapper @34, consider the comparison of the ensemble mean with the three major temperature indices below. It makes it clear that the low temperatures durring 1985 and 1986 are indeed the result of El Chichon, but the elevated temperatures in 1984 are the tail end of the record breaking El Nino as I indicated. Likewise, elevated temperatures in 1987, and 1993 to 1995 are also the consequence of strong El Ninos. These all serve to reduce the observed trend relative to the ensemble mean. Likewise, the strong La Ninas in 2008 and (particularly) 2011 also reduce the observed trend, as can be clearly seen. The effect of ENSO in reducing the observed trend is, however, clearly not limited to the "tail end" as you suggest, although the "tail end" effect is probably strongest.

You say that your "...comment is about the "goodness" of the models over 30 years".
You proceed to examining that issue in a very odd way. Climate models have thousands of dependent variables that need to be examined to determine the "'goodness' of the models". Examining just one of those variables, and that over just one restricted period tells you almost nothing about the performance of the model in predicting empirical data. Using that proceedure, we could easilly decide that one model performs poorly wheras on balance across all dependent variables it may be the best performing model. Still worse, we may decide that one model performs poorly on the specific variable we assess wheras it in fact performs well, but performs poorly over just that particular period. To avoid that possibility, the correct approach is to treat each temperature series as just another ensemble member, and determine if, statistically it is an outlier within the ensemble across all periods.
Doing just that for the data I downloaded (Jan 1961 forward) over the period of overlap with emperical measurements, I find that on thirty year trends, NOAA underperforms the ensemble mean by 15.5%, HadCRUT4 by 14.4%, and GISS by 11.2% (see data below). That is, there is no good statistical reason to think that the empirical measurements are outliers; and hence no basis to consider the models to be performing poorly. Particularly given the constraints modellers are working under. (Ideally, each model should do 200 plus runs for each scenario, forming its own ensemble; and test against the empirical data as above. That way we could rapidly sift the better from the worse performing models. Alas research budgets are not large enough, and computer time too expensive for that to be a realistic approach.)
As a side note, the approximately 15% underperformance of observations relative to models is shown by other approachs as well, indicating that it is more likely than not that the models do slightly overstate temperature increases - but talk of warming rates in models "40 to 50%" to high just shows a lack of awareness of the stochastic nature of model prediction.
-
Dikran Marsupial at 21:21 PM on 1 April 2014There's no empirical evidence
gmoney there are multiple lines of evidence that show that the rise in atmospheric CO2 is anthropogenic, see Tom's excellent blog post "Climate Change Cluedo: Anthropogenic CO2" for details.
This issue is pretty much a touchstone for assessing the sanity of climate blogs. We can be very, very sure that the rise in CO2 is anthropogenic, it is one scientific question that really is settled beyond reasonable doubt, so blogs that argue the rise is natural are demonstrating a fundamental inability to face the facts.
-
MA Rodger at 19:23 PM on 1 April 2014There's no empirical evidence
Tom Curtis @197,
I think 'around 24 million' years is a bit too long for the last time CO2 was at present levels.
Certainly the comment - "highest in the last 800,000 years" - that is commonly heard is badly underselling the ocasion of reaching 400ppm. During that 800,000 years it never managed much past 300ppm (if it even managed that). And Hönisch et al (2009) extends that out to 2.1 million years by examining ocean ooze.
I have crossed swords with those who feel passionately that CO2 was above 400ppm during the Pliocene 3.5 million years ago (during the closure of the seas between N & S America & the broadening of Drakes Passage between S America & Antarctica to full deep ocean proportions). As I see it, the evidence shows that it is 'possibly' so but not 'probably' so that CO2 was 400ppm at that time.
The next candidate is the mid Miocene 13 million years ago associated with the uplifting of the Himalayas. And I would say that is a strong enough candidate to rule out an earlier date. Still, I note some of the graphics in this Yale compendium on Cenozoic CO2 do suggest an earlier date, so I may be wrong.So what is a 'safe' position? Certainly by 2100 we will be seeing CO2 unseen since 24 million years ago.
And it is also 'safe' to say that humans as a genus have never experienced CO2 this high. And also C4 plants have never been 'ecologically significant' with CO2 this high - they are quite significant today comprising about 25% of the planets biomass. -
Tom Curtis at 16:44 PM on 1 April 2014There's no empirical evidence
GMoney @195, when NOAA anounced CO2 levels of 400 ppmv "for the first time in thousands of years", it was an example of understatement:

In fact, the last time CO2 levels rose to 400 ppmv or above was around 24 million years ago. That is nearly 80 times the age of the human species, and 2,400 times longer than the existence of any civilization on Earth.
-
TonyW at 16:26 PM on 1 April 2014IPCC report warns of future climate change risks, but is spun by contrarians
The section on economic impacts seem to emphasise the uncertainty so it's disappointing that they include an estimate, which they admit is "incomplete" of a 0.2% to 2.0% cost to global income. This will immediately be leaped upon by contrarians to do nothing, even though those incomplete estimates are for 2C, with no cost estimates given for greater warming (even though it implies that there are some). I don't know if that estimate range could have been couched better to ensure that the "more likely thannot to be greater, rather than smaller" couldn't easily be left out of the quote that contrarians will use. -
scaddenp at 13:50 PM on 1 April 2014There's no empirical evidence
Gmoney, please see the Climates Changed Before (no 1 of on the myth list) and also In brief, there are many natural causes of climate change - just that they are not operating now. There are natural processes that gradually remove (over million year time scales) CO2 from atmosphere. We can tell that CO2 is the atmosphere from our emissions from two ways. One is mass-balance - add up our emissions and compare with concentration in the atmosphere. From this we learn that the oceans are still cleaning up nearly half our emissions (and pH is reducing as a consequence). At some point in the future as the ocean warms, this will stop and CO2 will be emitted instead.
The second method comes from looking at the isotopic composition in the atmosphere. Different carbon sources have different signatures, and the increased CO2 is consistant with a fossil fuel source.
-
GMoney at 13:38 PM on 1 April 2014There's no empirical evidence
Hey all, I don't have any preconceived skeptical notions. Found myself on this site as I'm legitimately seeking scientific evidence so I can feel informed.
Can someone help me reconcile the following sentence from the article....
"In June 2013, the NOAA Earth System Research Laboratory in Hawaii announced that, for the first time in thousands of years, the amount of CO2 in the air had gone up to 400ppm."
If CO2 has been at 400ppm levels thousands of years ago, doesn't that imply that humans might not be the only causal factor of high CO2 levels? There seems to be a gap in correlation/causality and I'm just legitimately curious. Thanks for any insight.
-
chriskoz at 12:46 PM on 1 April 2014IPCC report warns of future climate change risks, but is spun by contrarians
ubrew12@3,
organic agriculture has [...] but it would have to be employed everywhere traditional agriculture is currently employed
You're confusing the nomenclature here. I deduce, by "traditional agriculture" you mean the industrial scale food production lead by copious use of herbicides and fertilizers/chemicals produced from FF. To me, such practices, developped by industrial society, have nothing to do with tradition in the typical sense of the term. Perhaps some younger generation does remember only the "tradition" (i.e. food from industrial processes) they've been raised in, but for me, since I like to see things in broad perspective, such "tradition" is a misnomer.
Your "organic agriculture" (as per your link) is de facto traditional argiculture (from pre-industrial), a concept that may or may not scale-up to today's society's needs and lifestyle, but that's a different topic.
-
bruiser at 12:20 PM on 1 April 2014IPCC report warns of future climate change risks, but is spun by contrarians
(snip). Sloganeering removed.
Moderator Response:[PS] Please read the comment policy. Conformance is not optional. Do not make statements that you cannot support with references etc. It would seem you have not read the report you are making claims about. Please do so before making further comments. Use the search button top left to find already rebutted myths. eg IPCC overestimates warming If you find the debunk unconvincing, comment in the appropriate thread with supporting evidence.
-
scaddenp at 06:13 AM on 1 April 2014Honey, I mitigated climate change
MacKay seldom discusses cost - the other reason why he favoured CSP over PV is superior efficiency. His analysis remains very useful.
With 1/3 of electricity going to residential, then even you doubled the energy efficiency of all appliances, you only reduce energy consumption from 250kWh/d/p to 234. Useful, but not the answer to AGW (and fairly unachievably either). Because lighting isnt a big user, you can only gain about 1kWh/d/p by going to energy efficient bulbs. You need the MacKay-type analysis to know where significant saving can be made.
For NZ, it turned out that electricification of transport was probably the most significant place to make a change. NZer only use 7kWh/d/p for heating and cooling, while UK used 37 and I suspect US would use much more. This is probably an important area but reverse-engineering housing is expensive and probably a 100 year project. Without a breakdown of where energy is consumed, its hard to be sure.
It would also be very interesting to get a breakdown on where petroleum/gas is used. From a personal savings point of view, long distance air travel is a major energy use.
In short, while conserving energy is by far the cheapest option for AGW reduction, the large industrial useage (apparently) would suggest changing the source of energy is going to be more important for the US. Focussing on consumer energy use is putting effort in the wrong place.
-
localis at 00:41 AM on 1 April 2014IPCC report warns of future climate change risks, but is spun by contrarians
It might be a sign that we are getting somewhere when current C02 levels are a compulsory component of all weather forecasts.
-
Tom Dayton at 00:05 AM on 1 April 2014Climate Models Show Remarkable Agreement with Recent Surface Warming
Matzdj, see also Dikran's comment on the same point as mine about the ensemble mean.
-
ubrew12 at 23:44 PM on 31 March 2014IPCC report warns of future climate change risks, but is spun by contrarians
Whittemore@2: Here's my chance to promote something I read that can sequester large amounts of CO2: organic agriculture! google 'unctad: wake up before it's too late pdf' (or click this link) and check out page 25. According to that report, organic agriculture has the potential to bring CO2 levels down substantially, but it would have to be employed everywhere traditional agriculture is currently employed. Personally, I think it may be the only good news on the carbon sequestration front. I don't eat Organic food because I don't think its worth the price differential, but if this is true I'll definitely start eating it in the future. I hope Skeptical Science will look into this potential for Organic agriculture because it's potentially huge.
-
CBDunkerson at 23:33 PM on 31 March 2014Honey, I mitigated climate change
Found a nice graph of German electricity generation over time. This shows that since 2000 renewable power generation has grown from %5 of the total to ~25%. Coal use dipped slightly and then rose again, but hasn't really changed very much in total. Instead, the increase in renewable generation has come at the expense of nuclear. This is likely due to both the high cost of nuclear and the government's decision to phase it out after Fukushima. They could be much further along towards emissions targets if they had kept nuclear and phased out coal, but these results clearly show that shifting to significant renewable generation is entirely possible even over short time-frames.
 Moderator Response:
[RH] Reduced image width.
-
Michael Whittemore at 23:18 PM on 31 March 2014IPCC report warns of future climate change risks, but is spun by contrarians
It would be good if western governments could at least decide that they need to start developing processes to remove CO2 from the atmosphere. It would be a start!
Prev 734 735 736 737 738 739 740 741 742 743 744 745 746 747 748 749 Next


