Climate Science Glossary

Term Lookup

Enter a term in the search box to find its definition.

Settings

Use the controls in the far right panel to increase or decrease the number of terms automatically displayed (or to completely turn that feature off).

Term Lookup

Settings


All IPCC definitions taken from Climate Change 2007: The Physical Science Basis. Working Group I Contribution to the Fourth Assessment Report of the Intergovernmental Panel on Climate Change, Annex I, Glossary, pp. 941-954. Cambridge University Press.

Home Arguments Software Resources Comments The Consensus Project Translations About Support

Twitter Facebook YouTube Mastodon MeWe

RSS Posts RSS Comments Email Subscribe


Climate's changed before
It's the sun
It's not bad
There is no consensus
It's cooling
Models are unreliable
Temp record is unreliable
Animals and plants can adapt
It hasn't warmed since 1998
Antarctica is gaining ice
View All Arguments...


Username
Password
New? Register here
Forgot your password?

Latest Posts

Archives

The Pacific Decadal Oscillation (PDO) is not causing global warming

What the science says...

Select a level... Basic Intermediate Advanced

The PDO is an oscillation with no trend. It moves the heat through different part of the climate system but can not create nor retain heat. It can not be the cause of a long term warming trend.

Climate Myth...

It's Pacific Decadal Oscillation

"The Pacific Decadal Oscillation (PDO) is a temperature pattern in the Pacific Ocean that spends roughly 20-30 years in the cool phase or the warm phase. In 1905, PDO switched to a warm phase. In 1946, PDO switched to a cool phase. In 1977, PDO switched to a warm phase. In 1998, PDO showed a few cool years. Note that the cool phases seem to coincide with the periods of cooling (1946-1977) and the warm phases seem to coincide with periods of warming (1905-1946, 1977-1998)." (The Reference Frame)

The Pacific Decadal Oscillation (PDO) has gained some traction as an alternative hypothesis as the cause of the last century warming or at least a good part of it. More often, this hypothesis is based on the apparent visual correlation between warming periods and the positive phase of the PDO, but others ventured in semi-quantitative analysis (e.g. Dr. Roy Spencer).

Although none of them can be called strong evidence, it's worth looking at this climate feature in more details, obviously starting from describing it. The first thing to note is that the PDO, like any other oscillation, can not be the cause any long term trend. Whatever the impact of one phase might be, the opposite phase would have the opposite effect and after a full cycle the system would be brought back to where it was at the beginning. The heat can just be moved around through different parts of the system and it may even be "hidden" for some time, but after a full cycle it will be back. In other words, an oscillation does not create nor retain heat and we cannot have both an air and ocean long term warming trend.


The Pacific Decadal Oscillation


The PDO is a pattern of climate variability of the North Pacific (north of 20°) with period around 60 years. It's characterized by a positive (warm) phase with an anomalously cold central-western Pacific sea surface temperature (SST) and a warm eastern pacific SST. The opposite applies for the negative (cold) phase. Note that the terms "warm" and "cold" are definitely USA-centric.


Fig. 1: Typical wintertime Sea Surface Temperature (colors),  Sea Level Pressure (contours) and surface windstress (arrows) anomaly patterns during warm and cool phases of PDO. Left panel: positive (warm) phase; right panel: negative (cold) phase. (from JISAO).

 
Although the PDO may vary from year to year, it shows a tendency to be either in the positive or in the negative phase. To summarize its behaviour with time, the PDO index is derived as

[...] the leading PC of monthly SST anomalies in the North Pacific Ocean, poleward of 20N. The monthly mean global average SST anomalies are removed to separate this pattern of variability from any "global warming" signal that may be present in the data.

In other words, given a spatial pattern, this index describes how it changes with time. It is important to note that the "monthly mean global average SST anomalies are removed"; hence this index actually describes the "anomalous anomaly" of the North Pacific with respect to the global ocean.


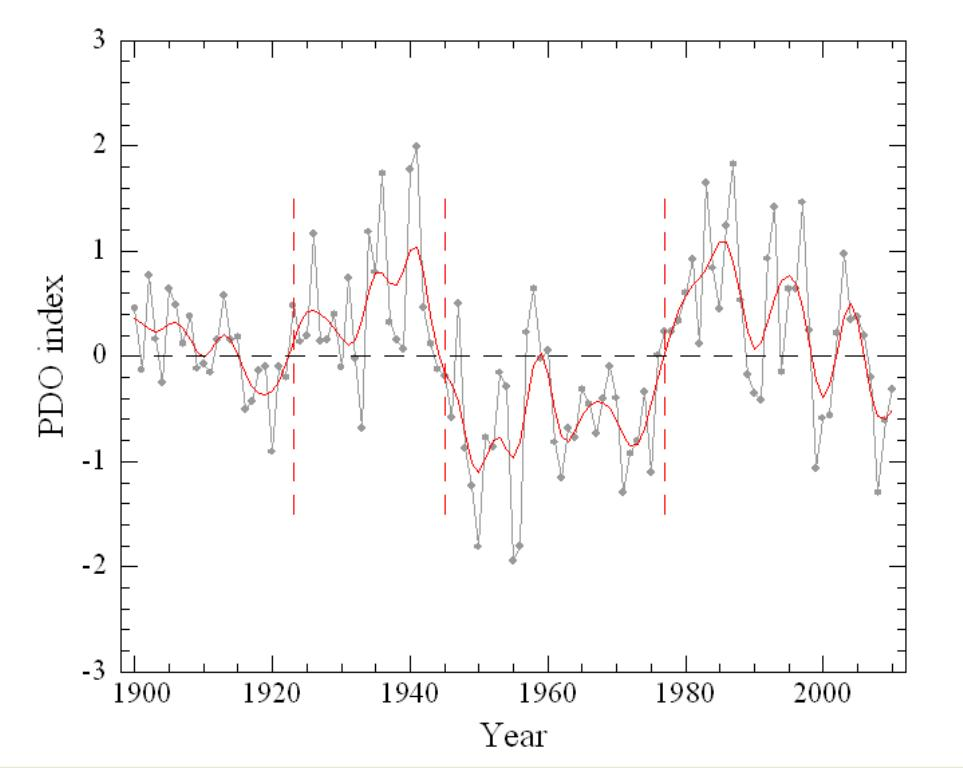
Fig. 2: annual PDO index from 1900 to 2010 (grey line). The red line is a 5 year smoothed version. Vertical dashed lines represent the three regime shifts (see text).


Three so-called regime shifts can be seen in the PDO index shown in fig 2, namely around 1923, 1945 and 1977. In particular, from the PDO index we see that between 1945 and 1977 the global ocean has warmed more than the North Pacific; this is the reason why some skeptics think that the PDO pushed the brakes on global warming.


The process to separate variability from the global warming signal implicitly assumes that the SST response to global warming is spatially uniform. This looks quite unlikely and we should expect the global warming signal to "leak" into the PDO index (Bonfils et al 2010). This fact alone should make the alarm bell ring before using it to explain global warming or even to remove the natural variability associated with PDO from observational datasets.


The causes of the PDO


It should be clear that in a strongly coupled system like our climate, nothing happens in isolation or by itself. Although a definitive answer to the question of what causes the PDO cannot be given, several studies have shown that the PDO depends on other climatic factors.


Some of you may have noticed that the PDO patterns shown in fig. 1 somewhat resemble the ENSO pattern (here in the positive phase); indeed, the PDO can be described as a long-lived ENSO-like pattern. Newman et al. 2003 have found that the PDO can be modelled as a first-order autoregressive process driven by ENSO. To make it simple, we may say that the PDO is atmospheric "noise" interacting with ENSO. Even more important, Shakun et al. 2009 obtained similar results regressing separately over the North and South Pacific. This means that the PDO is part of a more general pacific decadal variability driven by ENSO.


Schneider et al 2005 added to the picture the Aleutian low variability and the ocean circulation along the Kuroshio–Oyashio Extension (the Western Pacific counterpart of the Gulf Stream in the Atlantic Ocean). They conclude that the PDO is "a response to changes of the North Pacific atmosphere resulting from its intrinsic variability, remote forcing by ENSO and other processes, and oceanwave processes associated with ENSO and the adjustment of the North Pacific Ocean by Rossby waves".

Thus, the PDO is a response to something else; treating it as a forcing must be taken with caution.


The impact of PDO on global temperature


As noted before, some skeptics claim that the PDO is responsible for the 20th century temperature trend. Prominently, Roy Spencer used a simple energy balance model (EBM) forced by "cloud cover variations directly proportional to the PDO index values" to show that indeed much of the warming can be accounted for by the PDO alone. A zero-dimensional EBM relates the temperature change with the energy imbalance of the earth; mathematically, it can be written as


where C is the heat capacity, λ the climate sensitivity and F(t) the forcing; it can be shown that the response time of the system is given by τ = C λ .


In his post Spencer does not give many details on what he did. In particular he says that he "ran many thousands of combinations" with varying parameters and that his graph shows "an average of all of the simulations that came close to the observed temperature record"; a bit mysterious and hard to reproduce. Though, he gives an average value of the parameters: 800 m for the ocean mixing depth, λ = 0.33 °C/Wm-2 and a proportionality factor between the PDO index and forcing of 1.7-2.0 W/m-2. With these numbers it's possible to calculate ΔT from the equation above; the result is shown in the figure below as blue line.

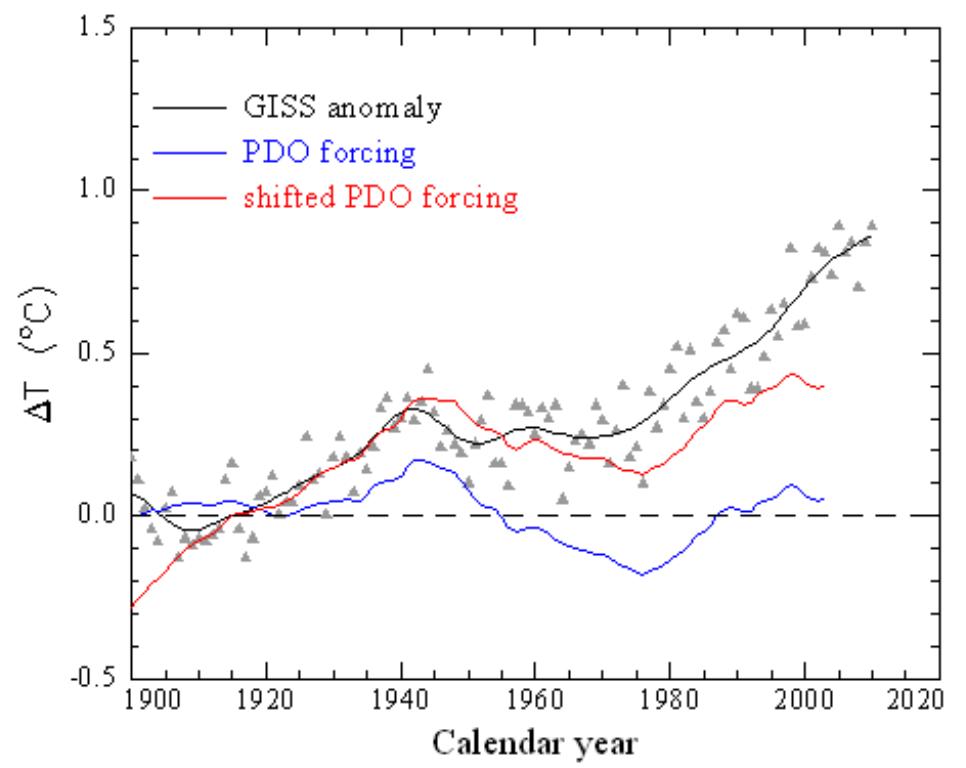
Fig. 3: triangles: GISS anomaly baselined 1900-1920; the black line is a 11-years smoothed version. Blu line: ΔT calculated from the PDO index. Red line: the same as the blue line but with a shifted PDO index.


It's evident that the calculated curve does not follow the measured ΔT much nor it is anything like Spencer's curve. Indeed it couldn't, it behaves exactly as expected given that the PDO index has no trend. The question is, then, how to reproduce Spencer's result. Answering this question requires a sort of "reverse engineering", which is prone to result in the wrong answer; nevertheless, I tried. Using the same parameters as before but shifting the PDO forcing up by about 2 W/m2, i.e. assuming an initial imbalance that large, I obtained the red curve shown in fig. 3 which this time looks pretty much like Spencer's curve.
(Note: you might want to read a similar and more authoritative explanation on how to cook a graph or Barry Bickmore's take).


If true, this is equivalent to adding a background linear temperature trend. In the end, contrary to Spencer's claim we can rule out at least that the PDO alone can explain the last century warming trend.


The PDO in the past


There has been some reconstructions of the PDO in the past. Clearly, there are no measurements available and it's also hard to find reliable proxies of the sea surface temperature in the North Pacific. Typically precipitation sensitive proxies are used.


Bondi et al. 2001, for example, used tree rings for the period from 1660 to 1992 from trees collected between Southern California and northern Baja California, a region chosen for the good correlation between tree rings and PDO. They found a dominant bidecadal cycle throughout the record up do the end of 19th century and longer periodicities, similar to those found in the instrumental record, in the 1900s associated with larger PDO-ENSO variability. Although there has been periods of reduced variability and loss of periodicity, nevertheless it appears that the PDO has been a more or less permanent feature of the Pacific Ocean variability.


One of the longest reconstructions I'm aware of is reported in MacDonald at al. 2005 which extend the record back to year 993. They found again the 50-70 years cycle but it is not stable throughout the record; in particular, this cycle is lost for extended periods during the 13th century and from the 17th to the end of the 18th century. But the more evident feature is the unusually low PDO during the Medieval period, as shown in the figure below.

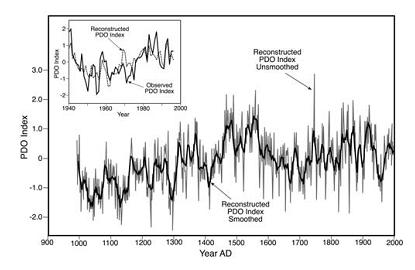
Fig. 4: reconstructed annual PDO index from AD 993 to 1996. The heavy line is the index smoothed using an 11 year moving average. Insert: the same reconstruction compared to instrumental data.


This anomalously cold eastern North Pacific is in agreement with a semi-permanent La Nina-type condition found by Mann et al. (2005). Both data and models agree on this somewhat paradoxical finding, warmer conditions over the tropical Pacific in the long run lead to the development of a prevalently negative PDO-ENSO. This can be explained (Cook et al. 2007) by the so called Bjerknes feedback, where in a warmer tropical Pacific the east-west temperature gradient increases and so does the Walker circulation, creating the conditions for the development of a La Nina.


Conclusions


In this brief post I've tried to highlight some features of the PDO that I believe are important in the context of its impact on the global temperature trend. Although it is a well recognized pattern of variability with clear implications on the regional climate, it appears that it can not be invoked to explain the current warming trend; both recent and paleo data and our understanding of PDO-ENSO tell a different story.

Last updated on 8 March 2011 by Riccardo.

Printable Version  |  Offline PDF Version  |  Link to this page

Argument Feedback

Please use this form to let us know about suggested updates to this rebuttal.

Acknowledgements

Many thanks to John Cross who co-authored this post. Thanks also to Josh Willis for his advice on this topic.

Comments

1  2  3  4  5  6  Next

Comments 1 to 25 out of 136:

  1. John and John and Josh Nice job.
  2. Roy Spencer's view on how the PDO fits the equation:, a brief part of a new paper being submitted.
  3. "Obviously the PDO as an oscillation between positive and negative values shows no long term trend. In contrast, temperature displays a long term warming trend." This PDO index shows no trend because the globally averaged SST is subtracted out. The globally averaged SST is subtracted out because it is assumed that the PDO is not effecting global SSTs but is rather a mode of variability on top of global SSTs. As far as I know this is not a robust conclusion and therefor I feel that it is misleading to compare the "trendless" PDO to globally averaged surface temperature the way that it is done in the above graph.
  4. ptbrown31, your contention is not quite correct. The actual definition is "the Pacific Decadal Oscillation (PDO) Index is defined as the leading principal component of North Pacific monthly sea surface temperature variability (poleward of 20N for the 1900-93 period)."
  5. Tom Dayton - Here is the WHOLE actual definition: "Updated standardized values for the PDO index, derived as the leading PC of monthly SST anomalies in the North Pacific Ocean, poleward of 20N. The monthly mean global average SST anomalies are removed to separate this pattern of variability from any 'global warming' signal that may be present in the data." If the "global warming" signal wasn't subtracted out of the index there would be an upward trend.
  6. ptbrown31, you have missed the point. You wrote that "it is assumed that the PDO is not effecting (sic) global SSTs," and "this is not a robust conclusion." The Pacific Decadal Oscillation does what, by definition? It oscillates! That means it goes back and forth--reverses course, then repeats. Its lack of a non-oscillating component is neither an assumption nor a conclusion, but part of its very definition. You have misunderstood the skeptic argument that blames the PDO for the "apparent" global warming long trend. That skeptic argument is not that the PDO has a long-term warming trend. Rather, the skeptic argument is that no long-term warming trend exists. At all. The skeptic argument is that the PDO's warm phases have been long and frequent enough that climatologists have mistaken them for long-term warming. The skeptic argument is that if we simply wait a bit longer, we will see PDO cooling phases long enough to wipe out all the warming we've seen since the 1850s. The counterargument is captured in the figure that you objected to. PDO warm phases are much too short to be responsible for the warming we've observed since the 1850s. There already have been counteracting cool phases.
  7. Tom Dayton - "You have misunderstood the skeptic argument that blames the PDO for the "apparent" global warming long trend. That skeptic argument is not that the PDO has a long-term warming trend. Rather, the skeptic argument is that no long-term warming trend exists. At all." Perhaps I have misunderstood the skeptical argument that this post is directly addressing but nevertheless I have indeed heard it argued that the PDO has caused the long term upward warming trend. My problem with this post is that it seems to use the fact that there is no upward trend in the PDO as evidence that the PDO could not have caused an upward trend in temperature. My problem is that this PDO index is trendless for artificial reasons. Like you said, someone defined the PDO such that it would not have a long term trend. This does not seem to be good evidence to dismiss it as a contributor to warming.
  8. If in the cool phase of the PDO, the northeast pacific is cool and the central north pacific is warm, and in the warm phase of the PDO its vice versa, how does the PDO affect global surface temperatures? According to figure 2, the PDO seems to be exerting short-term influences on global surface temperatures superimposed on a long-term warming trend. Because of the correlation between the PDO index and global surface temperatures, it seems like the negative PDO contributed to mid-century cooling, was the PDO alikely a culprit in mid-century cooling? And, since it went back to a cool phase a few years ago, could this cause global temperatures to rise less quickly over the next few decades? Could the PDO be a factor in determining who fast global surface temperatures rise on a decadal a timescale even though the long-term is obviously up? Please explain this to me.
    Response: Your question is exactly what is addressed in the post at the top of this page. Your question, and other questions you have asked on other pages, seem as if you have not actually read the posts, but only the posts' titles. Or maybe that you have read only the Basic version when there is also an Intermediate version and sometimes an Advanced version. I sincerely apologize if I am incorrect; I most definitely do not want to discourage you from asking questions or raising points for discussion. But it is difficult to answer your questions without simply repeating the contents of the posts at the tops of the pages.
  9. The post does not address the physical mechanism of how the cooling in the northeast pacific that is compensated for by a warming in north-central pacific affects global temperatures, it just states and displays the correlation. What I'm curious about is what is the exact mechanism of how cyclical changes in the distribution of sea surface temperatures in the north pacific affects global temperatures. As stated in the intermediate post, "Consequently it would appear that there is nothing fundamental about a PDO that would cause significant changes to global temperatures." But then in figure 2, there is good correlation between the PDO index and global temperatures if the linear warming trend is removed. Please describe link between the two concepts I stated in the previous two sentences. And I repeat my original questions asked in my first comment on this post. Finally, I apologize for any misunderstandings of the other questions a posted on this website. To be honest I read the posts so many times that I have memorized them. Thank you.
  10. Karamanski #9: "But then in figure 2, there is good correlation between the PDO index and global temperatures if the linear warming trend is removed." I'm not sure how good this 'correlation' actually is (for instance a PDO peak corresponds to a temperature drop ~1994), but in any case correlation does not equal causation. Isn't it equally likely that fluctuations in global temperature drive the PDO? Or that a third factor (e.g. the solar irradiance cycle) is influencing both and producing the partial correlation you think you see?
  11. The causation is what I'm curious about. Is it the PDO index that resulted in the short-term correlation or is like you suggested global temperatures that are driving the PDO index? If the PDO index is responsible for the short-term correlation what is the physical mechanism by which the PDO would affect global temperatures?
  12. Roy Spencer classifies the PDO index as a radiative forcing, because he claims that changes in the phase of the PDO are significant enough to cause a change in global cloud cover which alters the absorption of sunlight and escape of heat. Does this hold up to scrutiny?
  13. It is well known that the PDO cycle is directly related to the sun's torque cycle. (there is no correlation in this case, only a relation: the sun doesn't respond to the Earth's ocean or atmosphere; that be ridiculous. Hence, since there's only one way to relate; it's a relationship and not a correlation.) Since the solar torque cycle is thus also and of course independent of the Earth's atmospheric CO2 levels, the strongest causation is that the Earth's atmosphere (temperatures) respond to the ocean temperatures and not the other way around. Need additional proof? Look at the global atmospheric temperatures and how they responded to the strongest el nino in 1997/1998 (ENSO cycle, that in turn is dependent on the PDO and solar cycle too). That El Nino lasted from march 1997 to march 1998, peaking nov-dec 1997 through jan 1998. In addition, a la nina was already official in may 1998. However the global temperatures lag 6 months: peaking jun-aug 1998 ... Hence global atmospheric temperatures respond to global oceans temperatures. Now that causality has been established we can dig some more: I've been looking at the NOI data (SST for EL nino region 3.4) from NOAA available since 1950 and what is striking is that since the el nino from 1958, each peaking el nino has been stronger than the previous one, until the 1997/1998 el nino: 1958: 1.7, 1973:2.1, 1983: 2.3, 1998: 2.5, (2010: 1.8, trend reversal! more about that later) Doing simple linear regression; the peaks increase by 0.0017/month with an R-square of 0.97. That said, looking at la ninas since the 1950s; these increased in strength until the one in 1974 1950: -1.7, 1956: -2.0, 1974: -2.1 and have since then decreased (the peak la ninas that is) until the most recent one in 2008: 1989: -1.9, 2000: -1.6, 2008: -1.4 Interestingly, the decrease in la nina peaks is also 0.0017/month with an R-square of 0.97. The fact that both the el nino and la nina peaks increased and decreased, respectively, with the exact same slope is due to an underlying causation: the PDO. Adding PDO events (warm to cold reversals, vice versa, phase shifts, etc) to the NOI data we instantly see the following: The 2008 la nina coincides exactly with the PDO GPTC The 1998 el nino coincides exactly with the PDO phase shift from warm to cold The 1988 la nina coincides exactly with the highest PDO (LPTC) since 1934 The 1977/78 el nino coincides exactly with PDO phase shift cold to warm The 68/69 la nina coincides exactly with PDO's phase reversal The 55/56 la nina coincides exactly with the lowest PDO value since 1900 In addition, between 1950 and 1977 there were 126 la nina seasons (months) and 75 el nino seasons: PDO was cold Between 1977 and 1998 there were 53 el nino seasons and 27 la nina seasons: PDO was warm Hence, it is obvious that the enso cycle is highly correlated with the PDO which in turn is highly correlated to the sun's torque cycle. In addition, we've entered a trend reversal in ENSO strength; the 2009/2010 El Nino was less strong than the 1997/1998 one. Although it's only one data point to confirm this, it makes all sense using the above. Hence, the ocean and atmosphere is going from an el nino dominated 40 yr period that ended in 1998 to a la nina period of several decades that started in 2008. Now back to the global warming issue. 1998 was the year with the highest recorded temperature: +0.57 and global atmospheric temperatures have dropped since... See a pattern? Follows the PDO exactly. Now 2010 is on track to at least equal 1998, and is currently at +0.54. However, for October the global temperature anomaly is +0.42 deg, which is the lowest monthly temperature anomaly seen in what has been a very warm year: the atmosphere is starting to respond to the developing La Nina and is still in "El Nino mode". Just like I illustrated with the year 1998! In addition, I am sure if we subtract the el nino effect of the warming for 2010 we'll be left with little net warming if any at all.
  14. Re: WHATDOWEKNOW (13) Taking theories from some "skeptical" website run by an ex-British merchant marine dude vs Climatologists who have spent a lifetime studying and advancing the science itself? Gee, hmm, tough choice... Sorry, man. Checked my incredulity at the door. BTW, you should really double check your sources some. 1998 was perhaps the hottest year in the HadCRUT3 dataset, but the GISS and the NCDC have 2006 as hotter (see here). Smart money's on the professionals. That's what we've come to know. The Yooper
  15. I stand corrected on the two other data-sets with 2006 as the warmest year on record. On the other hand, why aren't these 3 data-sets pinpointing the same year? Nevertheless, the solar torque cycle and PDO coincide beyond a shadow of a doubt, as well as the ENSO cycle. The "dude" (calling researches that present other valid arguments "dudes" and not climatologists: those that suite your thinking... is nothing but self-justification: now go and look that up!) forecast every single la nina and el nino event correct to the month when each peaked. Using his work, this can be done years in advance. The developing la nina was already in the books... sorry but just a hard fact! It is also beyond a shadow of a doubt that the sun influences the oceans and atmosphere and not the other way around. It is also beyond a shadow of a doubt that peak el ninos and la ninas have increased and decreased respectively with the exact same and absolutely linear rate; as I have shown, paralleling the PDO cycle. It is also beyond a shadow of a doubt that ENSO events influence global temperatures. Considering that the ENSO cylce and PDO cycle's events coincide, as I clearly pointed out in my earlier comments, PDO therefore also influences global atmospheric temperatures. It is also beyond a shadow of a doubt that global (atmospheric) temperatures have increased since the 1970s but that since (1998 or 2006 as you may will) this increase has at least halted. The most important question is thus: what has caused this increase and what has caused the stabilizing to declining trend in the last several years? Given the above, PDO, ENSO and solar (torque) cycles need to be taken into account when trying to answer these questions. Once taken into account, the impact of ever increasing CO2 levels may maybe not be as dramatic as some make/may believe, which in it self is nothing wrong with. Finally, what makes you believe I am not a professional? Are you? And in science it is absolutely normal to have utterly different opinions about the same research topic! That's what drives science and our understanding forward. If everybody in the room agrees and all nod there heads; now that's when I, as a scientist, get scared, really scared. But then again self-justification is all about: don't confuse me with the facts, I've already made up my mind. Or as Lord Molson said it best: I will look at any additional evidence to confirm the opinion to which I have already come. Better yet, Richard Feyman puts it like this: "It doesn't matter how beautiful the guess is, or how smart the guesser is, or how famous the guesser is; if the experiment disagrees with the guess, then the guess is wrong. That's all there is." And that of course goes for the skeptics as well as the non-skeptics!
  16. Whatdoweknow, Different datasets provide different results due to having different base reference periods. The global temperature rise has not halted. The 2000s were the warmest decade on record, and all indicators show that the Earth is still accumulating heat. Is global warming still happening? (argument #4) Would you be scared of an entire room of scientists nodding in agreement that the Earth is a distorted spheroid?
  17. WHATDOWEKNOW wrote : "If everybody in the room agrees and all nod there heads; now that's when I, as a scientist, get scared, really scared." A room full of people agree with the theory of evolution and nod their heads when someone states that the theory is correct. WHATDOWEKNOW gets scared, really scared...
  18. I am pretty sure you know what I mean, so don't take things word for word, I am talking about scientific objectivity; scientific discussions drive science forward, not (forced) agreement. Of course those matters you point out are absolute facts that cannot be argued with (though some still like to debate evolution...). Nevertheless if somebody PERCEIVES a circle as a square, and is absolutely convinced about that; you can bring any fact to the table proofing the circle is indeed a circle, but that person will only become more steadfast in the opinion that it's a square! That's called reducing dissonance: our human mind has a very hard time agreeing with the fact we actually might be wrong and will do almost anything to stay in consonance. And by the way, it's not about being wrong; it's about not always having to be right... Not until the person actually accepts he/she is not right; then her/his mind opens up for arguments. But only then. Hence, bringing different facts to the table need to be embraced 100% objectively, open-minded and scientifically. Not instantly dismissed or ridiculed due to opinion. Continuing, since Biblio and Murphy can only comment on my phrasing and word choice; I assume they agree ENSO and PDO affect to a large extend global atmospheric temperatures. Jeee, the oceans cover >2/3 of our planet... if anything is important to understand climate change it are the oceans. So the fact thus stays that the global atmosphere responds to PDO and ENSO cycles. More proof needed? Looking at the GISS data: PEAK monthly index temps since 1990 shows that January 2007 had the highest temperature index (0.89) since 1880, again I apologize for making the mistake of claiming 1998. Almost each and every peak coincides with pre-occuring el ninos. The GISS temperature peaks between 1990 and 2007 actually increase with 0.0159C/month; exactly the same increase for el nino peaks between 1973 and 1998 (0.0159C/month) when the PDO was in it's warm phase ('77-'98). The last el nino of 1.8 already shows the trend reversal and with a PDO having shifted from warm to cold in 1998, and the peak 2010 temp is (therefore) also lower than that in 07. Why isn't it much lower? Well, since the 09/10 el nino was 2nd to last in strength since NOI records began in 1950 and since PDO has shifted to cold. Simply because we've been in an el nino dominated phase for the last 40yrs: more net-release of heat than there was heat adsorption (la ninas). Given the latent response properties of the GLOBAL atmosphere this makes perfect sense. Now this theory will be challenged rather soon with the current developing la nina (still not official since 5 consecutive seasons haven't been below an SST of -0.5C yet).
  19. WHATDOWEKNOW, are you looking at the Intermediate version of this thread ? Have you also read this thread ? Do you see the figure which shows "the contrast in trends between PDO and global temperature. Obviously the PDO as an oscillation between positive and negative values shows no long term trend. In contrast, temperature displays a long term warming trend." And, despite what you may believe, the warming is continuing.
  20. WDWK #18 The PDO merely redistributes heat. It is not a heat input into the earth's atmosphere. It's action is complex and/or chaotic. With the state of our current knowledge of the PDO it's very difficult to say what it's behaviour will be as a consequence of climate change, but it does seem to help create temperature extremes (high and low), so is an important noise component in the system. When I looked at the statistical behaviour of the PDO compared to temperature anomaly, I could not draw any conclusions from the simple methodology I employed.
  21. Warming only since 1970... You can't simply draw a straight regression line through any data that has a trend... you need to detrend it first! 1) First of all you need to de-trend the global temp since it has a has an annual cycle. 2) you then need to de-trend it based on the PDO and ENSO long term cycles (which are multiple cycles in it self and by it self) 3) after that you need to do a trend-reversal analsys to make sure that your data isn't experiencing different signs of slope for certain periods of time. 4) Finally, you can then do simple linerar regression through all the data with the same slopes (so if global temperatures have changes of sign-of-slope, then you can't run linear regression through the entire data set. That's just plain wrong, but done so frequently it's amazing. 5) Now please go and do that and please then come back and tell me how much of the increase in temp since ~1970 can be explained by any and each of the variables: PDO, ENSO, CO2 etc. ps: even the oceanic heat content has a cycle. Can you calculate it? All the data is freely available and all these statistics are relatively easy to perform for an expert. It will take some data transformation, blood, sweat and tears, but only by doing it yourself can you trust your own analysis. Please note that I've never said that there is no global warming/climate change (due to excess anthropogenic CO2 emissions). I am only conveying the importance of oceanic long term cycles on the little over a hundred year of direct observations. These cycles should not be dismissed and in fact can only help in explaining the observations. The better we understand our observations, the better we can act if necessary. Any of the trends in ENSO, PDO and global temperatures I've presented so far are solid and a fact! Still they don't say there is no human induced global warming, that's a deducted PERCEPTION. See the difference?
  22. WDWK #21 I've done this type of regression analysis on a range of variables (solar variation, volcanic activity, ENSO and CO2 from memory. I found the only statisticaly significant predictors were CO2 and solar variation for annual mean temperature data. The effect of ENSO was miserably small, even in the context that it was not statistically significant, indicating that it's involved in the redistribution of heat, not a sink/store phenomenon. In the early 20th century, solar accounted for the majority of variance, and in the late 20th century, CO2 did. There were also some interesting non-linearities in the system indicating poorer predictive power (underestimating anomaly) with increasing CO2 concentration. Happy. Feel free to replicate it. The data and some of the R code I used for analysis is here. Disclaimer: I used the methods I'm used to as a social scientist rather than more 'correct' (or convention bound to your taste) methods that an earth scientist would use, so my results, while in good agreement with the peer reviewed literature, are only really worthwhile as an impressionistic analysis. However, given that limitation, they are in good agreement with the published literature.
  23. It might be instructive to read Atmoz' take on PDO: On the Relationship between the Pacific Decadal Oscillation (PDO) and the Global Average Mean Temperature. [Edit: After much searching, I finally was able to resurrect a cached copy of this post on PDO by Tamino: Exclamation Points !!! as well as this one: PDO: the Pacific Decadal Oscillation. End edit] The Yooper
  24. As stated in the lead post, the PDO, like other identified patterns observed in other oceans, is a measure of internal processes that provides an indication of the conditions in place at any given time during the transfer of heat between the oceans and the atmosphere. In the examination of any correlation between global temperatures and the PDO, looking for any apparent trends, in both the lead post and the subsequent discussion, all that is being considered is the magnitude of each event. Whilst that may appear the simplest means of establishing correlation, it should instead be most obvious that magnitude is not the right indicator when looking for trends if there is any understanding at all, of all the processes involved in the redistribution of heat within the system. What is relevant, and where any trends should be looked for instead is the frequency of the oscillations and the amount of time the index resides in each phase. In other words, instead of merely looking for trends in how wide the refrigerator door is being opened, it is the frequency of how often it is being opened, and how long that it is being held open, or closed, that is relevant.
  25. JMuprphy #19. In my initial post I showed Dr Landsheidt's relationship between PDO and the solar torque cycle: a 178.8-year cycle that began in 1899.9 and will last till 2078. Within this cycle is the 35.8 year cycle most often revered to when comparing PDO and solar cycles. From that it is obvious that the PDO just doesn't simply oscillate randomly around 0, and that it has long-term trends at different times scales. (Nothing in nature at [such large scales] happens randomly). That said, within a cycle are upward and downward trends; Just look at a simple sinus wave with say a wave length of one 1 yr. Between 0-3 months the sinus wave has an upward trend, between 3-6 months it has a downward trend, 6-9 downward and finally 9-12 upward again. Hence; within cycles are up and downward trends. However, on average (doing linear regression for example) over one period a sinus wave with a period of 1 shows a slope of 0... So, one has to look at the appropriate periods to compare trends within cycles. That said, take a look at the temperature record from 1900 to YTD again: apply the same trend line as what the PDO exhibits (based on the available observations) to the temperature record (yielding an r2 of 0.75... ). That temperature trend line then shows decreasing temperatures from 1900 to ~1910, increasing from ~1910 to ~1945, slightly decreasing from ~1945 to ~1968, increasing ~1968 to current. And yes an r2 <1 means not all variation is explained, thus there are other variables involved. But, again I never said the PDO explains everything. But a lot. Also, I still haven't heard any argument or discussion that can explain or dismiss other than the PDO and solar cycle why el ninos and la ninas have increased and decreased in max strength, respectively, with the exact same rate with an r-square of almost 1 (see post #13) and why the increase of max el nino strength has the exact same rate as the increase of the max temperatures (see post #18) also with an r-square of almost 1 over the last 20yrs? In addition, there is nothing wrong looking at peaks, as it essentially takes away all the noise and as long as you compare rates.

1  2  3  4  5  6  Next

Post a Comment

Political, off-topic or ad hominem comments will be deleted. Comments Policy...

You need to be logged in to post a comment. Login via the left margin or if you're new, register here.

Link to this page


The Consensus Project Website

THE ESCALATOR

(free to republish)


© Copyright 2024 John Cook
Home | Translations | About Us | Privacy | Contact Us