


 Arguments


Recent Comments
Prev 739 740 741 742 743 744 745 746 747 748 749 750 751 752 753 754 Next
Comments 37301 to 37350:
-
johncl at 18:59 PM on 21 March 2014Climate skeptic claims prebunked by Keeling
You can actually read global CO2 levels in a busy city as well since on windy days the CO2 concentration would move towards the global mean. I saw a very nice graph somewhere showing this by plotting wind speed and read CO2 levels where you could clearly see the measurements approaching the global mean.
-
Tom Curtis at 17:13 PM on 21 March 201497% consensus on human-caused global warming has been disproven
Phronesis @4 & 5, it is more than a little hypocritical to not respond to one issue on the basis of limited time "one thing at a time", and then to yourself introduce additional side topics. It strongly suggests your intention is a gish gallop, where you introduce topics that are rhetorically convenient, but plead time constraints to avoid having to answer on issues where you have been shown to have been both hypocritical (leaving out relevant information, while complaining about what you consider to have been relevant information having been left out) and to misrepresent the study you quote.
-
Phronesis at 14:55 PM on 21 March 201497% consensus on human-caused global warming has been disproven
And is it true that the raters in Cook et al were not independent? I saw it here: http://rankexploits.com/musings/2013/i-do-not-think-it-means-what-you-think-it-means/
Rater independence is crucial in a study based on rater data.
-
chriskoz at 14:52 PM on 21 March 2014Lessons from Past Climate Predictions: J.S. Sawyer in 1972
And don't forget about Chralie Keeling who set ground for many of Sawyer's ideas in 1960s:
-
Phronesis at 14:49 PM on 21 March 201497% consensus on human-caused global warming has been disproven
Hi guys. One thing at a time. We have no idea what the Oreskes study did. There is no methods section in the paper. The paper is only a page long, and the part that actually deals with the study is only 126 words long.
We're told that papers that were classified as explicitly endorsing, evaluating impacts, or mitigation proposals were lumped together as endorsing the consensus. That's all we know. Note that the fact that a paper evaluates impacts does not imply endorsement or might report small impacts. We just don't know. We can't do anything with a paper when we don't know how it was done.
We also can't be converting 75% to 100% based on a paper that includes unspecified implicit criteria for inclusion into that bucket. Your logic is sound except for the implicit part. I'm not going to infer unanimity via an implicit classification scheme, much less a complete unknown classification scheme. Is this controversial?
Also, maybe your logic isn't sound after all. Let's linger on the fact that these figures are converted into "75% of climate scientist agree", or as you would have it, "100% of climate scientists agree".
How did we get there? Papers. And we ignored papers -- and scientists -- who expressed no position (by the completely unknown filtering and coding protocol Oreskes used). The sample was much smaller than Cook -- I'm not sure why. There would technical papers, heads-down so to speak, that would address narrow issues -- not really at the level of abstraction of human caused climate change, which is pretty high level. Am I correct in assuming there'd be all manner papers related to climate mechanism that would not ever have occasion to use the relevant phrases? We don't know anything about what those scientists think. We only know about the set that were included and rated by methods we have not been apprised of.
That makes me even more reluctant to say anything definite, certainly not that 100% of climate scientist think x, y, or z.
Let me know if I've missed supplemental materials on Oreskes. I didn't see anything.
Lastly for now -- we need detailed questions, nuanced views. Endorsement of the proposition that humans impact the climate or contribute to warming or are the primary cause of warming is not useful. Not if we want to do something with this knowledge, like pass laws and so forth. We need severities, probability and confidence, scientists' views on the likely roles of different forcings and feedbacks, interpretations of the pause in mean global surface temps, estimates of consequences and benefits of warming, etc. Obviously a 1 F warming by 2100 probably doesn't justify major increases in the costs of energy, for most people. I know the lower bound of IPCC 5 is higher than that, but I'd like to know what scientists think. I'd also like to see studies they have the opportunity to just express their judgments in their own words.
-
Michael Whittemore at 14:39 PM on 21 March 2014The Myth Debunking One-Pager
I find it best to start explaining the science and infer how people could mistake some section of the data but push home the facts that shows what the data is actually saying. Only then do i mention the myth and how they hide the true facts. My point is it might be best to not start with the myth but to give the information first to let them debunk the myth themselves
-
Tom Curtis at 10:26 AM on 21 March 201497% consensus on human-caused global warming has been disproven
Phronesis seems to have a problem with things not mentioned, but is carefull not to mention a few things himself. I'll come to that, but first lets look at Doran and Zimmerman (2009). Phronesis dismisses that as a survey of just 75 people, but that is false. It was a survey of 3,146 scientists. Among those scientists, overall 82% answered yes to question 2:
"Do you think human activity is a significant factor in changing mean global temperatures?"
That question is closest to the proposition tested by Cook et al (2013). That low figure is because most scientists asked were not specialists in the relevant field, and consequently had little more knowledge on the topic than any non-scientist. Of the small portion of the those surveyed who were specialists in climate science, and actively publishing in the field so that they had up to date information, 97.4% agreed with question 2. There were only 77 of those, but they were part of a much larger sample.
Turning now to Farnsworth and Lichter (2012), we find that it is a survey of scientists, 50% of whom were members of the AMS, and 50% of whom were members of the AGU, and all of whom were listed in the American Men and Women of Science. Their 489 respondents are therefore comparable to Doran and Zimmerman's 3,146 respondents, not to the 77 publishing specialists in climatology. Further (the relevant fact Phronesis did not reveal), only 41% of those 489 actively research in any aspect of global climate science.
It is not clear how those 200 scientists compare to Doran and Zimmerman's classification. For Doran and Zimmerman, and active publisher must have published at least 50% "... of their recent peer-reviewed papers on the subject of climate change". That is, by a reasonable measure, at least 50% of their research must be on the topic. In contrast, the 200 scientists from Farnsworth and Lichter need only have actively researched on any aspect of climate science, ie, greater than 0% and need not have brought the research to publication. Nor need they be specialists in climatology. They are probably best equated with Doran and Zimmerman's active publishers. For the other 289, however, the closest category would be Doran and Zimmerman's non-publishers/non-climatologists.
From all of Farnsworth and Lichter's respondents, 84% responded yes to the question:
"In your opinion, is humanly induced global warming now occuring?"
Assuming Farnsworth and Lichter's non-researchers resonded at the same rate as Doran and Zimmerman's non-publishers/non-climatologists (ie,76.6% affirmative), that represents 221 affirmative responses. That leaves only 190 affirmative responses to come from Farnsworth and Lichter's researchers, meaning that 95% of them responded affirmatively.
Given the low bar on expertise set by Farnsworth and Lichter, and the strong correlation between expertise and current topic knowledge and acceptance of AGW found by Doran and Zimmerman, that 95% is surprisingly high. It shows, however, that the results of Farnsworth and Lichter is entirely consistent with those of Doran and Zimmerman, and also of Cook et al, (2013).
Phronesis may rightly reject the assumption that Farnsworth and Lichter's non-researchers affirmed AGW at the same rate as Doran and Zimmerman's as speculative. The implication of that, however, is that no comparison can reasonably be made between their results and those of Doran and Zimmerman because they do not survey groups with the same demographics. Farnsworth and Lichter would then provide information about general scientific acceptance, but not specifically about acceptance by those with specialist knowledge in the field.
Finally, Phronesis misrepresents the results of Farnworth and Lichter on expected outcomes. The question put, and results were:
"Overall, if present climate trends continue, do you regard the likely effects of global climate change in the next 50 to 100 years as:
Trivial to Catastrophic
1–3 (NET) 13
4–7 (NET) 44
8–10 (NET) 41
Don’t Know 2
Mean 6.6 "Thus, less than half (but only just less than half) think the results of current climate trends will be catastrophic, or near catastrophic. Slightly more, but still less than half think the results will be moderate, while only 13% think the results will be trivial or near trivial.
-
TBH at 09:40 AM on 21 March 2014Temp record is unreliable
Siting is irrelevant, the trend line on consistent data collection the only matter of importance.
The evidence is un upward movement in temerature.
-
TBH at 09:32 AM on 21 March 2014Climate's changed before
We can't argue about all the evidence shows change is occurring.
To sugest human intervention in total is not playing a role, the degree an arguement only. The human intervention, in the last 100 years must be recognised.
The speed of change being the only unknown factor, and on evidence accelaerating.
-
TBH at 09:11 AM on 21 March 2014Antarctica is gaining ice
Found the article of value in terms of understanding.
The statistic seem obvious, towards,100 Giga tons of Land Ice melt, per annum, will result in 0.2mm in sea level rise, p.a. rough maths and a benchmark.
The trend line in round numbers, seem supported, by scientific evidence.
The overal position of Antartic Ice increasing correct, but peridic in nature, the desalination of the area, and lowers water tempratures, will increase freezing, perhaps minor, but will affect tidal range globally, on an annual basis.
The objective of the article that focuses on land mass ice, being the more significant component, and Sea Ice being an anual effect stated, but not quantified, as the absolute measure being the more important element.
The overall effect being higher sea levels and a slighly greater tidal range, prediction.
-
Tom Curtis at 08:54 AM on 21 March 2014Medieval Warm Period was warmer
Just assume Myles is correct of a moment. That is, assume the MWP was warmer than it currently is, and that it caused series of one hundred year droughts in the SW of the USA. It would follow that as the world continues to warm with AGW, we can expect the start of such a series of megadroughts in the SW of the USA. That should make Myles want to do all he can to avoid ongoing warming. Is that right Myles?
In fact, we already see the signs of the in the SW of the USA. From the site to which Myles linked we have this graph:
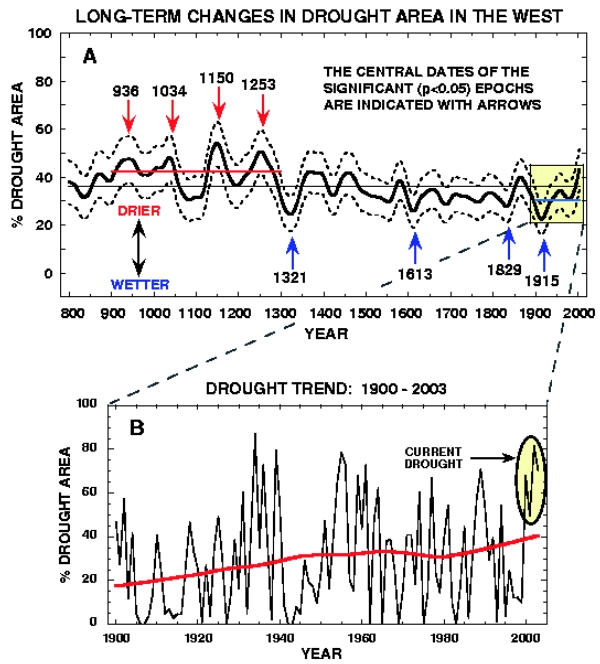
Attentive readers will notice that the drought extent in 2002 extended 80% of the area, far more than the at most 60% seen in the MWP. I understand there have been worse droughts in the area since then. Using SW US drought as a proxy for global temperature, we therefore must conclude that it is already warmer than at any time during the MWP. And expected to get warmer so that we can expect worse droughts still.
-
Rob Honeycutt at 07:56 AM on 21 March 2014Medieval Warm Period was warmer
Myles... Just to clarify, the MWP is generally believed to be a heterogeneous event, meaning it didn't happen globally and at the same time. We know that there have been periods of local warmth that exceeded global average temperature today.
What you don't find is evidence that the global temperature during the middle ages was warmer than global temperature today.
This is a very common trick pulled by fake skeptics. They will point you to a regional event during the middle ages, call it the MWP, and then compare it to global average temperature today.
-
Medieval Warm Period was warmer
Myles - You've pointed to some data on the American West, which is a region representing less than 2% of the globe. Regional variations are weather, not climate, and if you examine the global data the Medieval Warm Period was just not as warm as the world is today.
-
Daniel Bailey at 04:12 AM on 21 March 2014Medieval Warm Period was warmer
Myles, the existence of megadroughts in the past does not disprove the human-causational component of the modern warming period nor does it offer support for the denier meme "the Medieval Warm Period was warmer".
-
Myles at 03:13 AM on 21 March 2014Medieval Warm Period was warmer
http://www.ldeo.columbia.edu/res/div/ocp/drought/medieval.shtml
THE MEDIEVAL MEGADROUGHTS WERE LONGER THAN ANY RECENT DROUGHTS THOUGH. HOW DO YOU EXPLAIN THIS.?
Moderator Response:[JH] The use of all-caps is strictly prohibited by the SkS Comments Policy. Please read the Policy and adhere to it.
-
Composer99 at 02:27 AM on 21 March 2014The Myth Debunking One-Pager
Great work!
-
michael sweet at 02:05 AM on 21 March 20142014 SkS Weekly News Roundup #12A
Here is the correct link for the Pielke report.
-
michael sweet at 02:03 AM on 21 March 20142014 SkS Weekly News Roundup #12A
The American Association for the Advancement of Science (AAAS) has put out a new report. It has some very strong language for scientists. The National Academy of Sciences (USA) and the Royal Society (UK) had a similar report a couple of weeks ago. Maybe scientists have gotten tired of the deniers getting all the news headlines.
Hopefully the mainstream media will pick up on these reports. Unfortunately, Nate Silver's new website chose Roger Pielke Jr. to write about climate for them. His first post was reviewed at Think Progress. It is Pielke's typical cherry picking to claim damages have not increased.
-
MA Rodger at 00:55 AM on 21 March 2014Does the global warming 'pause' mean what you think it means?
Tom Curtis @27.
I concur with your numbers. In my haste to be done @26, I failed to convert from disc to sphere so my energy flux was 4x too big.
I would note that, while this does correct the arithmetic @25, there is still a fallacy within the logic. Solar energy can be considered in equilibrium prior to AGW. Today's imbalance is not with the solar energy (although with a warming climate, the solar imbalance could be considered now negative). What is heating the ocean is the increase in LW back radiation, a flux about twice the size of the solar flux. Thus it would be more correct to say that the oceans are actually retaining 0.16% of ocean's back radiation.
-
Tom Curtis at 00:41 AM on 21 March 2014Climate's changed before
JCMac1 and Dikran Marsupial, you will probably find this article on the thermal regulation of dinosaurs interesting. It reviews the evidence that dinosaurs maintained fairly stable core body temperatures, but did so not by maintaining a high metabolism (as do birds and mammals), but by the use waste heat from normal muscular action to warm the body, coupled with various tricks to prevent the two rapid loss of heat. Importantly, heat production by that means is one quarter to one tenth of that in animals with high metabolic rates. Therefore dinosaurs needed to dispose of only a quarter or less of the heat of a similarly sized mammal.
High temperatures are only a potential problem to humans because they restrict the rate at which heat can be disposed of. If only a quarter of the heat needs to be disposed of, a similarly sized animal can safely live with much higher external temperatures.
Further, feathers are (from memory) a feature of small dinosaurs only. There are large dinosaurs among the branch that developed feathers, but no evidence that they retained feathers into adulthood. Even at high temperatures, for animals of low body mass to retain stable internal temperatures without high metabolisms, they need substantial insulation. Hence feathers.
-
Glenn Tamblyn at 23:53 PM on 20 March 2014Global warming not slowing - it's speeding up
Micawber
A smal correction. Although around 93% of heat is going into the oceans, that does not mean the remaining 7% is warming the air. The 7% is split between melting ice, warming the ground and warming the air, in roughly equal proportions. So air warming is only about 2-2.5% of the total heat.
-
Dikran Marsupial at 23:52 PM on 20 March 2014Climate's changed before
JCMac1 I don't have my dinosaur books with me today, but I'll try and address some of the points you make:
Firstly dinosaurs adapted to various climates, but they did so over the course of tends of thousands to millions of years. It is the rate of climate change that is the problem rather than just the final temperature reached.
Most dinosaurs, like most modern reptiles are unable ti directly regulate their body temperature (which is one of the reasons that the require so much less food endergy than us mammals - so there is an evolutionary advantage to this). If heat were a serious problem, dinosaurs would not have evolved to be very large as this increases the volume to surface area ratio, which in turn makes gaining or loosing heat more difficult.
The bony plates on e.g. stegosaurus were for cooling, ..., and heating. This is fairly well known. Apparently the bony plates could be flattened in the morning to raise body to operating temperature after loosing heat overnight, but could also be made vertical and pointed away from the sun, inwhich case they could be used to cool body temperatre.
I am no aware of any suggestion that dinosar feathers were filled with liquid rather than air (or indeed that birds do this either), or how this would really help with cooling.I think it is quite likely that the feathere were for insulation, rather that cooling, helping to keep the body temperature approximately constant, rather than specifically for cooling.
Life can certainly survive a return to the sort of temperatures seen in the Cretaceous. The same is unlikely to be true of human civilisation as it exists today. There are simply too many of us for us to be able to adapt to that sort of change in our agricultural environment. I'm sure that we as a species would also survive, although there would be great hardship and loss of life along the way (mostly due to starvation). I personally don't think that makes it a case of "well that's alright then".More seriously, the "skeptics" have invented the concept of CAGW (catastrophic anthropogenic global warming) simply because the know that they can't defend the argument that there is no AGW, so a shift of the goalposts is required. AGW doesn't need to be catastrophic for it to be worthwile taking steps to mitigate against in in order to maximise the quality of life for the current generation and for the next.
The problem with the air-conditioner feather theory seems to me that the feathers themselves would insulate the skin from the area at the surface of the feathers that were actually evaporating the water. It is also not clear why this would be any better than simply sweating through the skin. Why don't birds, such as ostriches do this?
Birds will continue to fly, should temperatures reach Cretaceous levels once more, this is demonstrated by the fact that there were flying birds in the cretaceous.
-
Manwichstick at 23:12 PM on 20 March 2014Lessons from Past Climate Predictions: J.S. Sawyer in 1972
Excellent !!
-
CBDunkerson at 21:33 PM on 20 March 201497% consensus on human-caused global warming has been disproven
Phronesis, the 2004 Oreskes study found 75% of papers explicitly or implicitly supporting the consensus, 25% taking no position, and 0% contradicting the consensus. Thus, amongst papers expressing any view that study found 100% support for the consensus. Your claim that it found only "a 75% consensus level" is a logic error on your part. If you count papers which don't address the issue at all you could bring in hundreds of thousands of papers on quantum physics, stellar cartography, economics, sociiology, et cetera and claim that since none of these take any position on global warming there is less than 1% support for it... or any other subject you want to dismiss via blatantly flawed logic.
-
Phronesis at 20:17 PM on 20 March 201497% consensus on human-caused global warming has been disproven
Guys this is really bad. It would be better if you just focused on the facts.
This does not do anything to address the issue: "Thus it's perhaps not surprising that Cook et al. (2013) and its 97% consensus result have been the subject of extensive denial among the usual climate contrarian suspects. After all, the fossil fuel industry, right-wing think tanks, and climate contrarians have been engaged in a disinformation campaign regarding the expert climate consensus for over two decades. For example, Western Fuels Association conducted a half-million dollar campaign in 1991 designed to ‘reposition global warming as theory (not fact).’"
And under "The 97% Consensus Is a Robust Result", you start by citing a study that produce a 75% consensus level -- but you don't tell us that. You cite that study without even revealing the figure, which does not support the claim in your headline. Also, it was a study of abstracts, not scientists, so it's unclear why you think we can mix the two.
The other 97% finding you cite is based on 77 people, which you don't mention.
There is no survey of scientists that gives us 97%. The Cook study was about papers, and you make no mention that most of the papers included in the consensus were coded by human raters as implicitly endorsing AGW. Nor do you mention the substantial disagreement between the raters, or the fact that the disagreed upon observations were still included in the results.
Since the debate is mostly about severity and confidence levels, studies that use broad or ambiguous litmus tests of simple agreement with human caused warming are not very useful. Actual surveys are better, especially if they ask more useful, finer grained questions, like this: http://journalistsresource.org/studies/environment/climate-change/structure-scientific-opinion-climate-change/#
Try to find your 97% there. Severe outcomes are endorsed by less than half of the sample.
(-snip-).
Moderator Response:[DB] Tone-trolling snipped.
-
JCMac1 at 14:10 PM on 20 March 2014Climate's changed before
Here's a theoretical stab in the dark about a biological fingerprint that has adapted to a hotter climate in the past. Dinosaurs. Not sure if this view or even topic has been circulated but I thought I'd share it here considering people are trying to rely on the past to understand our present situation.
Searched the net to no avail on the subject of dinosaurs and their cooling systems but this doesn't mean it's not out there. Looking over some graphs it was interesting to note that during the times of the dinosaurs it was much hotter on average than it is today. So I asked myself how dinosaurs kept cool to survive and arrived at some intersesting theories that I havn't seen around yet.
1. Were the vascular bony structures protruding from some dinosaurs originally meant for cooling the dinosaur?
2. Were dinosaur feathers originally filled with liquid instead of air?
3. Were feathers on dinosaurs originally meant to act as air-conditioners to cool the dinosaurs instead of flight?
The reason these questions are on my mind right now is that some people think we can survive dinosaur age global temperatures because life existed during these temperatures. My real questions are how did life at the time adapt to those temperatures?Think about this, dry cotton insulates but wet cotton cools a person faster than if they didn't have it on to begin with. What if feathers are the same way? What if when they're hollow with air they maintain heat and help flight for today's climate. But during hotter times they could have been filled with liquid switching them to air conditioning units instead of flying and insulating units.
Not sure if this is true or even possible but it's really, really bugging me because I can imagine it as a truth and this points to the fact that not even birds will survive going back to those temperatures without them losing their ability to fly.
-
StBarnabas at 06:26 AM on 20 March 20142014 SkS Weekly News Roundup #12A
Many thanks again for this excellent weekley roundup. Of particular interest to me (a veteran MATLAB user of abour 30 years) and never having time to learn 'r' is Michael E Mann's article "Why Global Warming Will Cross a Dangerous Threshold in 2036". The code is in MATLAB - so if there are other users out there direct data and code links are repasted here (hope the mods are OK with this)
http://www.meteo.psu.edu/holocene/public_html/supplements/EBMProjections/Data/
http://www.meteo.psu.edu/holocene/public_html/supplements/EBMProjections/MatlabCode/
-
localis at 02:31 AM on 20 March 20142014 SkS Weekly News Roundup #12A
CBD - I agree that those bent on denial no matter what will deny everything no matter how farcical their arguments become. My point with the Keeling Curve is that amongst the deniers I personally have encountered none of them even knew what it is and what it represents (mainly because they have no real interest in climate change and prefer to believe anything that doesn't make them feel they have to compromise their life-style). At least it is the one piece of easily available evidence that can force them to start thinking about the real mechanics of the issue. They might then even be able to make a sensible judgement on the relevance of cow farts!
-
Tom Curtis at 01:14 AM on 20 March 2014Does the global warming 'pause' mean what you think it means?
Bruce Williams, MA Rodger:
Wikipedia gives the blast yield of Little Boy as 67 x 10^12 Joules
It also gives the surface of the Earth as having an area of 510 x 10^12 m^2
TOA insolatin is 1366 W/m^2 in a plane perpendicular to the suns rays, or 341.5 W/m^2 averaged over the Earths surface. Allowing for albedo, that reduces to 239 W/m^2. That yields a total of 121890 * 10^12 Joules per second (ie, 1.1289 * 10^17 Watts) incoming energy ignoring reflected Short Wave Radiation (SWR) over the Earth's, or the equivalent of 1819.25 Little Boy explosions. From that, we determine that the average 4 Little Boy explosions per second absorbed by the Earth (ie, incoming energy less reflected SWR minus Outgoing Longwave Radiation) is 0.22% of incoming energy less reflected SWR. That is 0.31% of energy falling on the oceans, but that figure is not particularly meaningfull as the Oceans absorb 90 plus percent of total energy absorbed. A little more meaningfull is the fact that the oceans absorb 0.28-0.3% of energy falling on the oceans.
That energy is absorbed, however, over the full depth of the ocean. It may transit the surface, but that does not mean it is stored at the surface. Therefore SST and OHC are not exactly coupled, and OHC can continue to rise when SST are steady or even falling.
-
rocketeer at 00:58 AM on 20 March 20142014 SkS Weekly News Roundup #12A
It's cow farts! (Yeah, I know, that's methane but they will throw out any argument on the theory that somebody must be ignorant enough to believe it.)
-
MA Rodger at 00:30 AM on 20 March 2014Does the global warming 'pause' mean what you think it means?
BruceWilliams @25.
Your 0.56% derivation is suffering some profound problems. Firstly you should divide by 4 (not 2) to obtain the area of a projected disc from the area of a sphere. But most important, solar radiation is ~1,366 W/sq metre. That is reduced to ~70% of that value due to albedo. To convert to W/sq mile (which you appear to be using) you would multiply by 2,589,988. And a joule is a watt.second not a watt/second. (Luckily you are only dividing by 1.) Thus I make the solar energy hitting the planet 4.8766e17 W so you are within the ballpark so far, but purely by luck rather than anything else.
Your TNT energy is marginally high & your energy per bomb marginally low. How you manage to then obtain 1,000 bombs per second I cannot imagine. It should be something like 7,000 bombs. I assume the 71% is the areal proportion of the oceans, thus some 5,000 bombsworth of solar radiation strikes ocean. If 4 bombsworth is absorbed, that would be 4/5,000 = 0.08%, or seven times less than the figure you derive. Hey, that means the last two lines of your derivation was okay. Well done!! (I should confess that my arithmetic is subject to occasional error. It is, however, not subject to systemic error.)
But then, I have a feeling you are not bothered by the actual figure. Rather you want to bash on about the recent global average SST.
-
CBDunkerson at 21:26 PM on 19 March 20142014 SkS Weekly News Roundup #12A
localis, actually the deniers have a whole collection of nonsense for denying the Keeling curve;
- Mauna Loa volcano biases the results
- The results are faked
- It doesn't matter because CO2 doesn't cause warming
- The CO2 is coming out of the oceans/volcanos/my posterior
- Doesn't matter because cloud fairies will cause a large negative feedback
- Et cetera
Granted, none of these make a bit of sense... but deniers don't need their arguments to make sense. They'll take any pretext for ignoring reality.
-
localis at 19:05 PM on 19 March 20142014 SkS Weekly News Roundup #12A
The Keeling Curve is the one solid piece of evidence that anyone can monitor daily which indisputably shows C02 levels rising. It therefore seems a great omission by those arguing for the reality of climate change that this essential information seldom enters the conversation. Even the most outspoken denier has difficulty disputing the reality (and the implications) of what it reveals.
-
Pete Wirfs at 14:17 PM on 19 March 2014A Hack By Any Other Name — Part 6
@#5 villabolo
No worries.
If you think someone might have the desire to retrieve files from your PC, the best security is to turn it off or disconnect it from the internet when it is not being used. Also you need to provide good physical security so no one picks it up and walks off with it.
Sometimes servers are easier to break into than PCs simply because they are providing data to the public 24 hours a day 7 days a week; this allows a hacker far more opportunity.
-
BruceWilliams at 13:52 PM on 19 March 2014Does the global warming 'pause' mean what you think it means?
Is this to say that the oceans are retaining about 0.56% of the energy shining onto them from the sun?
And if so, why isn't the warmer ocean causing the surface temperature to rise? I assume by global surface temperature in your above graph you are measuring both the land and ocean surface temperature, correct?
0.56% Derivation
Earth Surface area = 196.9e6 mi^2
1/2 that = 9.845e7 mi^2
Earth recieves about 3.538 W/mi^2 avg
Total = 3.483e17W/s (Joules)
Little Boy about 16 Kton of TNT
1 Ton TNT about 4.25e9 J
Little Boy = 6.8e13 J
Earth recieving 1000 Little Boys/sec
Oceans = 71% so getting 710 Little Boys per second
4 of those retained = 0.56%
-
BruceWilliams at 13:08 PM on 19 March 2014Global warming not slowing - it's speeding up
I have only been able to find 1 graph showing ocean surface temperature and it showed that from about 2005 to present the ocean surface temperature has dropped slightly. This does not jive with increased ocean surface energy. Does anyone know of any additional information available?
-
Tom Curtis at 11:42 AM on 19 March 2014Tropical Thermostats and Global Warming
Michael Sweet @21, Eschenbach also showed a map of the locations in which SST excedes 30 C (Fig 5, AOTM):

The contrast between the West and East Pacific makes it very clear that ocean currents and prevailing winds are a major factor in determining the upper reach of SST. The mixing of cold waters with surface waters of Peru makes temperatures greater than 30 C effectively impossible under current conditions, for example.
Further, and as you can see, in general 30 C SST occurs at higher latitudes in the NH than in the SH, and is more likely to occur in enclosed waters (Sea of Japan, Mozambique Channel) than in open waters. The two phenomena are related, of course. There are more enclosed waters in the NH than in the SH.
The importance of enclosed waters is not that they are shallow. (The Persian Gulf is shallow, but the other enclosed waters with high SST are not.) Rather, it is that they limit mixing with nearby cold water. That is made particularly clear in the Arabian Sea and the Bay of Bengal, which are both wide enough to present no significant restriction on mixing. Despite that they also experience very warm temperatures because the only significant body of water they can mix with are equatorial waters to the south, which are warm year round rather than just seasonally.
As noted, the impact of limited mixing explains why there are higher SST in the NH than occur in the SH, despite the fact that the SH recieves more insolation. So, as you would expect, insolation does not explain everything.
Finally, the peak daily TOA insolation is found outside the tropics, as can be seen from the wikipedia chart above. That does not result in peak SST outside the tropics (ignoring the Persian Gulf). That may be in part because outside the sub-tropics, the surface has a net energy deficit:

As a result, prolonged sunlight may not lift temperatures above levels in which they are close to energy balance. Further, at higher latitude, the rate of warming will be slower, so that temperatures will not rise to very high levels until many hours after noon, by which time insolation is falling again. These two factors complicate the issue, so that I would not like to predict the latitude of maximum SST even in a pure waterworld with no lateral mixing. It will not be confined to the equator, however, and probably shifts seasonally across the equator.
So, the situation is not a simple as my exposition above may suggest. Never-the-less, it is ironic that Eschenbach picked as his two primary pieces of evidence facts that are explicable in terms of insolation alone (ie, the shapes and relative positioning of the gaussians and the relative peakiness of summer vs winter periods.
-
wili at 11:16 AM on 19 March 2014East African countries are dealing with the impacts of climate change
It looks like crop losses will be greatest soonest in the tropics, at least for corn and wheat: http://www.desdemonadespair.net/2014/03/climate-change-will-reduce-crop-yields.html
-
michael sweet at 08:50 AM on 19 March 2014Tropical Thermostats and Global Warming
Tom,
I was amazed to see your data on sea temperatures showing the hottest temperatures outside the equatorial region. Your chart of solar insolation was a remarkable explaination of the data. I will have to look at the ocean temperature charts a lot more carefully to find the hot spots away from the equator.
-
villabolo at 08:40 AM on 19 March 2014A Hack By Any Other Name — Part 6
Forgive me for asking a foolish question but is there any danger, from all this, to our PCs?
-
pmj_rit at 07:30 AM on 19 March 2014A Hack By Any Other Name — Part 3
The above is very good practice. For the sake of your own your users' peace of mind please implement it.
-
John Hartz at 06:29 AM on 19 March 2014A Hack By Any Other Name — Part 6
will:
Check out: CO2 on Path to Cross 400 ppm Threshold for a Month by Brian Kahn, Climate Central, Mar 18, 2014
-
wili at 05:26 AM on 19 March 2014A Hack By Any Other Name — Part 6
I still don't get anything.
-
Lionel A at 05:00 AM on 19 March 2014A Hack By Any Other Name — Part 6
I got 505 errors from Climate Progress from earlier on today here in the UK, it is now back but content that was posted recently, one on the Paris smog and another on fracking related quakes in Ohio state, has gone AWOL it does seem like they are having problems.
-
wili at 04:36 AM on 19 March 2014A Hack By Any Other Name — Part 6
This is a great thread, but it does make me feel a bit paranoid everytime one of my favorite climate sites is down, as Climate Progress seems to be right now for me. Is anyone else having this problem.
OT (but is anything climate related really off topic?): The current official daily numbers at Mauna Loa now work out to the first 7-day period of above 400 ppm this year, by my calculations (but please do recheck my maths, someone).
-
Dikran Marsupial at 01:53 AM on 19 March 20142014 SkS Weekly News Roundup #7
RussR wrote: "Very well, you've made your case. I accept that I was incorrect and in light of the data, will revise my argument from "never" to "less than 0.1% of the time"."
This is the sort of facile smart-alec response that I would expect from someone who is merely trolling, and so your credibility here slips another notch. If you were genuinely interested in the science you would have made a serious attempt to revise your scientific position, rather than just add a post-hoc loophole in an attempt to limp on for a while longer. Nobody is fooled by this, I am always amazed by Tom's patience, and the difference between his attitude and your speaks volumes, pity you seem unable to follow his example.
Moderator Response:[JH] Russ R is on a very short leash with respect to compliance with the SkS Comments Policy. He has been warned multiple times about the need to comply. Any future posts he makes on the 'thermostat' hypothesis will be summarily deleted for violating the "excessive repetition" prohibition. Russ may respond to the new materials posted in response to his last post, provided his response is substantial, and not (yet again) merely dismissing contrary data because it is inconvenient.
-
Tropical Thermostats and Global Warming
Tom Curtis - The 'thermostat' hypothesis has been seriously proposed in the literature, as per Lindzen's Iris papers; and as noted in this discussion it has been shown to be false. It just doesn't hold up under examination, under the data.
But as with the ongoing Lindzen papers (repeating the same claims while ignoring published rebuttals) and with hobbyists like Eschenbach at WUWT, it appears to be (IMO) attractive as some kind of magical counteraction to AGW, something that absolves us of any responsibility to change. And as such I expect that this mythical thermostat will continue to be invoked by those in denial, or who are relatively uninformed about the science.
-
Tom Curtis at 00:11 AM on 19 March 2014Tropical Thermostats and Global Warming
KR, the ridiculousness of the "hard limit" theory as an argument against climate change is multiple. It is not supported by the basic data. It has no physical basis. It contradicts the fact that higher SST determined in the past by proxies as you note, including some as high as 40 C. It is accepted, therefore, not on any scientific basis, but out of desperation to believe that global warming cannot be harmfull. The problem is, it fails even that purpose.
Taking Palau as an example, the average SST in the warmest month in Palau is 29.2 C. The rise in SST expected at Palau in the warm scenario is 2.5 C. Consequently, with current predictions of global warming, in a BAU scenario we expect ocean temperatures in the Pacific Warm Pool to rise to 31.7 C, ie, below the "wall". That is, still below any reasonable estimate of the "wall". So even if this absurd hypothesis were true, it might possibly limit warming a little next century, but this century it is irrelevant anyway.
-
Tropical Thermostats and Global Warming
I would note that tropical sea surface temperatures are considered to have been rather higher during the Eemian, which is in and of itself sufficient data to disprove a 'thermostat' hypothesis.
-
Jim Hunt at 22:44 PM on 18 March 2014The Extraordinary UK Winter of 2013-14: a Timeline of Watery Chaos
My latest musings on this topic, including the latest from both the Met Office and the NOAA, and some pictures of the after effects here in Soggy SW England:

Prev 739 740 741 742 743 744 745 746 747 748 749 750 751 752 753 754 Next


