


 Arguments


Recent Comments
Prev 754 755 756 757 758 759 760 761 762 763 764 765 766 767 768 769 Next
Comments 38051 to 38100:
-
meher engineer at 17:25 PM on 21 February 2014Snows of the Nile: The search for vanishing equatorial glaciers
i have just seen the preview. It dii lok interesting, particularly since I have never heard of these African mountains I tried to rent the video from Vimeo but failed.
meher engineer
-
One Planet Only Forever at 13:51 PM on 21 February 2014'It's been hot before': faulty logic skews the climate debate
I postulate that:
"Faulty logic is not skewing the climate debate. The desire to benefit from burning fossil fuels is causing many people to readily accept absolute nonsense that sounds like what they wish to hear and prefer to believe. And many powerful and wicked people are trying to take advantage of that potential popularity any way they can get away with."
And to poke at another twisted piece of the pervasive and persistent irrational thought processes of that group:
"I will only change my mind about that when it is conclusively proven with absolute certainty to my satisfaction that what I prefer to believe is not to be believed."
-
PhilMorris at 10:02 AM on 21 February 2014Vision Prize: scientists are worried the IPCC is underestimating sea level rise
I suppose as a website devoted to the valuable activity of debunking denialist attitudes towards AWG you provide a valuable service, and as such, quoting 'consensus' information that supports AWG makes sense. But I suspect for a growing number of people AGW is all too real with 100% certainty, and for many people it is happening all too fast. Over the last few years there has been a continual stream of research papers that make the IPCC projections clearly conservative insofar as the pace at which climate change is occurring. In the last couple of weeks alone there were two research papers that continue the bad news.
"Recent intensification of wind-driven circulation in the Pacific and the ongoing warming hiatus" by England et. al, Nature Climate Change adequately explains that the so-called surface temperature ‘hiatus’ has been caused by abnormally strong Pacific Trade winds, which have driven heat into the deep Pacific, and that when those abnormal trade winds abate, we're in for a continued and rapid surface temperature rise.
The second is “Observational determination of albedo decrease caused by vanishing Arctic sea ice” by Pistone et. al.,
PNAS, showing that the loss of ice albedo over the last 30 years is equivalent to an additional 25% of global CO2 forcing. I’m betting that isn’t part of any of the climate models, meaning those climate models vastly underestimate the rate at which climate change is happening. Hm, prehaps that's why we may expect a summer ice free Arctic before 2020, some 30 years ahead of the latest IPCC 'projections' (Maslowski et. al, Ann. Rev. Earth Planet. Sci, 2012)I follow the literature rigorously and perhaps I’m simply blind to certain things but I have yet to see a single ‘good news’, peer reviewed research paper that has stood the test of time, and suggests that things are not as bad as they appear to be.
-
How we know the greenhouse effect isn't saturated
Agree with your comment about the non-saturation, Tom!
Unlike the MODTRAN graph, the annotations in the diagram were not added by me. They can be found in the original diagram in the article from 2007. -
Tom Curtis at 09:06 AM on 21 February 2014How we know the greenhouse effect isn't saturated
KR @69, thanks for the advise. Oddly, I read "HK", and intended to type "HK", but apparently my fingers didn't get the message.
HK @70, first, apologies for the misattribution. Second, yes I believe we are saying the same thing.
I like the new diagram from RC. It is particularly interesting to pay attention to the logarithmic scale of the absorption factor, which should drive home the very large differences in the width of the emission profile for small changes in wavelength.
One slight point about the diagram, however. It includes the two relatively highly absorbing bands at 13.9 (720 cm-1) and 16.2 microns (620 cm-1)in the region saturated at 1xCO2. From the modtran graph, they are still clearly in the wings, and become deeper (less emissions to space) with higher CO2. The statement that the region is saturated is, therefore, clearly a simplification and should not in fact be understood as saying that there is no further strengthening of the greenhouse effect across that entire band with increased concentration.
-
How we know the greenhouse effect isn't saturated
Tom Curtis @67: Your point seems to agree with what I’ve tried to explain below, which was written before I read your last post:
Agree with Dikran that your diagram is very interesting! I’ve included it in my growing collection of climate graphics.
All of you: Regarding the discussion about of “opaque” layers, have you taken into account that the absorption of IR by CO2 is extremely dependent on the radiation’s wavelength, even within a relatively narrow wavelength interval like 13-17 microns in the diagram? I think that explains why the radiating layers of CO2seem to be so diffuse, i.e. spanning over so large altitude ranges.
Take a look at this diagram from the previously mentioned RealClimate article about the saturation argument. (It also demonstrates another important aspect of this, namely the widening of the absorption band.)

As you see, there is a more than 1000-fold increase of the absorption factor from 13 to 15 microns, and at least a 100-fold reduction from 15 to 17 microns. When that is taken into account, my interpretation of the diagram in @55 is the following:
The radiation from the lower troposphere (in the 1000 ppm case) comes from the periphery of the absorption band, say 13-13.5 and 16.5-17 microns. It’s weak despite coming from fairly warm CO2 because the radiation is partly blocked by CO2 higher up.
The radiation from the middle troposphere comes from wavelengths closer to the centre of the absorption band; say 13.5-14.5 and 15.5-16.5 microns. It’s stronger despite coming from colder CO2 because much less of the radiation is blocked by CO2 higher up. The radiation from the lower troposphere on these wavelengths is completely blocked because CO2 absorbs more strongly here.
The radiation from the upper troposphere and lower stratosphere comes from the central part of the absorption band (14.5-15.5 microns), with the radiation closest to 15 microns originating in the upper part of the stratosphere (even above Felix Baumgartner!). This radiation weakens partly because the CO2 here is very cold, and partly because the wavelength interval where CO2 is able to absorb and radiate gets narrower as the altitude increases (you get less radiation from a 1 micron wide interval than a 4 micron wide). And of course, it’s impossible for any photons in the 14.5-15.5 micron interval to escape to space from the lower and middle troposphere because CO2 absorbs so strongly in this part of the spectrum.
The same goes for the curves for lower CO2 concentrations, but the altitude with peak radiation (about 8 km for 1000 ppm) will be lower while the radiation itself is higher in the warmer parts of the atmosphere.
What if the diagram in @55 had showed radiation from a narrower wavelength interval, say 14.5-15.5 microns in stead of 13-17? I’m sure the radiation within each CO2 concentration would originate from a much narrower altitude interval and look more like a “layer” in the atmosphere (more like what mgardner has claimed).
Does all this make sense, or have I missed something crucial here?
Moderator Response:[JH] Unnecessary white space eliminated.
-
Phil at 08:44 AM on 21 February 2014Vision Prize: scientists are worried the IPCC is underestimating sea level rise
william @5
On the contrary side, there have been numerous cases where the only scientist that was correct was an individual against all the other scientiests.
I wonder whether this is really true. It would be good to have examples, but to pre-empt the usually case quoted, here in Thomas Kuhn from "The Copernican Revolution" (Chapter 6)
Therefore, when in 1616, and more explicitly in 1633, the Church prohibited teaching or believing that the sun was at the centre of the universe and that the earth moved around it, the Church was reversing a position that had been implicit in Catholic practise for centuries. The reversal shocked a number of devout Catholics, because it committed the Church to opposing a physical doctrine for which new evidence was being discovered almost daily ...
-
How we know the greenhouse effect isn't saturated
Tom Curtis - Credit for that excellent MODTRAN graph goes to HK, not to me. The handle are unfortunately easily cross-read.
At least this isn't as bad as when there were three different 'Hank's actively commenting...
-
Dikran Marsupial at 08:15 AM on 21 February 2014How we know the greenhouse effect isn't saturated
Cheers Tom, that is very interesting, it makes the shapes of scaddenp's plot a little less surprising (but still interesting), and hopefully helps answer mgardners question.
-
Tom Curtis at 07:58 AM on 21 February 2014Vision Prize: scientists are worried the IPCC is underestimating sea level rise
Prufocks @7, you have touched on a point which is a slight weakness of the paper. One of the strengths of Oreskes' original study is that she identified papers that did not include direct assessment of anthropogenic contribution to global warming, and did not include them in those that affirm global warming. This did not prevent her study being attacked by "skeptics" with the argument from irrelevent denominator (ie, the claim that she overstated support for the concensus because x papers did not support the concensus because they never directly address the issue). In formulating the categories for Cook et al, Cook et al did not include a category for those papers that explicitly address attribution. Consequently "attribution papers" tend to get sorted into "impacts", "methods", and occassionally "mitigation". The problem is that we cannot, from the paper, directly address the propotion of attribution papers support consensus.
Having said that, Dana has said on a couple of times that 100% of recent attribution papers support >50% anthropogenic contribution to recent warming. I suspect his definition of an attribution paper in that comment may be a bit tighter than one that would have been used in the survey; but cannot be sure without conducting a mini survey of my own.
It should be noted that the "obvious" problem with extending the analysis beyond attribution papers to those that merely accept AGW and go on from there is not a problem at all. Scientists do not simply accept claims. If they adopt AGW as a working hypothesis, it is because they have read a significant number of relevant papers, or at least review papers, and been convinced by the evidence. I am sure there are exceptions, but not enough to distort the result. That means that a general survey like Cook et al will pick up on whether or not controversy about a theory is general, or restricted to a small group unconvinced - and clearly the later is the case.
It should be noted that the criticism of the concensus paper is coming from people who, in general, accept the OISM petition as evidence that there is no concensus, ie, they accept that the signing of an internet petition by bachelors or vetinary science, is evidence that there is no concensus of climate science; but they do not accept that detailed discussion of the consequences of anthropogenic warming by climate scientists is evidence, if those climate scientists assume global warming in that study rather than prove it from first principles.
-
Prufrocks at 07:31 AM on 21 February 2014Vision Prize: scientists are worried the IPCC is underestimating sea level rise
This will undoubtable mark me as a troll of some type (I'm only vaguely familiar with the myriad sub-types)... but I'm not, I'm a lay-person trying to keep up. I'm pretty strongly (~95%) on board with AGW and find no denialist or fake-skeptic credible. I'm somewhat confident to rebut many of their debunked claims and make the case for AGW. Though not diligent enough, my main sources are SS, RC, Tamino, Crock.
But, I'm finally spending some time with "Quantifying the consensus on anthropogenic global warming in the scientific literature" (John Cook et al 2013 Environ. Res. Lett. 8 024024 doi:10.1088/1748-9326/8/2/024024). I've downloaded the datafile.txt and randomly searching citations and going to the original articles online and, where possible, full article not just abstract.
I'm somewhat surprised to see how many of those who "endorse" AGW without quantifying it (groups 2 & 3) seem mostly to be "accepting" it as a premise for their paper rather than forming a conclusion of AGW based on their paper. Which I'm guessing is perfectly fine, appropriate & expected and the little suprise may only reflect my own naïveté. Ever since Oreskes' study – which I accept as being very strong and persuasive – and based on my own observations of the lit, without thinking I had just assumed that 'active climate researchers actively peer-review publishing,' and not rejecting AGW, were most often supporting their conclusion with more or less new data or new analysis (I recognize this does frequently apply).
Am I mischaracterizing? Am I wrong in wondering or wrong in even remarking on it? I have to believe the denialists are squawking about it.
-
Tom Curtis at 06:57 AM on 21 February 2014How we know the greenhouse effect isn't saturated
Dikran Marsupial @65, it is important to interpret scaddenp's graph in the light of KR's excellent annotated MODTRAN graph:
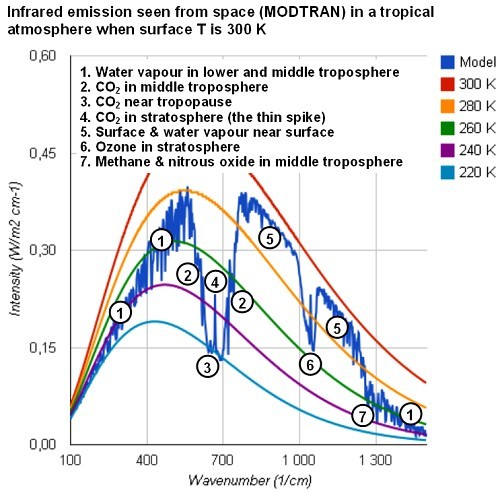
For context, Scaddenp's graph is for transmission of 13-17 micron radiation. That is radiation with a Wavenumber of 590-770 cm-1. As such it includes the full width of the notch shown in the graph above, not just the central values. A graph showing just 15 micron radiation (=666.7 cm-1) would show a much narrower effective emission profile for each concentration, and indeed, would show an altitude such that below that altitude, emitted IR radiation is nearly completely absorbed. In contrast, a graph of just 13 or 17 micron radiation would more closely resemble something like the 100 ppmv profile (I also do not have the chops to calculate it, and would need to do so to be sure).
Looking carefully at Scaddenp's graph, you will show that all curves have a right skew, so their mean value of emission is higher than their modal value. That makes things slightly awkward in that we need to guesstimate (if we cannot calculate) that mean value in relating it to the atmospheric profile shown by KR. However, in general the curve of a particular wave number in the 590-770 band will have an effective emission profile with a mean altitude of emission equivalent to the 1000 x (300- brightness temperature)/6.5. As such, even the emission profile of CO2 with a wave number equivalent to the bottom of the trough is not shown on Scaddenp's graph.
Quoting mgardner, he wrote:
"For some altitude h (e.g. 5 km), and for some wavelength (lambda), I think there is an altitude h-x such that the number of such (lambda) photons emitted from a plane at that level (h-k) which reach h is negligible."
(My emphasis)
As I have noted, at 15 microns (666.7 cm-1), that is correct. Indeed, at 15 microns absorption is so strong that I have seen a 15 micron spike in atmospheric spectra recorded in an aircraft from the amount of warmed, cabin air between the window and the instrument (much less than a meter). It is probably also true for the plateau in emissions on either side of 15 micron spike (which has a mean altitude of emission in the tropopause). However, it is not a usefull formulation for CO2 emission in general, because of necessity it will neglect the wings were the important action is occuring with respect to increases in CO2 concentration. On the other hand, in simplified models and discussions, climate scientists treat all emissions as coming from the mean altitude of emission - a simplification that is surprisingly accurate (I am told).
-
Rob Honeycutt at 05:44 AM on 21 February 2014Vision Prize: scientists are worried the IPCC is underestimating sea level rise
William... Definitely, consensus is not how science progresses. But consensus is how we can evaluate relative risk for things we can never have perfect knowledge of.
What surveys like this give us is a method by which to make value judgements required in order for action to take place.
-
william5331 at 05:23 AM on 21 February 2014Vision Prize: scientists are worried the IPCC is underestimating sea level rise
I'm still uncomfortable with surveys of scientists to see how many believe in one thing or another. On the contrary side, there have been numerous cases where the only scientist that was correct was an individual against all the other scientiests. I'm not suggesting that that is the case here. The evidence for climate change and it's likely effects are pretty overwhelming and, I think, grossly underestimated but consenses is not part of science.
-
How we know the greenhouse effect isn't saturated
mgardner - I'm afraid you're mischaracterizing my posts (and perhaps mixing them with others, as I have not referenced Beers law). I've found your requests for 'opaque' layers quite difficult to decipher, in part as (a) there has been no definition of 'negligible' stated, (b) path length increases as a continuum with decreasing GHG concentration/pressure, and (c) you've kept asking about 'opaque layers' while stating that you think layers are not a proper way to think about the matter - the combination of those factors making it impossible to suggest any dividing lines. Or, quite frankly, for me to follow what you have been asking for. I have not intended to be rude - just trying to answer the questions as I understood them.
The discussion appears to be progressing now that there is sufficient understanding of terms and of your queries - I will leave you to that.
-
Dikran Marsupial at 04:03 AM on 21 February 2014How we know the greenhouse effect isn't saturated
mgardner wrote "For some altitude h (e.g. 5 km), and for some wavelength (lambda), I think there is an altitude h-x such that the number of such (lambda) photons emitted from a plane at that level (h-k) which reach h is negligible."
My reading of scaddenp's graph suggests that for 400ppmv, the maximum power of photons in this band is emitted from about 4km in altitude (about 0.44 watts m^-2), but there is about 0.24 watts m^-2 of photons in this band that reach space directly from the surface, which is far from negligible. Thus there is no truely opaque layer (in this sense) from which the radiation of IR photons from the surface is negligible, at least for current atmospheric CO2 concentrations. Or to put it another way, whatever the values of h and x are, they are too large to fit within the Earths actual atmosphere.
I suspect you really need to use something like MODTRAN to get a definitive answer to this question, however the realclimate article I mentioned earlier in the thread provides this diagram:
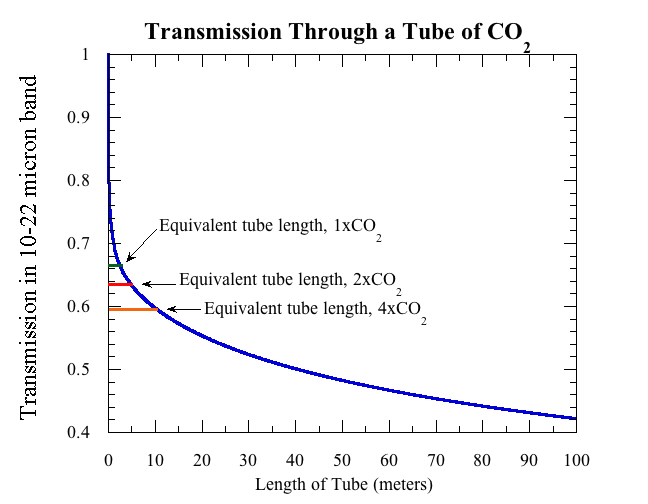
Apparently at 300ppm, the CO2 in a column of the Earths atmosphere is equivalent to a 2.5m tube of pure CO2 (at sea level pressure and 20C). The graph shows the proportion of light transmitted through the tube as a function of length. In this case the transmission is still falling appreciably from tube lengths corresponding to 1xCO2 to 4XCO2, which suggests that there isn't a truely opaque layer within the tube in this thought experiment either. Note that this is not really realistic (as the article points out because not all of the atmosphere is at 20C or sea level pressure).
I'd say it was a mixture of (1) and (3), I don't (currently) have the chops to perform the calculations, but hopefully I can help in getting into the ball-park and help to better formulate the problem (you do have the required security clearance though ;o).
-
mgardner at 03:24 AM on 21 February 2014How we know the greenhouse effect isn't saturated
DM@63
That pesky "real world" is intruding on our fun little universe here, so I will try to briefly give you something to think about while I take a little time to attend to it. I don't think we're quite communicating yet...
Here's what I mean when talking about an opaque layer. And please remember, I am setting up a simplified, idealized case to further my understanding-- I'm gathering up elements from which I can synthesize an accurate model that works for me, not anyone else. Once I do that, you are free to tell me that I am wrong or that yours is better.
Scaddenp's graph refers to emissions "from a hundred meter layer".
I treat that as a plane.
In my earlier reply to KR, I said something like:
"For some altitude h (e.g. 5 km), and for some wavelength (lambda), I think there is an altitude h-x such that the number of such (lambda) photons emitted from a plane at that level (h-k) which reach h is negligible."
and
"I don't know what x is, or how many subsequent such layers descending from h-x there may be."
To my mind, there are three legitimate ways to answer that:
1) "You're wrong, there's only one (or no such) layer and it goes to the surface. Here's the calculation using this wavelength and Beer's law." (KR's response, sans the calculation, which to me is obviously wrong.)
2) "You are correct, I come up with (n) such layers, and the thicknesses vary thusly as we descend."
3) "Sorry, I don't have the chops to provide you with the numbers you are looking for." or maybe "Sorry, you don't have the required security clearance?"
This can also be applied to the question of how the amount of radiant energy embodied in those photons is attenuated, as measured by radiant energy arriving at h.
Hope that's clearer. I will be back and try to discuss the more general case.
-
DSL at 02:50 AM on 21 February 20142014 SkS Weekly News Roundup #7
Not engaging in the conversation directly; just tossing in a few recent and relevant references to supplement Tom's points:
Zhou et. al 2013 - "An Analysis of the Short-Term Cloud Feedback Using MODIS Data."
Evan & Norris 2012 - "On global changes in effective cloud height."
Keep in mind that ENSO plays a significant role in triopical cloud top height and that the measurements discussed in Evan & Norris cover slightly more than the last decade, a decidedly La Nina-ish period. Nevertheless, after accounting for a systematic error in sampling, a positive trend in CHT is found for the period.
-
jeff_from_ky at 00:48 AM on 21 February 2014Arctic sea ice has recovered
Just wondering how the dismissives will fit this news into their "60% recovery" meme. Nah, they won't, they'll just quit talking about it.
Arctic Sea Ice Sits at Record Low for Mid-February - Climate Central
-
Tom Curtis at 00:42 AM on 21 February 20142014 SkS Weekly News Roundup #7
Russ R @74, before discussing your points, I think we need a point of clarrification about feedbacks. Specifically, feedbacks are responses to changes in temperature. As such, any feedback response produces a further response, which in turn produces a further response and so on. In principle this reiteration proceds for ever, but in practise, after a few repetitions the feedback response is swamped by normal variability and it gets washed out of the system.
The final temperature response to a given initial change of temperature is given by the formula:
ΔT = T0/(1-Σg)
where ΔT is the final change in temperature, T0 is the initial change in temperature, and Σg is the sum of gains for each individual feedback, ie, gwv, glr, gcl, galb etc.
If gxx is positive, then it reduces the denominator, and increases the final temperature response. Ergo, it is a positive feedback. Conversely, if gxx is negative, then it increases the denominator, and hence decreases the final response. It should be obvious from this that so long as Σg < 1, then ΔT is finite, and the total feedback response will eventually lead to a stable condition. Consequently, there is no need for a positive feedback that some negative feedback should overwhelm it to stop it running away. That is only necessay if the sum of the feedback gains is greater than 1. In simpler terms, if each iteration of the feedback response results in a further temperature increase less than the preceding temperature increase, the response will self damp even though the net feedbacks are positive.
Turning now to the details of your post:
Ice Albedo: The IA feedback involves not just the change in albedo, but the actual advance of the ice. Between approximately 80 and 20 degrees of latitude, the surface temperature rises by approximately 1 degree C per 145 km advance towards the tropics, requiring a 1 C fall in temperature for the ice to advance that distance. The IA feedback will be determined by the balance that allows the fall in temperature to result in a sufficient advance in the ice, and consequent increase in albedo to account for it. Among the complexities are that ice sheets do not advance significantly over water (which limits their advance to the NH), and that polar amplification will make the temperature/latitude slope steeper with a cooling climate, thereby dropping temperatures at the poles and making the initial advances easier, but also requiring a greater decrease in temperature for each km of ice advance. That later effect weakens the IA feedback effect, which in turns means your BOE calculations are over calculations of the strength of the effect.
Water Vapour: You mount several counter arguments against the possibility of any significant increase in the strength of the water vapour feedback. The first is based on geometry. It incorrectly assumes that:
1) The greenhouse effect due to water vapour in the tropics is saturated, such that in increase in the strength of the WV feedback can only occur by an advance to the poles. But, in fact, the strength of the greenhouse effect of a substance depends on the altitude of effective emission to space of that subtance. In the tropics that altitude for WV is about 4-5 km, but the tropopause is about 18 km, allowing a considerable increase in height, and hence strenght of the WV greenhouse effect.
2) The brightness of OLR is a function of solar incident angle (effectively the pink line), whereas it is a function of temperature at the effective altitude of emission (effectively the green line), which is much more even between tropics and polar regions:

Consequently your calculation of the upper limit of the WV feedback is completely in error. There is in fact no practical upper limit on the strenght of the WV feedback.
You further argue that the formation of clouds, and a purported limit on sea surface tempertures at about 30 C forms '... an effective "wall" ' to increasing WV feedback strength.
I will first note that the formation of clouds is not a "wall" to the WV feedback, but an independant feedback. Further, your assumptions about that feedback are simplistic. An increase in WV concentration may, for example, result in more rapid formation of heavy rain drops, so that clouds dissipate by rainfall more rapidly. More certainly, they will result in larger diameter cloud particles, an effect which reduces cloud albedo. Further, much of the additional cloud may simply be in the form of thicker clouds due to stronger updrafts, resulting in no significant increase in albedo at all. In sum, while it is probable that increased WV will result in more cloud and a greater cloud albedo, the strength of that increase is far from certain with an number of known factors complicating the issue.
What is worse, you simply ignore the cloud GreenHouse effect. Again, stronger updrafts created by the condensation of more WV will probably result in higher upper boundaries of clouds, and more high cloud, both of which significantly increase their greenhouse effect. The balance of the change in GHE and change in Albedo from clouds is not known, but likely a small positive forcing. Treating clouds simplisticly to arrive at a conclusion of a strong negative feedback is not science.
Even worse is your treatment of sea surface temperatures. You simply claim as fact, and without evidence that approx 30 C is an upper limit on sea surface temperatures. That is an extraordinary claim, as there is literally no mechanism to drive such a limit. It is the more extraordinary as SST as high as 32 C and above have been observed on the Earth's surface:

(The 32 C regions stand out better at original resolution)
That is 5 C above the average tropical SST, so that no higher temperatures have been observed is easily explained in that 5 C increase above average is huge in a body with the thermal inertia of large stretches of ocean - particularly given that winds cause turbulence to deptths of 100 - 700 meters, mixing surface with cooler below surface waters on an ongoing basis.
Not only are SST above 30 C known today, much higher SSTs were known in the past:
"The middle Cretaceous (125–88 Ma) greenhouse world was characterized by high atmospheric CO2 levels, the general absence of polar ice caps, and much higher global temperatures than at present. Both δ18O-based and model-based temperature reconstructions indicate extremely high sea-surface temperatures (SSTs) at high latitudes. However, there are a number of uncertainties with SST reconstructions based on δ18O isotope data of foraminifera due to diagenetic overprinting effects and tenuous assumptions with respect to the δ18O value of Cretaceous seawater, the paleoecology of middle Cretaceous marine organisms and seawater pH. Here we applied a novel SST proxy (i.e., TEX86 [tetraether index of 86 carbon atoms], based on the membrane lipids of marine crenarchaeota) derived from middle Cretaceous sedimentary rocks deposited at low latitudes. The TEX86 proxy indicates that tropical SSTs in the proto–North Atlantic were at 32–36 °C during the early Albian and late Cenomanian–early Turonian. This finding agrees with SST estimates based on δ18O paleothermometry of well-preserved foraminifera as well as global circulation model calculations. The TEX86 proxy indicates cooler SSTs (27–32 °C) for the equatorial Pacific during the early Aptian, which is in agreement with SST estimates based on δ18O paleothermometry."
(My emphasis)
Frankly, I feel as though you are devolving to argument by mere assertion. You have now merely asserted as fact several false claims, including that SST do not exceed approx 30 C, and that cold and warm runaway events do not happen. Your only counter argument to refutation of those points has been an appeal to a false account of positive feedbacks.
-
Dikran Marsupial at 00:41 AM on 21 February 2014How we know the greenhouse effect isn't saturated
mgardner I am sorry that my posts have been interpreted as being adversarial or dismissive, they really were not intended that way, the intention was to try and warn that your questions were likely to lead down what appears to me to be a blind alley.
Note back on post 37 I tried to explain that a two layer model wasn't an accurate representation of reality, and by post 39 suggesting that it might be better to think of it in terms of a p.d.f. of the heights at which IR photons are successfully radiated. Note scaddenp's interesting diagram supports the idea that there isn't really an "opaque" layer at all, at least at current CO2 levels (which is why I was suggesting concentrating on the photons that actually escape the atmosphere).
Your use of terminology has not been all that clear, you write:
"... I clearly distinguish between "absorption of all possible photons from the emitting plane" (opacity, which is the essence of the original myth about 'saturation',) and "a reduction of the energy emitted from that plane as it traverses the interval" (attenuation). I don't use words randomly.
however your original question (repeated in that post) was
"And what the attenuation would be for IR radiation in some CO2 band through that 'layer'."
Specifying IR radiation in that band makes the use of attenuation ambiguous as the energy entering that region as IR in those bands that is absorbed is not necessarily transferred to the "translucent layer" as IR in those bands, and the IR that is emitted into space from the "translucent" layer largely comes from the bulk heat energy of the atmosphere at that height, which does not primarily come from IR in the absorption bands, but from convection. This means that the best definition of attenuation that works for this sentence as stated is in terms of attenuation of the photons themselves.
I'd be happy to resume the discussion on a non-adversarial, friendly tone, misunderstandings happen, especially in electronic forums!
-
mgardner at 00:21 AM on 21 February 2014How we know the greenhouse effect isn't saturated
Bob Loblaw et al:
First, I'd like to explain why I get testy about some responses.
I'm a Spherical-Cow-Physics kind of guy. In learning, problem solving, and in teaching, I do (did) as I was taught a long time ago and try to build understanding from the ground up. Now, I realize that's my particular style, and there's no obligation for anyone to respect it. However, it is a matter of principle when it comes to teaching practice-- 'setting up the problem' requires figuring out the 'position' of the student before 'applying forces to achieve desired displacement'.
In this case, I'm playing the role of the student, but I'm getting this adversarial and dismissive attitude about my questions. Perhaps it's understandable since you've been dealing with 'skeptics' a lot, but even when I think someone is likely a 'skeptic', I ask questions to pin down where he's coming from, rather than just firing off the standard litany and telling him 'you just don't get it' and 'your questions are irrelevant'.
My original comment was @28. Please note that I was not happy with the 'layer' concept that others used-- it's not my invention. Also, I've said several times that I understand both the underlying physics concepts and the complexity of the problem. But I don't have a MODTRAN in my head, so I'm asking very specific questions to help me construct a model (or analogy) that is both reasonably accurate (for myself) and simple enough to use in conversations with those who are more lay than I am.
Since this is awfully wordy, I'm going to start a couple of new specific comments on the layer concept and the overall picture.
-
mgardner at 21:50 PM on 20 February 2014How we know the greenhouse effect isn't saturated
scaddenp@55
Thank you for directly answering my question. I zoomed in on the graph and used an index card on the screen to get ~900 m for the height difference between 280ppm and 400 ppm at .4 W/m2. (Is that about right?) That would make a temp difference around 6 K?.
Holding everything constant.
I'm going to reply to others on this as soon as I get the image insertion thing to work. That will require a bit more coffee.
-
Doug Hutcheson at 18:39 PM on 20 February 2014Dodgy Diagrams #1 - Misrepresenting IPCC Residence Time Estimates
"the confusion would have been avoided if time was taken to actually read what was written"
Sounds like the sort of comment I used to see written on my examination papers. I learned the value of this trick (actually reading the question) at school and it continued in my life in the software industry, encapsulaed as the time-honoured answer to most questions: RTFM - read the flamin' manual!
Sadly, it seems reading is one thing and comprehension is quite another, judging by the comments I see in the blogosphere.
-
Doug Hutcheson at 18:28 PM on 20 February 2014Vision Prize: scientists are worried the IPCC is underestimating sea level rise
"Vision Prize participants may be pessimistic that we'll transition away from a business-as-usual emissions path".
Human nature and greed being what they are, I agree with that pessimism, with the codicil that the possible effects of Peak-Something may damage our ability to consume, thereby imposing a brake upon BAU. Short of Peak-Something, I forsee the world continuing to be ruled by Peak Consumption to fuel the all-powerful 'economic growth' mantra, until such time as adverse climatic effects render our vaunted Western society unviable. The fact that we can see the looming threat does not mean our lords and masters will choose to do anything to mitigate it. Homo Stupidus stupidus.
-
Bob Loblaw at 12:51 PM on 20 February 2014How we know the greenhouse effect isn't saturated
Another item that has been asked about: the relative role of convection vs. radiation in the atmosphere. In a (much) earlier comment on another thread, I provided a reference to an old paper by Manabe and Strickler (1964). Figure 1 of that paper is:

The left hand side shows a (modelled) atmosphere with no convection. The right hand side shows the same model with convective adjustment (which basically forces the model lapse rate to the observed tropospheric lapse rate). As you can see, convection in the troposphere is very significant. In the stratosphere, radiation dominates.
(The figure shows how the model converges over time to an equilibrium state as energy fluxes balance out.)
Moderator Response:[BL] External image no longer available replaced with a copy at SkS [2022-08-15]
-
chriskoz at 12:50 PM on 20 February 2014Dodgy Diagrams #1 - Misrepresenting IPCC Residence Time Estimates
Dikran, John,
This simple sink analogy debunks the "short CO2 residence time" myth. But the analogy is not realistic with relation to the Crbon Cycle figure from AR4 that you've shown. Some people, like me, may even find the analogy confusing, because they don't know where this CO2 is coming and going (what those "faucet" and "sink" abstracts represent). For those paople, a boxed model is far more attractive.
airscottdenning@2 mentioned David Archer excelling in teaching those models. I want to second that and point to this classic video, IMO the best ever educational piece of its kind:
where David expalains his "artwork". The "tubes" connecting the A O and L boxes represent what you call "adjustment" here. In reality, these are the CO2 flows until the system equilibrates as defined by Henry's law (in case of OA exchange). The CO2 exchanges at the equilibrium stage (not shown on David's graphic but represented, rather vaguely, by your flows from the tap and the sinkhole) are an order of 100 times faster and define the residence time of CO2 molecules in those reservoirs. Finaly, the small opening in David's art is the CaCO3 burial coming from rock weathering (0.2GtC/a on the AR4 graphic).
I've looked at images in Google and couldn't find anything like David's creation in this video. The teaching power of that art is so good that it should realy be put on paper (or electronic media nowadays) and preserved. Any graphic artists there wanting to contribute?
-
Bob Loblaw at 12:35 PM on 20 February 2014How we know the greenhouse effect isn't saturated
Gentlepeople:
Clearly, a simple explanation for radiation transfer is not easy. I'll try to explain some basics and help show where Dikran and scaddenp are coming from.
First of all, photons that have been emitted will follow Beer's Law, which states that absorption will follow this differential equation:
dI = -b dz
where I is radiation intensity, z is distance (we'll think height here for now), and b is the absorption coefficient. In the usual calculus form, dI is thus the change in intensity, dz is the change in distance, and the minus sign tells us that the intensity is decreasing as radiation is absorbed.
If b is a constant, it is easy to integrate this equation over a distance, and we get:
I/I_0 = exp(-bz)
where now I is the current I, I_0 is the I we started with at z=0, and z is now the final value of z. This integrated form of Beer's Law is the one most people will be familiar with. If we are thinking in terms of surface-emitted radiation reaching the top of the atmosphere, I_0 is the surface emission, and I is the amount reaching the top of the atmosphere (at height z) directly.
The "saturation" argument looks at I/I_0 and says it's very small for the value of b at normal CO2, and argues that making b larger won't really make I/I_0 significantly smaller. This is the "truthiness" of the argument, but it fails to look at what happens at other altitudes/intervals.
Let's take a crude example, where we go from 0 to 70 for distance, and use b=0.1 and b=0.2. (I pull these numbers out of thin air.)
We get, for I/I_0:
z I/I_0 (b=0.1) I/I_0 (b=0.2)
0 1 1
10 0.368 0.135
20 0.050 0.002
50 0.007 0.00045
70 0.0009 0.00000008
At z=70, the "saturation" argument says "who cares about the difference between 0.0009 and 0.00000008? [b = 0.1 vs. b=0.2]"At z=10, the atmosphere says "I care".
The point is that - even though little surface-emitted IR actually reaches the top of the atmosphere directly, increasing CO2 will have an effect on how much radiation is being absorbed in different parts of the atmosphere. Increasing the absorption rate (b) means that more IR is absorbed at lower heights, and you have to go through more absorption/reemission cycles (gradually moving upwards)before IR is radiated to space. At each reemission, only half is directed upwards (half goes downwards), so the number of absorption/reemission cycles affgects the efficiency with which the atmosphere get energy from the surface to space (more cycles - less efficient).
Now, if that isn't confusing enough, the total amount of IR radiation going upwards at height z is not solely based on how much surface radiation reaches that height. It also depends on:
- how much IR radiation is being emitted at height z in an upward direction. (This depends on temperature, which is not solely a radiation transfer result.)
- how much radiation has reached height z from all the other infinitely-thin layers of the atmosphere below height z, and has not been absorbed by all the layers in between.
The result, at height z, is a probability density function of where in the atmosphere (below z) that the IR radiation originated. Repeat for all values of z from 0 to the top of the atmosphere. Continuing from height z to the top of the atmosphere tells you how likely a given photon will escape directly to space from that height.
Now if that isn't confusing enough, the value of b is not a single value - it depends strongly on wavelength. All the equations must be applied at each individual wavelength, not for all wavelengths in total. After you've done each individual wavelength, you can then sum to get totals for a range of wavelengths (scaddenp's graph at 6:55AM).
This is what programs like MODTRAN will do for you. It will also not assume that b is constant with height, and other marvellous refinements (such as probably not using linear distance in Beer's Law).
And the end result is that I/I_0 for z=top of atmosphere (the "saturation" argument value) just doesn't tell use what we need to know about IR radiation transfer in the atmosphere, and that increasing CO2 will have an effect.
-
ranyl at 11:38 AM on 20 February 2014Dodgy Diagrams #1 - Misrepresenting IPCC Residence Time Estimates
Dear DM,
I quite like the shrinking sink hole analogy, quite tight, just need to think how to make it into a tap eventually, and do remember that CO2 has always risen as the world's temperature has risen.And don’t more acidic oceans take up less CO2 eventually? And the partial pressure has already pushed 50% of man’s CO2 into sinks, but the other 50% is hanging around for some time, at least a 100 years and isn’t hat ~60% of total warming, keeping in mind total warming CS is double IPCC range…and what level of CO2e are we at?
Remove the SO2 and what happens to heating forcing?
Just saying let’s not think we actual have a carbon budget, we have a debt and huge one, and what we have to ask how much more CO2 is safe to gamble?
Not much I'd suggest looking at the weather, burn Oz burn, how hot is OZ going to be in the next EL Niño Phew!
And wasn't the southern ocean upwelling CO2 release due to southern shift in the polar winds effectively an external source of CO2 to the balanced carbon cycle system during the last ice age?
And when that was turned off effectively during the Bollinger warm period CO2 levels didn't fall much at all.
Also related it is starting to appear the climate sensitivity is probably more like 4C than 3C due to match observations, and more in keeping with geological records. Pliocene-mid most recent 270-/+55ppm, we are 400ppm and everyone knows that this over a 100years is only half the story to equilibrium, last time CO2 400ppm and above was the Miocene.
And yes the sinks have kept up with increasing emissions but please don't forget the fertilizer effects of industrial nitrogen enhancing both and the fact that acidic waters take up less CO2, and re-release it again as ppm in the atmosphere and that sink hole is going to tighten.
Of course CO2 release from permafrost etc, does shrink the hole, keeping CO2around for ages and if the climate sensitivity is 3C in the model CO2 doesn't fall for 200 years and if it is 4.5C is rises despite all the oceanic and plant life uptake, and more and more 4.5C is looking more likely.
MacDougall Nat.Geo 2012
Models are underestimating everything apart from temperature rise and then there is the report in PNAS about the underestimation of the albedo effect in the Arctic and then think of the models used to predict CS and how for RCP2.6 they have more sea ice in summer in 2070 than we do now, that’s all going melt that permafrost maybe quicker???
Now what else shall we add in, old tree die off, deforestation (storms blew done the last tree one Easter Island), the increasing extreme weather which increases CO2 emissions, ever increasing forest and peat fires, pine bark beetle, and not forgetting the SO2 umbrella which will be removed as fossil fuels emissions cease.
So lets go back to the analogy, filling up the bath, with millions of people emptying millions of buckets into it. Luckily the sink hole has increased in size so far, but aided and abetted by the not insignificant industrial nitrogen fertilizer effects and with many sinks now falling, European, Amazon, North Atlantic, Southern Ocean, the hole will shrink soon, especially as th CO2 fertilizer effect is getting to the C4 plant limit (lots of biomass in grasses), and the C3 fertilization effects will be checked by drought and nutrient deficiencies as ecosystem strain. The sink will block all to soon enough and as CO2 falls all that sinked up CO2 will be re-leased will it not?
Anyway.....
How much more CO2?
Don't we need to get 350ppm at least?
Isn't 1.5C looking quite dangerous considering the weather now at 0.7C?
Adaptation is necessary already and to get to 350ppm won't that need a transformational scale of change and a massive enhancement of the earth ecosystem?
??Moderator Response:[PS] fixed as requested; fixed link, removed excessive white space. Please watch this in future.
-
Russ R. at 11:29 AM on 20 February 20142014 SkS Weekly News Roundup #7
Tom Curtis @55,
You made several points, so I'll have to address them in batches.
"As global temperature falls, ice sheets creep towards the equator in the NH. As the edge of the ice sheet, and perhaps more importantly, the southern limit of winter snowfall creeps closer to the equator, it must deal with more direct sunlight, with the consequence that the albedo effect becomes greater and you have a stronger climate sensitivity."
Agree entirely. Ice albedo (IA) feedback will gain strength at an increasing rate as the transition zone extends further toward the equator. There should be two effects, more insolation (as you mentioned) and a larger surface area to operate over. Both effects should be proportional to the cosine of latitude. Assuming they're multiplicative, then the strength of IA feedback should increase proportionally to cos2 of latitude, or around 4x if the leading edge advances from 60N&S to near the equator.
But when you play out the scenario in reverse, IA feedback will weaken substantially as ice retreates to the pole. From 60 to 70 degrees the magnitude of feedback would diminish by approximately half. From 60 to 80 degrees it would decline to 1/12 of its magnitude. Which aligns exactly with what I wrote above: "I would make a case that climate sensitivity was both higher and lower at different points in our planet's history, and will diminish if temperatures continue to rise."
You continue:
"Conversely, with rising temperature, humidity rises, and with it the strenght of the water vapour feedback. In fact, water vapour concentration rises with the fourth power of temperature so that in the right conditions, increasing temperature mean that water vapour can force a runaway greenhouse effect. The right conditions include strong enough insolation, and fortunately for the Earth is safe from that outcome - but that does not preclude an increasing climate sensitivity with increased temperature due to a strengthening WV feedback."
There are two fundamental differences I can immediately think of between IA and WV feedbacks.
First, IA starts from a permanently frozen pole, and as it advance, each additional degree has an increasing effect. WV feedback experiences the opposite. It starts from a permanently humid equator, but as it advances poleward, for each incremental degree it has less surface area and less insolation to drive it. If my math is correct, applying the same cos2 approximation, the entire extratropics north and south of 23 degrees latitude would have the same WV feedback effect as the tropics. In other words, if the earth became suddenly "tropical" right to the poles, the entire magnitude of WV feedback would only double.
Second, WV feedback doesn't act alone... it comes part and parcel with a couple of other factors that limit its feedback effect. First, as you add heat to sea areas (or moist land areas) water evaporates, rises and condenses, transporting heat up through the atmosphere (often violently). It also makes for an instant increase in cloud albedo. Both of these effects constitute not just negative feedback, but an effective "wall". Sea surface temperatures never get above ~30C because thunderstorms (or occasionally tropical cyclones) limit further temperature increases and bring temperatures back down.
So, I would agree that WV feedback will increase as temperatures rise, but at a diminishing rate.
Moving on:
"As noted by Dikran Marsupial, your evidence for the convenient ECS plateau we are supposed to occupy also has it wrong. The Earth has in fact experienced at least two, and probably more runaway cooling events."
Since I'm insufficiently familiar with the evidence for or against the "Snowball Earth" theory, no argument here. I'll happily accept that this happened in the planet's distant past.But I'd focus your attention on more geologically "recent" episodes of cooling, which should be more relevant to today's conditions and concerns. In each of the last periodic glacial episodes over the last million or so years, temperatures have fallen, the IA feedback effect you mentioned would have increased, but no runaway cooling resulted. Some other negative feedback mechanism(s), (possibly WV feedback) overwhelmed the increasingly positive IA feedback, slowing the rate of cooling. In other words, net feedback fell, and the temperature ultimately stabilized. Which again, aligns with what I wrote: "...geological evidence points to a planet see-sawing between two relatively stable equilibrium climate conditions, which suggests high sensitivity in the middle of the range, and low sensitivity at either end of the range".
Nonetheless, I think we've established that net feedback (and ultimately climate sensitivity) is not going to be constant across all climactic conditions. It is the sum total of multiple mechanisms (of which we've only discussed a couple), each of which will behave differently under different conditions. Would you agree?
More later.
-
How we know the greenhouse effect isn't saturated
scaddenp - I would agree with Dikran; that's a very useful diagram, and that the spread of emission altitudes is rahter larger than I thought.
One of the more frustrating points of this exchange (and I think where some of the confusion and talking past one another has arisen) is the repeated reference to 'opaque' and 'translucent' layers - as I tried to point out above there is varying IR emission from a range of altitudes, not a single transition altitude between two distinct states. IR in GHG bands is emitted to space at a range of different altitudes - with the sum of that emission adding up to the oft-noted temperature equivalent profiles seen in satellite observations of those bands.
-
How we know the greenhouse effect isn't saturated
mgardner @54:
Being a layman like you this discussion is quite challenging and enlightening also for me.
Regarding your three underlined paragraphs / questions I’ll try to provide some information.1. There isn’t a specific altitude there IR attenuation by CO2 or any other greenhouse gas becomes negligible. This depends strongly on the IR wavelength, and varies from sea level in the “atmospheric window” (8-12 microns) to the lower or middle of the stratosphere (25-30 km) in the part of the IR spectrum most strongly absorbed by CO2 (close to 15 microns). The 5 km figure is just an average of this. If CO2 was the only greenhouse gas, the average altitude of heat loss would be much lower (1-1.5 km?) because its absorption is negligible outside the wavelength range 13-17 microns. IR radiation outside this range would therefore escape to space directly from the surface.
2. The forcing from a doubling of CO2 is usually given as about 4 watts/m2, meaning that it would reduce the outgoing longwave radiation (OLR) from 240 watts/m2 to 236 watts/m2 until surface warming restored the balance by increasing the OLR to its previous level.
240 watts/m2 corresponds to 255 K, so how much cooling is needed to reduce the radiation to 236 watts/m2?
According to the Stefan-Boltzmann law, 236 watts/m2 corresponds to 254 K, so a 1 K cooling is sufficient to reduce the OLR by 4 watts/m2. With a lapse rate of 6.5 K per km the answer to your question should be about 150-160 m.
Surprising? A doubling of CO2 raises the average altitude of heat loss by merely 150-160 metres?Don’t forget that most of the IR spectrum isn’t affected at all, while the heat loss from the central part of the CO2 absorption band will rise several kilometres. And the water vapour feedback isn't included here.
3. Sorry, it’s past midnight here in Norway now. I’ll try to write something about the thickness of opaque layers tomorrow if nobody else has anything about that.
-
Dikran Marsupial at 09:53 AM on 20 February 2014Dodgy Diagrams #1 - Misrepresenting IPCC Residence Time Estimates
ranyl, like many analogies, the bathtub one only explains a basic concept and there is often little use in extending it. If you are happy with the basic idea, then the next step is to look into simple box models of the carbon cycle, but that is rather beyond the scope of the article.
While increasing ocean temperatures will result in some degassing, it isn't the only thing that determines the strengths of the oceanic source/sink. Another important factor is the difference in partial pressure of CO2 in the atmosphere and the surface oceans, if there is more CO2 in the air than the oceans, the oceans will take up more CO2 to balance the partial pressures. Fossil fuel use has increased the partial pressure in the atmosphere, and this has resulted in an increase in uptake of CO2 into the oceans, which greatly outweighs the effect of the increase in ocean temperatures.
In the ice core data, there is no external (to the carbon cycle) source of atmospheric CO2 causing a partial pressure difference, so CO2 was degassed from the oceans, so the situation isn't quite the same.
The IPCC diagram in the article shows the changes in the various fluxes into and out of the atmosphere since the pre-industrial equilibrium, which shows that both the oceanic source and sink have strengthened (but the sink more than the source).
-
Rob Honeycutt at 09:46 AM on 20 February 20142014 SkS Weekly News Roundup #7
Apology accepted and appreciated, Russ. I'll let Tom take it from here.
-
ranyl at 09:30 AM on 20 February 2014Dodgy Diagrams #1 - Misrepresenting IPCC Residence Time Estimates
Interesting article.
Do you think that in reality for the analogy that the sink hole should shrink as the ocean warms as well?
Considering the below and increasing forest fires, permafrost melt, increasing severe weather and nutrient limitations of the CO2 fertilizer effect.
"As the world's oceans warm, their massive stores of dissolved carbon dioxide may be quick to bubble back out into the atmosphere and amplify the greenhouse effect, according to a new study.
The oceans capture around 30 per cent of human carbon dioxide emissions and hide it in their depths. This slows the march of global warming somewhat. But climate records from the end of the last ice age show that as temperatures climb, the trend reverses and the oceans emit CO2, which exacerbates warming.
Previous studies have suggested that it takes between 400 and 1300 years for this to happen. But now the most precise analysis to date has whittled that figure down.
Quick response
"We now think the delay is more like 200 years, possibly even less," says Tas van Ommen from the Australian Antarctic Division, in Hobart, who led the study.
The new results come from Siple and Byrd ice cores in western Antarctica. Van Ommen and colleagues dated CO2 bubbles trapped in the ice, and then compared their measurements with records of atmospheric temperatures from the same time period.
As expected, when temperature increased, carbon dioxide followed, but at both Siple and Byrd the time lag was around 200 years – much shorter than previous studies found.
Rising temperatures make carbon dioxide leak from the oceans for two main reasons. First, melting sea ice increases the rate that the ocean mixes, which dredges up CO2-rich deep ocean waters. Second, "when you warm the ocean up, just like warming up a Coke bottle, it drives the gas out," says van Ommen.
Previous estimates used cores from regions with low snowfall, van Ommen says, leading to a very gradual trapping of the carbon dioxide in the ice. This increased uncertainty in timing. Also, many previous studies used only one ice core site."
Just with a smaller sink hole or even the sink hole becoming a source seems more akin to the reality of the situation.
How much more carbon can put in the atmosphere safely?
None?
??
Don't we need to remove CO2 to get the now widely advocated 350ppm by 2100?
Is this a well serious real situation right now or an abstract problem still??
Don't we need to adapt, stop carbon emissions asap, somehow remove CO2 from the atmosphere and doesn't that mean transforming everything we do?
Community Adaptation Transformation looks promising, it does mean sacrifices in many areas but does also allow the potential for a transformation of things in an inclusive way that brings people's together in such a way that well being of the environment is championed and an equitable, secure and sustainable future might be realised.
Worth having a look at, considering the extreme weather?
?
Moderator Response:[PS] Fixed link and excessive white space. Please avoid too much block quoting - a link and you comment on it is better.
-
Dikran Marsupial at 09:22 AM on 20 February 2014How we know the greenhouse effect isn't saturated
scaddenp that is a very interesting diagram. It was already my understanding that there wasn't really an "opaque layer" and a "translucent layer" with a distinct boundary, but I had no idea that the distinction was anything like as diffuse as is suggested by that diagram. In that case, is probably better not to think of it in those terms, other than as a very crude qualitative model.
-
Don9000 at 09:08 AM on 20 February 2014Vision Prize: scientists are worried the IPCC is underestimating sea level rise
Wili@2
Your link, when accessed via Firefox, yielded a pop up warning me from connecting:
"This Connection is Untrusted" and so on.
Deleting the "s" from the https fixed this issue.
Moderator Response:[PS] Fixed, thank Don
-
Russ R. at 08:44 AM on 20 February 20142014 SkS Weekly News Roundup #7
Rob Honeycutt,
I owe you an apology for my last post @67, as it amounted to, in sports terminology, a "late hit".
Sorry.
-
Tom Curtis at 08:03 AM on 20 February 20142014 SkS Weekly News Roundup #7
As a point of clarrification, here are the estimated Equilibrium Climate Sensitivities from Otto et al:

The important values are the "likely" range, of approximately 1.1 to 4.2 C per doubling of CO2 for the full 1970-2009 period, which compares to the "likely" range of 1.5 to 4.5 C per doubling of CO2 given by the IPCC AR5; and the 95% confidence interval of 0.9 to 5.0 C per doubling 95% confidence interval for the full period. The later range is drawn, not from the graph but from their specific statement in the text, which states:
"The most likely value of equilibrium climate sensitivity based on the energy budget of the most recent decade is 2.0 °C, with a 5–95% confidence interval of 1.2–3.9 °C (dark red, Fig. 1a), compared with the 1970–2009 estimate of 1.9 °C (0.9–5.0 °C; grey, Fig. 1a). Including the period from 2000 to 2009 into the 40-year 1970–2009 period delivers a finite upper boundary, in contrast with earlier estimates calculated using the same method14. The range derived from the 2000s overlaps with estimates from earlier decades and with the range of ECS values from current climate models10 (ECS values in the CMIP5 ensemble13 are 2.2–4.7 °C), although it is moved slightly towards lower values. Observations of the energy budget alone do not rule out an ECS value below 2 °C, but they do rule out an ECS below 1.2 °C with 95% confidence. The upper boundary is lowered slightly, but is also very sensitive to assumptions made in the evaluation process (see Supplementary Section S2). Uncertainties include observational errors and internal variability estimated from control simulations with general circulation models."
You will notice that they state the 95% confidence range, but only display the 90% confidence range on the graph.
There is also a confusing point in the graph, in that the broad bands are stated as being the 17% to 83% confidence interval (from which Russ derives his estimate), but the ovals are stated to "... represent likelihood contours enclosing 66% two-dimensional confidence regions". That is, they represent the 17-83% confidence contour allowing for the fact that there is uncertainty not only in the width of each line, but also in its relative placement. I would argue that that is the better comparison to the IPCC values, but Russ's determination of the values is certainly a reasonably reading of the graph. Certainly his "likely" range is more directly comparable to the 90%, or 95% confidence ranges that will become crucial later in the discussion.
For comparison, the IPCC do not give a "most likely" (ie, modal) value, nor a mean nor median value in their estimate (unlike in AR4). They give a likely (17-83%) range of 1.5-4.5 C, and a 1-90% range of 1 to 6 C.
With regard to interpreting Otto et al's comments, I believe Rob Painting has it right. It must be always kept in mind that the confidence intervals given by Otto et al are the confidence intervals based on only the data they look at, and using only the method that they use. Clearly adding more data may change the confidence interval, and need not necesserally narrow it. Further, using different methods on the same data may also change the outcome. Otto et al (with the possible exception of Nic Lewis) are well aware of that. Hence they insist that their results are in the same ball park as other results and reinforce our confidence in that general ball park far more than they create confidence that the specific limits found by any particular study. Looked at this way, Rob Painting is merely recognizing that there are many other emperical studies, which cannot simply be ignored or trumped by a single study no matter how much we like its results. The combined confidence intervals of the many studies is highly unlikely to have its confidence intervals exactly match those of any individual study. It is, however, likely that its central value (whether mode, median or mean) will lie within the 95% confidence interval of the vast majority of the individual studies.
Given that this is merely to restate the point I made @55 above (point 2) in different language (IMO), I would appreciate it if Russ would not respond explicitly to this post, but include any arguments he has on this point in his response to my post @55.
Moderator Response:[PS] If this discussion is going to focus on climate sensitivity, then consider also the "climate sensitivity is low" article
-
scaddenp at 06:55 AM on 20 February 2014How we know the greenhouse effect isn't saturated
It would raise the emission height a few hundred meters.

-
mgardner at 05:51 AM on 20 February 2014How we know the greenhouse effect isn't saturated
DM (and Phil)
Yes, that's exactly the question, and it should have been obvious, if you had read my language carefully, that I clearly distinguish between "absorption of all possible photons from the emitting plane" (opacity, which is the essence of the original myth about 'saturation',) and "a reduction of the energy emitted from that plane as it traverses the interval" (attenuation). I don't use words randomly.
Which brings us to the question of what a polite response to someone asking a serious question might be. My approach is to make sure I understand the question by asking for clarification rather than lecturing and repeating the same thing multiple times. Then, if I couldn't provide the answer, I would say "I don't know" rather than deflecting by saying "you're missing the point".
So, I'll repeat my questions:
If I understand correctly, we take something like 5km to be the altitude above which attenuation of IR by CO2 is negligible--"where energy radiates freely to space".
Now, without telling me about how it all varies with season and latitude, and all of the complications involved in doing the calculations, can I find out about what that altitude would be if we double the CO2 concentration? Is it 100m higher, or 1km higher, or 4 km or what?
I would also like to know, again, order of magnitude, what the thickness of an 'opaque' 'layer' just below that original 5 km altitude would be. And what the attenuation would be for IR radiation in some CO2 band through that 'layer'.
There's no shame in admitting "I don't know"; that's what I'm doing by asking these questions. But it should be obvious if you are paying attention that I know what I'm asking about.
-
Andy Skuce at 05:50 AM on 20 February 20142014 SkS Weekly News Roundup #7
Russ started this discussion @1 with the question :
What exactly would constitute evidence against climate change? Or is climate change an unfalsifiable hypothesis?
There is an excellent post at Bart Verheggen's blog (written by Jos Hagelaars and Hans Custers) that has an extended answer to Russ's question.
-
Rob Honeycutt at 05:37 AM on 20 February 20142014 SkS Weekly News Roundup #7
Russ... I've already shown you where it states otherwise in Otto et al, but I'll give the discussion of this over to Tom.
[edit] If you don't have the bandwidth it will be helpful if you keep the discussion directed toward Tom and not bait me with additional comments that I would need to respond to.
-
airscottdenning at 05:35 AM on 20 February 2014Dodgy Diagrams #1 - Misrepresenting IPCC Residence Time Estimates
There are at least two important responses to this misunderstanding:
1) from a "communicating science to the public" point of view, consider the catastrophe that would result if CO2 really did have a residnce time of say, 10 years. There's currently about 400 ppm of CO2 in the atmosphere. We would have to ADD 40 ppm every year (about 80 GtC per year) just to maintain the habitability of the planet! This is about 8 times the current emissions from the entire global economy. The world would have ended lon ago when plants ran out of CO2. It's patently absurd, and the fact that we're here shows without a shadow of a doubt that it's not true.
2) More seriously, what we actually know about the fate of fossil CO2 is that the rate of removal depends sensitively on the size of the anthropogenic pulse. A small pulse will decay to 20% of its original size in 1000 years, but a large pulse will take many millennia to decay to that level. This has been especially pointed out by David Archer and colleagues.
-
Dikran Marsupial at 05:03 AM on 20 February 2014How we know the greenhouse effect isn't saturated
mgardner, a bit if politeness wouldn't go amiss, KR and I are only trying to be helpful.
Consider a photon emitted by the surface. It is absorbed by a molecule of CO2 in the "opaque layer", however the energy in that photon is transferred by molecular collisions to the translucent layer, where it is emitted upwards by another molecule of CO2 and it leaves the Earth. Now you could say that the opaque layer has attenuated the flow of IR photons, by absorbing this one, but has it attenuated the energy radiated into space? No, becase the energy was transformed, passed on to the translucent layer and then radiated into space. The fate of IR photons leaving the surface of the Earth is essentially irrelevant to the Earths energy budget, as virtually all of them (in the relevant absorption bands) are absorbed by the atmosphere at some point.
Asking about the absorption of photons by the opaque layer suggests you have an incorrect model of the nature of the greenhouse effect. It is what happens at the top of the atmosphere that determines the greenhouse effect, not by what happens near the surface.
As it happens, I am an electronic engineer by training, and I know exactly what attenuation means, the question is attenuation of what, the individual photons (which are irrelevant), or the energy that they carry (which isn't)?
-
Phil at 05:02 AM on 20 February 2014How we know the greenhouse effect isn't saturated
DM: "It doesn't really matter how much IR is attenuated in the "opaque layer" as some of the energy of the absorbed photons will still be transmitted to the "translucent layer" via collisions, convection and re-radiation."
mgardner: What exactly do you think "attenuation" means, other than that?
mgardner, I think Dikran is using "attenuation" to refer to absorbtion of the photon. When an IR photon (of the correct frequency) interacts with a CO2 molecule, the photons energy is transferred into a vibration of the atoms within the molecule, in the case of Global Warming this is primarily a bending motion. The photon (which is essentially a packet of energy) is destroyed, and the CO2 molecule starts vibrating more energetically. Thus the photon has been "attenuated".
At some later stage the CO2 molecule will relax into its "slower" vibration; either by emitting a new photon (back or outbound radiation), or by collisions with other molecules.
This response glosses over the quantum mechanics somewhat.
-
mgardner at 04:52 AM on 20 February 2014How we know the greenhouse effect isn't saturated
DM@50
I don't have a clue what you mean or think you mean when you use the term "attenuation". Maybe you could use a different word or words?
-
Dikran Marsupial at 04:18 AM on 20 February 2014How we know the greenhouse effect isn't saturated
mgardner, the bit that is attenuated by absorption by CO2 will still be eventually transferred upwards by the mechanisms I mentioned, which is why the attenuation of the opaque layer is essentially irrelevant. Consider what happens to the energy absorbed by the opaque layer, if it is not to indefinitely increase in temperature, it must loose the energy either upwards to the translucent layer, or downwards to the surface (back-radiation).
The Earths energy budget is determined by the difference in incoming and outgoing radation. How many times the energy is transferred within the atmosphere before it is finally radiated out is irrelevant to the Earth's energy budget.
-
mgardner at 04:12 AM on 20 February 2014How we know the greenhouse effect isn't saturated
DM and KR @48 and @47
DM: "It doesn't really matter how much IR is attenuated in the "opaque layer" as some of the energy of the absorbed photons will still be transmitted to the "translucent layer" via collisions, convection and re-radiation."
What exactly do you think "attenuation" means, other than that?
KR: "The "...thickness of an 'opaque' 'layer' just below..." would be all the way from that altitude to the ground."
Well, no, it wouldn't be. There's some point below a given altitude h (e.g. 5km) at which photons emitted (in a given band) will not reach h. That's dependent on the density profile. And below that, there's another such point, and so on. What I don't know is how many such points exist before I reach the surface.
Look, there's nothing I'm asking that an actual expert would have trouble with-- it's the most basic of the physics of this subject.
So I'm leaving my question open for anyone who either has some ballpark numbers in their memory or can specifically refer me to where I can find them, or who can explain to me why they don't exist.
-
Dikran Marsupial at 04:07 AM on 20 February 20142014 SkS Weekly News Roundup #7
I have to say that it ought to be obvious that if someone agrees to step out of a discussion in order for there to be clarity, then continuing the discussion with them is rather bad form. This is especially the case if you start by making an accusation such as "This looks like a pretty unreasonable attempt to spin the result as nothing new for sensitivity...".
This seems to me to be a shameless attempt to get Rob back into the discussion in order to avoid the clarity of a one-to-one discussion with Tom. I can't imagine why you might want to avoid the clarity of a one-to-one discussion with Tom! ;o)
I suggest we don't rise to the bait and leave Tom to discuss this with Russ.
Prev 754 755 756 757 758 759 760 761 762 763 764 765 766 767 768 769 Next


