


 Arguments


Recent Comments
Prev 756 757 758 759 760 761 762 763 764 765 766 767 768 769 770 771 Next
Comments 38151 to 38200:
-
jja at 03:32 AM on 19 February 2014Vision Prize: scientists are worried the IPCC is underestimating sea level rise
The Vision Project results are revealing. It is clear that there is a very conservative bias in the attribution of effect of poorly understood, but potentially significant feedbacks.The following image static.visionprize.s3.amazonaws.com/Q4.jpg shows that a significant portion of the polled scientists expect a warming signal that would necessarily result in a final 2100 TCR of over 4'C.
In this case, there is indication for the Ross ice sheet dynamics that were present during MIS-31 to reoccur due to hemispheric climate changes associated with a slowdown of the MOC. adsabs.harvard.edu//abs/2010agufmpp43d..03b
This is a poorly understood dynamic that has a potentially high probability within the next 85 years. www.nature.com/ngeo/journal/v5/n3/full/ngeo1391.html
-
mgardner at 03:26 AM on 19 February 2014How we know the greenhouse effect isn't saturated
DM @39 or anyone who can contribute:
I'll give it one more try; perhaps I'm not communicating very well, or I'm completely wrong in my understanding.
1) The probability of a photon being emitted depends on the temperature, which depends on the altitude.
2) The probability of that photon escaping absorption and re-radiation (meaning attentuation statistically) is dependent on the altitude and the density of CO2 above it.
So, there are some photons that escape completely, and there is some attenuation of the total transport from that level through absorption and re-radiation in the atmosphere above the level of emission. What I'm trying to find is the quantitative relationship between those effects. I don't require great certainty, just some relative values.
If this is something we don't know, that's fine, but does anyone know if we know or don't know? (No, I'm not Rumsfeld in disguise.)
-
How we know the greenhouse effect isn't saturated
mgardner - Discretization of a continuous system is a useful approach for analysis, but one must always keep in mind that it is an approximation of a continuous reality.
There are certainly qualitative dividing lines that can be drawn - the top of the troposphere where convection ends and the still air of the stratosphere begins, for example. But the boundary for IR emission for each greenhouse gas (different for each) is a probabilistic one due to concentration based chances of interception - with < 50% of upward IR from slightly below that altitude escaping to space along with > 50% of upward IR from slightly above.
-
Rob Honeycutt at 03:22 AM on 19 February 20142014 SkS Weekly News Roundup #7
Russ @41... You might actually take the time to read Otto 2013 before making such assertions as that they estimate CS at 2C. They state:
"Using up-to-date data on radiative forcing, global mean surface temperature and total heat uptake in the Earth system, we find that the global energy budget implies a range of values for the equilibrium climate sensitivity that is in agreement with earlier estimates, within the limits of uncertainty."
They very specifically argue that caution needs to be taken in doing exactly what you've done.
"We note, too, that caution is required in interpreting any short period, especially a recent one for which details of forcing and energy storage inventories are still relatively unsettled: both could make significant changes to the energy budget."
Otto et al are not making an argument against the current central estimates of 3C for ECS. In fact, they are saying quite clearly their estimates support those earlier figures.
-
Russ R. at 03:15 AM on 19 February 20142014 SkS Weekly News Roundup #7
Tom Curtis,
Glad to see we agree on most of the issues. That leaves only two... climate sensitivity and the magnitude (and sign) of expected net costs for given amounts of warming.
Each of these is a subject weighty enough to be it's own PhD thesis, so a blog post won't really do justice to either. Plus, I'm tight on time this morning, being at work, so this will have to be brief.
Let's start with climate sensitivity (we'll get to net cost/benefits later). I have two main issues that cause me to be skeptical of arguments for high sensitivity.
1. Fundamentally, climate sensitivity is a combination of forcing, feedbacks and thermal inertia. The forcing component of increased GHG concentrations is straightforward enough, the planet's thermal inertia is a bit less straighforward (since nobody seems to know exactly when all the supposed "warming in the pipeline" should appear), but the feedbacks are most assuredly not straightforward at all. There are countless feedback mechanisms in operation at any point, some positive and some negative. The magnitude of each will vary under different climactic conditions (e.g. ice albedo feedback can be a factor only at the margin of ice extent, which is of much greater magnitude when ice sheets extend down to 45N latitude instead of 70N). I wouldn't treat the sum total of all feedbacks as a linear multiplier and extrapolate it into the future. (Which is exactly what is being done when using ECS to forecast temperature changes.)
I would make a case that climate sensitivity was both higher and lower at different points in our planet's history, and will diminish if temperatures continue to rise. Were this not the case, the planet would have experienced runaway warming (or cooling) in the past when temperatures and CO2 levels were much higher (and lower) than they are today. Instead, geological evidence points to a planet see-sawing between two relatively stable equilibrium climate conditions, which suggests high sensitivity in the middle of the range, and low sensitivity at either end of the range. We can get into this in greater detail if you like.
2. Second, the model-derived estimates of sensitivity are a function of the assumptions relating to aerosol forcings, which vary significantly. Rather than retype the whole argument, I'll link to a post that summarizes it: http://www.coyoteblog.com/coyote_blog/tag/ecs. I agree with Meyer on this specific issue, with one exception... where he estimates ECS at 1.2C, I'd go with 2.0C based on Otto et al (2013).
-
gws at 02:55 AM on 19 February 2014Methane emissions from oil & gas development
Two new, contrasting studies addressing air pollution from shale areas have been published:
1. A study published by a Houston company in Science of the Total Environment found no significant impact from oil and gas extraction activities in the Barnett shale region of Texas for a selected subgroup of air toxics (the paper title is thus somewhat misleading).
2. An investigation by a 3-member consortium (Center for Public Integrity, InsideClimate News and The Weather Channel) found that, in the Eagle Ford shale region of Texas, an ever increasing amount of emission permits given to frackers and limited state oversight suggests that air toxics emissions have strongly increased in a previously low emissions region, leading to very significant impacts.
-
Dikran Marsupial at 01:57 AM on 19 February 2014How we know the greenhouse effect isn't saturated
I don't think I am saying anything substantially different from KR, I was just giving the caveat that there probably isn't a clear boundary between the "opaque layer" and the "translucent layer", just that the probability of an IR photon escaping into space depends on the height at which it is emitted, and that as more CO2 is added, the higher the mean altitude will be. The boundary between the layers is equivalent to the height at which the p.d.f. starts rising quickly, but it isn't a distinct boundary. If it makes more sense to think of a p.d.f. than in terms of layers, then think of a p.d.f.
Layers are often useful in explaining concepts about the atmosphere, but they layers don't always correspond to physically distinct layers in the atmosphere (like the trophosphere and stratosphere). Like all analogies/models, there comes a point in the discussion where you need to move onto a lower level of abstraction. IIRC layered models are often used in practice (atmosphere and ocean) as it is easier to model a continuously varying atmosphere as a number of thin homogenous layers.
-
mgardner at 01:42 AM on 19 February 2014How we know the greenhouse effect isn't saturated
KR and DM
Thanks; I do understand the principles as described. I guess my problem is with this language of 'layers'. It seems that even you guys aren't quite in agreement on how to characterize what's happening when you try to employ it.
The analogy I used @28 fails in a strict sense because it is restricted to radiative transport; there would have to be some other metaphor for mass effects (convection), to account for the gradient or thermocline through this upper zone of the troposphere where the action is. (I'm still hoping someone can refer me to a source that gives a higher-resolution picture of that area.)
But maybe the real source of confusion is that opacity to 'original photons' makes us think of 'layers' when there are no layers with respect to radiative transport? Or do I have that wrong?
-
PluviAL at 01:13 AM on 19 February 2014Customizable Global Warming Widget Metrics
Thanks for the restatement of what would seem to be obvious but is not. I started to put this on my website, now I am motivated to finish. Just to be sure, the terms are very generous. I understand that it can even be put into an e-book. Please correct me if that is not correct. I'll read terms again, but I don't want to missinform.
-
Cedders at 01:09 AM on 19 February 2014Extreme weather isn't caused by global warming
Please excuse a very basic question, prompted by the flooding here in the UK and a report on it at <http://www.metoffice.gov.uk/research/news/2014/uk-storms-and-floods>. I understand (a) CO2 etc will raise the temperature and moisture content of warm air; (b) precipitation generally occurs when warm moist air meets colder air. Is the strength of precipitation proportional to the difference in temperature between the two air masses (that causes water vapour to condense)? If so, will not the colder air mass on average also be warmer, so the differential remains roughly constant with rising SST, and precipitation is not necessarily heavier? (If the answer requires maths, please include.) Thanks.
-
Dikran Marsupial at 00:30 AM on 19 February 2014How we know the greenhouse effect isn't saturated
mgardner, the top of the opaque layer is determined by the bottom of the translucent layer, rather than the translucent layer being determined by the top of th opaque layer.
Imagine we needed a layer 1km thick to be completely opaque. That doesn't mean that the atmosphere above 1km is traslucent, the next 1km layer will also be opaque. However the energy from IR emitted from the surface that is absorbed by the first opaque layer is still transfered to the one above it by conduction, convection and radiation. There could be several such saturated opaque layers from which IR cannot pass through from thelayer below, even though some of the heat energy does pass through them.
IIRC the lower atmosphere isn't completely opaque to IR, so it probably isn't best to think too strongly about it in that way, instead there is a band in the atmosphere from which the bulk of IR is radiated. Some may come direct from the surface, but not much as it is absorbed in the trophosphere, most will be emitted from the air higher up in the atmosphere, which is cold. The more CO2 you add, the higher in the atmosphere it needs to be radiated from in order not to be absorbed before it escapes. I suspect there is a probability distribution that shows the density of the height in the atmosphere from which IR photons escape; the mean increases with increasing CO2.
-
How we know the greenhouse effect isn't saturated
mgardner - The opacity to IR in absorbance bands is set by the total amount of GHGs. As the concentration of GHGs increases, the atmospheric pressure where that total amount is small enough for IR to reach space decreases, meaning it occurs at a higher (and colder) altitude.
In short, as GHG concentrations increase, the bottom of the 'translucent' layer becomes IR IR absorbing, and the radiation altitude increases - the thickness of atmosphere wherein IR is captured does indeed become thicker.
-
Tom Curtis at 00:05 AM on 19 February 20142014 SkS Weekly News Roundup #7
Russ @41, breaking the list down with description and your position grouped we have, to start:
(1) "In a BAU scenario GHG emissions will continue at a rate faster than can be absorbed by the biosphere, resulting in significantly and unsustainably rising concentrations"
"The evidence is abundant and highly compelling."
Agreed.(2) "The expected increase in atmospheric GHGs will result in a significant amount of warming"
"The evidence is mixed. Computer models show high sensitivity, whereas estimates derived from observations are more borderline. (e.g. Otto et al (2013) best estimate of ECS was 2.0)."
The evidence is mixed. Just addressing the evidence before the IPCC, we have OAGCCM models with equilibrium climate sensitivities ranging from 2 to 4.6 C/x2CO2 (IPCC AR5 WG1, Chapter 9, see figure 9.42). Empirically, from the instrumental record, we have values from 0.8 (Lindzen and Choi) to 5 C/x2CO2, with 8 out of 20 being below 2 C/x2CO2, and 5 being 3 C/x2CO2 or above. Empirically, from climatological constraints we have three results, all lying between 3 and 4 C/x2CO2. Also empirically, from paleoclimate, we have just one from eleven results lying below 2 C/x2CO2, and one lying above 4 C/x2CO2, with the remainder lying between 2 and 3.5 C/x2CO2. There are also six results from attempted combined assessments, of which just one gives a result below 2 C/x2CO2, with the others all lying around 2.8 to 3 C/x2CO2. Of course, these are just modal (or mean or median in some cases) values, and the confidence intervals extend widely from the quoted values. In some instances as high as 9 C/x2CO2, but in no case below 0.5 C/x2CO2. (Data from IPCC AR5 WG1 Chapter 12, Box 12.2 Fig 1)
The mixed results in this case mean we have significant error margins in estimates. It does not mean there is a contrast between the range of values from empirical estimates and model estimates as you have suggested. That is a cannard formulated by focussing on just two or three studies that have conveniently low values, and not considering the full range of available evidence.
Given this, whether guided by empirical studies or the models, it is difficult to arrive at an estimate ECS range much different from the IPCC estimate that "...ECS is likely in the range 1.5°C to 4.5°C with high confidence, extremely unlikely less than 1°C (high confidence) and very unlikely greater than 6°C (medium confidence)."
I look forward to your ingenious argument that policy makers should ignore the assessment of experts on the topic, looking at the full range of evidence in favour of the opinion of non-experts looking at two or three cherry picked studies. Alternatively, I will be pleased to hear that you accept the IPCC assessment of climate sensitivity, and with it the likely temperature consequences for BAU.
(3) "The warming and related changes (sea level rise, etc.) will occur over time periods that are meaningful relative to human lifespans"
"The evidence is compelling."
Agreed.
(4) "The changes will meaningfully impact ecosystems, economies, societies and individuals (considering both positive and negative impacts)"
"The evidence is compelling."
Agreed.
(5) "The net cost / benefit of the expected changes will be negative"
"The evidence is conditional. (Modest amounts of warming would be beneficial, greater warming would likely be negative. http://www.skepticalscience.com/copenhagen-consensus-center-climate-change-costly.html)"
Actually, the evidence is more equivocal than conditional. From the article we link to we find this graph, showing the cost estimates for the three major economic models for the costs of climate change:
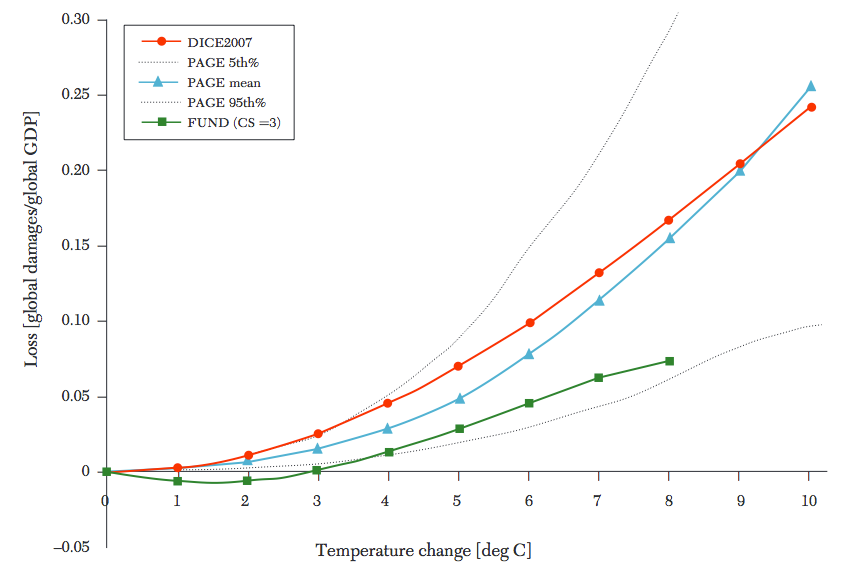
As you can see, just one of three models shows benefits for small amounts of global warming, with the other two showing costs at all levels of warming. Claiming the "evidence is conditional" implicitly assumes that model is correct, in contrast to the other two. I do not see how that can be justified. As with the empirical climate sensitivity results, it looks a lot like choosing to pay attention only to those studies which give you the result you like.
Of course, I am inclined to give little weight to all three. That is because:
a) The models are not able to include a number of known and significant costs due to lack of data;
b) The models assume a prescribed economic growth, and therefore cannot include the costs of any reduced economic growth either due to global warming, or due to mitigation measures. As alterations in the rate of economic growth are likely to have far more effect on total costs and benefits than factors covered in the models, that renders them of dubious value. I should note that several global warming related weather disasters have already significantly impacted economic growth.
c) The models are unable to realistically cost the effects of loss of major eco systems, such as the Arctic, the Great Barrier Reef (both near certainties) and potentially the Amazon Rainforest. That means the costs they show are, in effect, best case scenarios rather than realistic estimates of the actual costs of global warming.
It seems a general feature of these economic models that they show little bearing to the kinds of impacts scientists tell us certain temperatures will have. It is telling that the FUND model, for example, shows only a loss of 7.5% of GDP at temperatures which scientists tell us will make the tropics seasonally uninhabitable for part of the year. The situation appears to be that the scientists cannot tell us the likely economic cost of global warming because they do not have the economic training necessary; but the economists cannot tell us either because global warming will likely take us to conditions so far outside normal conditions that the economists do not in fact have tools to deal with it. The general effect is that the uncertainty is much larger than indicated by the economic models, and while this allows the possibility of overall economic benefits to relatively high temperature increase (3 C), it also allows the possibility of catastrophic results at quite low levels of temperature increase (2, or even 1.5 C).
I will leave discussion of the policy issues until you have had a chance to respond on the science (and economics) issues.
-
mgardner at 00:03 AM on 19 February 2014How we know the greenhouse effect isn't saturated
@32 Dikran Marsupial
"As CO2 is added, this thickness decreases and so the bottom of the layer becomes higher."
Perhaps I really do need to have a picture drawn to have this make sense. Let's say there's an altitude h which represents the top of the top opaque layer O. Above it there is a translucent layer, Lt1. For the bottom of Lt1 to move up, the top of O must also move up, but if it is already saturated, then adding CO2 should have no effect on O; its thickness remains constant. It seems more logical that the top of Lt1 moves down in altitude.
What effect am I missing?
-
Dikran Marsupial at 23:55 PM on 18 February 2014How we know the greenhouse effect isn't saturated
In short, the Earth's energy budget is determined by the balance of incoming and outbound radiation, so rather than thinking about what happens to the IR radiation that is emitted by the surface, you need to think of where the IR that actually does escape the Earth comes from. The key is to think about the IR radiation that isn't absorbed by CO2, rather than the IR that is.
-
How we know the greenhouse effect isn't saturated
@30:
Actually, Venus gets even less solar energy than the Earth does!
Most sources I’ve found state that Venus’ albedo is about 75%, while the Earth’s albedo is 30%.
Taking into account the 91% higher insolation because of the shorter distance to the sun, the net result is that Venus receives about 32% less solar energy per unit of area than we do.If Venus had no greenhouse effect at all, its average temperature should be about -40oC, or more than 500oC colder than it really is! (Assuming the solar energy was evenly distributed. The temperature variations caused by the day-night cycle and different latitudes would lower the average temperature even more)
-
Dikran Marsupial at 23:42 PM on 18 February 2014How we know the greenhouse effect isn't saturated
gws wrote: "on your 1): see the post by Glenn @24: convection is contributing to heat transport from the surface to the atmosphere, but not the majority; that is still IR radiation"
I suspect you have misunderstood Glenn's post, IR radiation transfers heat from the surface to the layer of air immediately above the surface, where it is absorbed. Convection then transfers this heat to the bulk of the trophopshere.
"but "moving up" is not meant literally"
No, the height at which IR is radiated into space really does move up as more CO2 is added to the atmosphere. Think of the thickness of the layer required to obtain a certain level of opacity at the top of the atmosphere. As CO2 is added, this thickness decreases and so the bottom of the layer becomes higher. The bottom of this layer is then cooler (due to the lapse rate) and so emits less IR, creating the energy imbalance.
-
mgardner at 23:29 PM on 18 February 2014How we know the greenhouse effect isn't saturated
@29 gws
Thanks for your response, but I think you are misreading Glenn and the others. See Tom @21.I also think you are missing the point on the altitude question.
I'm hoping those guys can turn their attention to this when they are done pummeling Russ. I would have lost patience long ago.
-
michael sweet at 21:14 PM on 18 February 20142014 SkS Weekly News Roundup #7
Russ,
I am amazed that you want to continue. Did you read my post at 40? As Tom pointed out there were many more hot all time records during the time you are claiming it was cold. The winter is almost over so few additional all time records will be set, the summer has not started yet.
You said:
"Global warming? Are you serious? It's below freezing in Atlanta"."So what if it's hot in Australia. That's only a local weather event. Weather is not climate."
I am using the 2012 US weather instead of Australia, the Australia data are comparable to the US weather. In 2014, Georgia had it's 4th coldest January. It was the coldest state in the USA. This is not exceptional at all in a 120 year record. In March, 2012, 25 states had their all time heat records. There were 21 instances where the cold temperature at night was hotter than the previous high temperature ever recorded during the day. In a movie you would not believe it.
Do you really want to argue that a single state fourth coldest is equivalent to 25 all time record hot events? That is just the start. Here is the 2012 annual report.
In 2012 19 states recorded their all time record hot year, most were extreme hot, much hotter than previous years. 25 additional states had a top 10 year for a total of 45 out of 48 states. The remaining three were 11, 12 and 30th hot. The temperature was 1.0F hotter than the previous hot record from 1998, an unbelievable amount higher, these records are usually broken by hundredths of a degree. Billions of dollars of damage was recorded. Your pitiful daily records cannot be compared to this record breaking heat. It is expected that with thousands of locations that some records will be broken every year. It is becoming tedious to transfer these sad records from the NCDC archve, read the rest yourself.
Your assertion that your cold records are comparable to the heat records I have cited is absurd. I could match these records easily with the heat records from Australia. Your assertion that there is an equivalence between your "cold in Atlanta" and the scorching heat suffered across the country in 2012 is astonishing. I am stunned that anyone could write that with a straight face.
If you consider that one state fourth coldest for a month is equivalent to 25 hottest ever years shattering all previous records that we will have to end our discussion.
You are undoubtedly also ignorant about the economic effects of these heat waves. I will not waste my time documenting them for you since you have already made up your mind and are not open to reviewing the actual data. Read the comic I linked in 35.
God save us from this deliberate ignorance.
John Hartz: thanks for the ice water.
Moderator Response:[DB] You have made your point. That Russ refuses to concede does not overturn the fact that you have provided the strongest case. It is time to move on.
-
AndrewDoddsUk at 20:44 PM on 18 February 2014How we know the greenhouse effect isn't saturated
Ultra Basic Rebuttal : Venus.
Interesting factoid: because Venus has such a high albedo, both Earth and Venus have about the same incoming solar radiation. But Venus is several hundred degrees hotter.
-
Klapper at 17:31 PM on 18 February 2014Unprecedented trade wind strength is shifting global warming to the oceans, but for how much longer?
@HK #73:
Graph legend is in error running delta's are 15 year not 20.
-
Klapper at 17:24 PM on 18 February 2014Unprecedented trade wind strength is shifting global warming to the oceans, but for how much longer?
@HK #73:
I've analyzed your results using a rolling delta OHC anomaly using data from these sources:
In your analysis, which you don't describe or source explicitly you compared a 37 year delta, to a 17 year (exclusive), to an 8 year (overlapping). I'm not sure what the significance of these periods are as you don't elaborate.
I used a rolling 15 year delta OHC (NODC ZJ anomaly, creating the 700-2000m delta from the 0-2000 and 0-700 datasets. Following is a graph of the results:

As you can see from the graph, there were 15 year periods ending in the early 70's where the deep ocean heat gain was over 50% of the shallow ocean heat gain; certainly more than the last 15 years where the % of deep ocean is only +35% or so. I'm not sure how meaningful this comparison since the data are very sparse for the deep ocean, but I don't agree there has been an unprecendented amount of heat gain by the deep ocean relative to the shallow in recent years. Your theory might still be correct if you compared 500 to 300 metre data, or some other depth ranges, but what I have easy access to does not have the resolution.
Moderator Response:[RH] Hotlinked URL's that were breaking page formatting.
-
Klapper at 16:24 PM on 18 February 2014Unprecedented trade wind strength is shifting global warming to the oceans, but for how much longer?
@Michael Sweet #96:
My calculations weren't peer-reviewed, but then neither was anything in HK's post. In fact I used data used to produce all his graphs come from. However, that was on a different computer a long way's from me now and I note that currently links to ascii data on pentadal data seem to be broken, plus I can't find the composited pentadal data I used anyway, only gridded data.
I'll try to get the excel file sent from the computer's owner and post my graphs and numberical results.
-
Russ R. at 15:08 PM on 18 February 20142014 SkS Weekly News Roundup #7
Dikran Marsupial,
"I didn't express any desire to debate each of the 12 questions, just the first one,..."
My apologies, I interpreted your initial question as a prelude to a point-by-point debate over each of the 12 questions... something that would take much more time than I could hope to have. Hence my desire to stay focused on the Cook et al paper.
Going back to your question from the other thread (I'm not sure if it's poor etiquette to cross threads like this, but if it is, I'll blame you for doing it first).
"Russ R O.K. lets take the first one, what do you think the uncertainty is on the subject of GHG emissions in a "business as usual" scenario? Do you think they are going to be substantially less than RCP 8.5? If so, please explain why."
If there were no uncertainty, only one scenario would necessary. Personally, I believe that the RCP6.0 scenario is far more plausible than RCP8.5 for two reasons: the relationship between population growth vs. economic growth, and the relative cost of fossil fuels vs. alternatives.
1. As nations industrialize, their fertility rates plummet. (See every developed country on the planet.) I don't think it's likely we'll see a scenario where economies continue to grow rapidly and populations continue to grow rapidly at the same time.
2. 10 years ago oil cost $30/bbl and a solar panel or geothermal system cost a fortune. Two things have happened in the past decade... technologies have advanced bringing down the cost of renewable, carbon-neutral energy, while non-renewable resources have become more scarce, driving up the market price of of fossil fuels. (I'm in the process of converting my own home heating from electric to biomass, simply beause it costs less.) I don't expect either trend to reverse.
That said, I believe that even RCP6.0 could be sufficient for a "serious problem" depending on other factors.
-
John Hartz at 15:03 PM on 18 February 20142014 SkS Weekly News Roundup #7
All: It appears that this discussion will continue. Please keep it civil.
-
Bob Lacatena at 14:47 PM on 18 February 2014Customizable Global Warming Widget Metrics
I'm afraid not. It wouldn't be an effective metric. The Tsar bomb is about 1,500 times the energy of the Hiroshima bomb, which means the counter would "tick" once every 375 seconds, or a little less than once every six minutes. That's just not an effective display.
Choosing an effective metric is challenging. It can't roll the counter either too quickly or too slowly, and it must also be something which is somehow within the range of human experience (not firsthand, obviously).
Ideas for metrics are welcome, but to be effective a person must be able to visualize it, and it must also represent a value between 1014 and 5*1014 Joules per second. Anything outside of that range doesn't make an effective counter.
-
Russ R. at 14:35 PM on 18 February 2014MP Graham Stringer and CNN Crossfire are wrong about the 97% consensus on human-caused global warming
KR @29,
I had completely forgotten that we had previously debated this very issue at WUWT. Thank you for linking to it and refreshing my memory. Nice to see that some people can still be civil even when they disagree.
Anyway, having seen the less-than-polite response you got over there, I don't blame you for giving up in frustration. It's not easy trying to respond to a barrage of simultaneous attacks, as I'm finding out here.
If you disagree with the consensus measured by Cook et al, support your argument on the appropriate threads.
I don't disagree with it. At all. What I disagree with is misrepresenting that "97% Consensus", extending it to cover areas that it never addressed.
If you object to a public understanding of that scientific consensus, I would ask why you feel that policy decisions should be made under perceptual errors on expert opinion.
Far from objecting to a public understanding of the consensus, I feel that public dialogue should accurately reflect exactly what the study acutally found.
-
Russ R. at 14:05 PM on 18 February 20142014 SkS Weekly News Roundup #7
michael sweet,
This is getting a bit ridiculous. You accused me of starting an argument with a false premise:
"It is completely false to suggest that the current "cold" weather in the US East is unusual. All the reports say something like "coldest since 1996" or "coldest since 1985". Please provide evidence that the recent weather is unusual compared to the weather in 1930, or stop making this completely false argument."
I gave you a link to NOAA (http://www.ncdc.noaa.gov/cdo-web/datatools/records) showing that there were thousands of daily cold records , and 30 all-time cold records set in the USA so far this year.
But now you want to argue something different:
"The daily records are often for shorter length records. The all time records are the real hard ones and, as Tom pointed out, there are 4.5 times as many hot all time records during your "record cold" period than cold records."
That wasn't the premise of my argument. I fully agree that there have been more warm records than cold records set all over the map in recent years. No argument here. Continuing to argue this line is a waste of your time and effort.
You complained that my mere mention of cold records (not their relative number but their very existence) was a "comletely false argument" and "sloganeering". I think the data show otherwise.
Moderator Response:[DB] You continue to prosecute a specious point. Michael has provided the stronger case. As you still do not concede the point, it is time to let it go.
-
Russ R. at 13:38 PM on 18 February 20142014 SkS Weekly News Roundup #7
Tom Curtis,
You make two very good comments @26 & @28. I once again must commend your analysis. I'll take them one at a time.
First, on the subject of "what would falsify your beliefs", you write:
"In short, compelling evidence that:
- Green house gas concentrations in the atmosphere will not grow beyond current levels even with BAU; or
- Expected GMST increase with increased GHG concentrations is << 2 C by 2100; or
- Expected harm from GMST increases of 2 C or more are limited; or
- Costs of adaption sufficient to largely limit harm are less than the costs of mitigation; or
- Costs of mitigation sufficient to largely limit harm are likely to cause more harm than they mitigate,
I agree with you. The complexity makes it difficult to compile a list that is simultaneously concise and comprehensive, but you've done a nice job of sythesizing a number of critical factors. I'm glad to see that you've acknowledged these are "or" conditions, as well as recognizing that lower than expected risks across multiple factors in combination could result in no cause for alarm.
"please list your exhaustive criteria of all circumstances that would falsify your belief that global warming is not a problem requiring an urgent policy response."
My list a bit different from yours, mostly because it starts from a different default belief. You'll note it's similar to the 12 questions I posted previously, which you mentioned @28. I agree with your assessment that the criteria are not independent logic gates, rather they're a series of probabilty functions that must be assessed in combination. You've expressed this concept very well.
I've collapsed the original 12 questions into a slightly shorter list of 9 criteria. Of note is the "and" between each one. (However, #9 is more "desirable" than "critical".)
For the record, I would believe that global warming is a problem requiring an urgent policy reponse if presented with compelling evidence that:
- In a BAU scenario GHG emissions will continue at a rate faster than can be absorbed by the biosphere, resulting in significantly and unsustainably rising concentrations, and,
- The expected increase in atmospheric GHGs will result in a significant amount of warming, and,
- The warming and related changes (sea level rise, etc.) will occur over time periods that are meaningful relative to human lifespans, and
- The changes will meaningfully impact ecosystems, economies, societies and individuals (considering both positive and negative impacts), and
- The net cost / benefit of the expected changes will be negative, and
- There exist policy actions are likely to be timely, effective, politically feasible, economically viable, and
- The economic costs (along with unintended side-effects) are quantifiable with reasonably certainty, and
- The probability-adjusted future benefits of policy action (discounted to present value), exceed the real direct and indirect costs of taking action, and
- Ideally, the distribution of costs and benefits will be equitable and just (i.e. the benefits will accrue to everyone more or less equally, while the poor will be expected to bear proportionately less of the costs).
To hopefully avoid unnecessary arguments (as I should have done previously) let me spell out my own positions on each one.
- The evidence is abundant and highly compelling.
- The evidence is mixed. Computer models show high sensitivity, whereas estimates derived from observations are more borderline. (e.g. Otto et al (2013) best estimate of ECS was 2.0).
- The evidence is compelling.
- The evidence is compelling.
- The evidence is conditional. (Modest amounts of warming would be beneficial, greater warming would likely be negative. http://www.skepticalscience.com/copenhagen-consensus-center-climate-change-costly.html)
- The evidence is mixed. (Depends on the proposed policy action)
- The evidence is weak. (It is an exceedingly rare policy that does not in practice greatly exceed its expected costs or results in signifcant unintended side effects).
- The evidence is weak. (We could argue all day over the Stern Report).
- The evidence is mixed. (Again, depending on what policy is being discussed).
Only the first five criteria are scientific... the remainder are political and economic questions. So, of the five scientific criteria, I find compelling evidence for three, and mixed or conditional evidence for two (climate sensitivity and net cost/benefit of warming.)
Of the four political and economic questions (which I acknowledge, are not the focus of this site), I find very little compelling evidence, and accordingly, am only supportive of a small number of climate policies where the benefits would so overwhelmingly outweigh the costs, even if the scientific evidence were less compelling (e.g. ending subsidies for energy, taxing carbon in lieu of income).
-
michael sweet at 13:00 PM on 18 February 20142014 SkS Weekly News Roundup #7
Russ,
Perhaps you have never looked at the 2012 data, you appear to have mostly read skeptic blogs. This March 2012 report documents 15,272 warm records broken (in March alone), three times as many records as you cite for 6 weeks. There were 21 instances where the low temperature was warmer than the previous highest temperature ever measured!!! Imagine such extreme heat that the low temperature was hotter than the previous highest high!! 25 states had their all time hottest March ever recorded. Every state in the nation recorded a warm daily record. No states had an all time record cold month in the recent "record cold", there was one state that was 4th coldest. In the recent "record cold" California recorded its third warmest January ever. 25 states had their warmest Jan-Mar on record in 2012 as compared to one state that was fifth coldest in the recent "record cold".
When I talk about record heat I mean record heat!! You must withdraw your comments suggesting that denier claims about "record cold" equal scientists claims about record heat. There has not been a comparable cold event anywhere on the globe for at least decades. I can name a half dozen comparable hot episodes.
-
michael sweet at 12:29 PM on 18 February 20142014 SkS Weekly News Roundup #7
Russ,
Tom is on target again. The daily records are often for shorter length records. The all time records are the real hard ones and, as Tom pointed out, there are 4.5 times as many hot all time records during your "record cold" period than cold records. Ditto the monthly records.
I notice that you have not even attempted to match the 2012 CONUS all time record high temperatures. During that year there were thousands more hot daily records than cold records.
So you match my Royal Flush with a pair of tens. Big deal!!! Find some data that compares to the all time hot US record, the all time hot Australian record or the all time record floods that you first mentioned.
I could name a half dozen additional comparable hot records off the top of my head. You cannot find a single month, anywhere in the globe that is comparable. "Cold records" give me a break!!
-
Tom Curtis at 11:40 AM on 18 February 20142014 SkS Weekly News Roundup #7
I should probably also have noted the monthly records:
Year to date: 137 warm records, 133 cool records.
And that purportedly in a very cold winter for the US.
-
Tom Curtis at 11:33 AM on 18 February 20142014 SkS Weekly News Roundup #7
Russ R @36, why are you cherry picking just a single nation, over a period thought to be cold without comparing it to equivalent recent warm periods?
Indeed, why are you ignoring the all time records list from the page you link to:
Last 365 days: 187 warm records, 44 cold records.
And that on a purportedly cool year.
-
Russ R. at 11:15 AM on 18 February 20142014 SkS Weekly News Roundup #7
michael sweet,
"You continue to make the false claim that there was record cold recently. I provided data (NCDC website here) showing that your original claim of record cold in the USA was, in fact, only a normal cold front from 50 years ago. Deniers think it is cold since they do not look at the data. You have not provided data to support your claim."
Here's NOAA's data on record setting weather, both hot and cold: http://www.ncdc.noaa.gov/cdo-web/datatools/recordsYTD in the USA, approximatly 2.8x as many record low temperatures as record high temperatures (as I write this: 4790 low max and 3569 low min records vs. 1607 high max and 1349 high min records).
Is that sufficient data for you?
Moderator Response:[JH] Lose the snark!
-
jsmith at 09:27 AM on 18 February 2014Hockey stick is broken
The link to the Oerlemans paper is dead; consider replacing it with this: http://www.sciencemag.org/content/308/5722/675.full
-
Chemware at 08:52 AM on 18 February 2014Customizable Global Warming Widget Metrics
A request - would it be possible to add a "Tsar Bomba" metric - that being the most destructive thermonuclear device ever built by man:
http://en.wikipedia.org/wiki/Tsar_Bomba
It also gives an altternative to the Hiroshima metric that won't overflow in a few years time. -
michael sweet at 07:44 AM on 18 February 2014Unprecedented trade wind strength is shifting global warming to the oceans, but for how much longer?
Klapper,
Your post was deleted for sloganeering (I cannot delete posts, I am not a moderator).
In your post you discussed looking at data, but you did not show any results. You reached a conclusion that was unsupported, since no data was shown. Reaching unsupported conclusions several times in a row is sloganeering. My impression of your posts is that you are long on conclusions and short on data that supports your claims. In a scientific discussion you must support your claims with data, preferrably peer reviewed data. People used to posting on other blogs sometimes have difficulty with the concept of referring to peer reivewed data, since the style there is everyone just says what they think without any data. You might want to consider asking more questions and see what type of response you get.
It is much better to cite a peer reviewed publication to support your position than to make a calculation. Obviously a calculation you (or I) do is not peer reviewed. If a peer reviewed publication does not support your claim you might want to consider if it is reasonable. Can you really do these calculations when you cannot deal with gridded data (I doubt it)? Why should I believe your calculation?
While HK had calculations in his post, he showed the data and had 4 links to other graphs. His conclusions were pretty basic. (I read his conclusion as the problem is complicated. It requires detailed [peer reviewed] calculations to reach a conclusion).
moderator: delete my post if it is inaccurate.
-
gws at 06:00 AM on 18 February 2014How we know the greenhouse effect isn't saturated
mgardner,
on your 1): see the post by Glenn @24: convection is contributing to heat transport from the surface to the atmosphere, but not the majority; that is still IR radiation
on your 3): Yes, the insulation analogy works, aka more CO2 in a layer lets you make that layer thinner for the same opacity (of IR from the layer below reaching the layer above). More CO2 means such opagueness at a certain wavelength is achieved earlier, but "moving up" is not meant literally except in the sense that the whole tropospheric column has to warm, and thus any layer of a given tropospheric temperature will, on average, be at a higher elevation under an increased greenhouse gas concentration
-
jsmith at 05:45 AM on 18 February 2014CERN CLOUD experiment proved cosmic rays are causing global warming
I was looking for this argument on the "Climate myths sorted by taxonomy" page, but I could not find it. Is there a reason it isn't on that page, and if not, would someone who can consider adding it there? I imagine it should be added under "It's cosmic rays".
-
Klapper at 05:17 AM on 18 February 2014Unprecedented trade wind strength is shifting global warming to the oceans, but for how much longer?
@HK #73:
I agreed in theory with HK's post, but posted a rebuttal on how well it fits with numerical analysis of the NODC data. For some reason this didn't pass the censors so perhaps the moderator could explain why.
Thankyou.
-
10 Indicators of a Human Fingerprint on Climate Change
cynicalanddisgusted - Anthropogenic greenhouse gas trapping of IR adds about 100x the forcing to the climate as all of human energy use; see the waste heat discussions. Any move to a non-carbon based energy utilization will reduce global warming, including nuclear and solar.
It's important to actually look at the numbers.
-
cynicalanddisgusted at 03:31 AM on 18 February 201410 Indicators of a Human Fingerprint on Climate Change
Interestingly, some of the alternate energy sources proposed as soltuions will not work.
Nuclear - speeds the decay of nuclear materials which produces more heat now than the natural decay of these same materials in the earth.
Solar - If the CO2 traps radiation trying to exit the earth after reflection, than trapping it here at the surface just accomplishes the same thing in a more efficient manner.
Nuclear and Solar may be better than coal/oil, but will still cause global warming. Wind and Hydro capture energy that is already here and thus do not warm the planet.
-
michael sweet at 02:37 AM on 18 February 20142014 SkS Weekly News Roundup #7
This comic perfectly illustrates skeptics claims about recent "record" cold. Perhaps Russ should look up recent temperatures in Atlanta and check if they were unusual from 1900-1950. It is likely that the climate has changed and skeptics only remember the past 10-20 years when it has been much hotter from AGW. The recent "record cold" is only record compared to the heat from AGW. Scientists look at the entire record.
-
DSL at 00:16 AM on 18 February 2014CO2 lags temperature
dwm, the oceans do not give up their stored energy immediately. As Milankovitch cycling moves toward cooling, the surface layers may cool and increasingly absorb CO2, but warmer (relative to glacial conditions) water will continue to upwell for quite a while and prevent the kind of carbon uptake one might naively expect to see with a significant drop in insolation.
The "runaway catastrophic disaster scenario" hasn't happened before--and is not happening now (and no one but builders of straw men is saying so)--because conditions are not conducive. Yes, there are limiting factors. The logarithmically decreasing ability of additional GHGs to increase global energy storage is one limiting factor. The slightly spheroid shape of the planet we're on is another. Continental positioning is another. The general circulation regime at any given time is another. There's more here.
-
howardlee at 23:43 PM on 17 February 2014The Oceans Warmed up Sharply in 2013: We're Going to Need a Bigger Graph
Concerned citizen 60025- we are not still emerging from the last ice age.
The ice ages were contolled by orbital wobbles - Milankovitch cycles. They happen at a very well understood cyclicity. They predict we should be heading into the next ice age, which should cut-in by the year 3,500 AD.
Temperature records up to the industrial age show exactly that pattern - a slow decline since about 6,000 years ago. But all that cooling has been reversed in the last century or two. We have emphatically departed from the Milankovitch cycle of the ice ages and reversed 6000 years of cooling in a time period far, far shorter than the wavelength of orbital wobbles.
-
mgardner at 23:03 PM on 17 February 2014How we know the greenhouse effect isn't saturated
This is for everyone who has answered (mostly) in response to potvinj. Two comments and a question.
1) If everyone is in agreement that convection is the first-order mechanism for transferring energy from the surface to the upper level of the troposphere, from where it radiates to space, could you reference or produce a graphic that illustrates this? The images here and elsewhere seem to support the radiation-from-the-surface-up model.
2) For people in the colder parts of the world, I think there's quite a simple analogy that would be very accessible. Most of us are aware that the warm air in their houses rises to the ceiling, and that better attic insulation is one of the easiest ways to increase the temperature. We also have been exposed to the fact that different materials have different values of insulation.
I would explain the CO2 effect in these terms: A higher percent of CO2 in the upper layers of the troposphere is like replacing vermiculite (found in much older homes) with fiberglas; the R-value is greater, so your house is warmer for the same heat input. (I speak, grateful today, from the experience of having done it.)
3. Here I must admit my own confusion. Following the analogy, if I have better insulation, I need a thinner layer of it to achieve the same effect. So, as I add CO2, the thickness of a layer of atmosphere required to achieve opacity should decrease. Perhaps someone could, again, offer a diagram that give some kind of perspective or scale on those upper levels of the troposphere that are subject to the effect (not already opaque.) I think I understand the basic physics, but the expression "moving up" applied to either radiating or translucent layers is causing me trouble.
(Note: By opaque I mean absorbing and re-radiating all photons available.)
Thanks.
-
michael sweet at 21:11 PM on 17 February 20142014 SkS Weekly News Roundup #7
Russ:
You continue to make the false claim that there was record cold recently. I provided data (NCDC website here) showing that your original claim of record cold in the USA was, in fact, only a normal cold front from 50 years ago. Deniers think it is cold since they do not look at the data. You have not provided data to support your claim. Your false equivalence where your say both sides refer to weather has been shown to be a rhetorical device. It is record hot, it is not record cold. Provide data showing a month of cold in the last five years anywhere in the world that was 1F colder than the previous record for that area. I provided data showing the USA in 2012 was 1F hotter than any previous record for the entire year.
When scientists say it is record hot it is record hot. When deniers say it is record cold, it is normal for 50 years ago. That is not an equivalent argument.
It is sloganeering to continue to post claims that have been shown to be false. Everyone else reading your posts sees that you continue to post claims you have not supported.
Moderator Response:[JH] As you correctly point out, Russ R is now skating on the thin ice of sloganeering and excessive repitition - both of which are prohibited by the SkS Comments Policy. Future posts by Russ R that violate either of these prohibitions will be summarily deleted.
-
dwm at 20:18 PM on 17 February 2014CO2 lags temperature
So...exactly why on all of these previous cycles where according to the author the sun precipitated a feedback loop causing the ocean to release carbon which then increased the warming so that the ocean then released more carbon...did temperatures begin to drop just as the carbon level was peaking? As documented here, the level of carbon lagged, so just as it was reaching record highs on each occasion temperatures began to drop of their own accord (because of some set of not yet understood mechanisms), but there is no reason given by the author as to why that was the case.
Why has the runaway catestropic disaster scenario never unfolded before, where the rise in carbon would trigger warming to the degree that permafrost melts, adding methane, more warming, more carbon release from the oceans, ecetera, until the earth boils itself into a dry wasteland...?
Something, or likely a whole host of things, have been obviously keeping it in check. -
Marshall119 at 19:46 PM on 17 February 2014MP Graham Stringer and CNN Crossfire are wrong about the 97% consensus on human-caused global warming
Russ R. - In my reading of all the comments on the WUWT post you cited, the author did address the ECS vs. TCR issue. Are you saying it wasn't adequately resolved?
-
Dikran Marsupial at 19:14 PM on 17 February 20142014 SkS Weekly News Roundup #7
@Leto, that is pretty much why I included the part about the statistical power of the test - which is the frequentist answer to that issue (I prefer the Bayesian one myself).
Prev 756 757 758 759 760 761 762 763 764 765 766 767 768 769 770 771 Next


