


 Arguments


Recent Comments
Prev 777 778 779 780 781 782 783 784 785 786 787 788 789 790 791 792 Next
Comments 39201 to 39250:
-
Climatemama at 22:16 PM on 20 January 2014Heat widget viewed more than one million times at over 60 blogs
Love the widget! Another "tool" for those in our ClimateMama community to use to communicate the facts with the kids in their lives, neighbors, friends etc..Thanks for helping make the complicated, easier...
-
barry1487 at 21:37 PM on 20 January 2014Australia’s hottest year was no freak event: humans caused it
bruiser @ 13,
Eyeballing the BOM average and anomlay maps, the amount of solar exposure for NSW over 2013 was about average.
Are you able to furnish data links to corroborate what you're saying?
Lower humidity should in general equal cooler minimums in the dark hours. You might want to check 2013 minimum temps to get more insight. If minima were still anomalously high in low humidity periods, then that's going to put a hole in your theory.
-
bruiser at 20:16 PM on 20 January 2014Australia’s hottest year was no freak event: humans caused it
2013 is a poor example to choose as the poster child for AGW. In fact, quite the opposite. Taking Sydney as an example, new records for solar radiation were set for May, July, August, September, October and December. The average monthly maximum temperatures track the solar radiation trends. The really hot days seem to correlate closest to low humidity; suggesting that the absence of H2O allows transmission of more solar radiation. All three climate systems, IOD, ENSO and SAM favour dryer conditions across Australia.
-
Rob Painting at 20:14 PM on 20 January 20142014 SkS Weekly Digest #3
I agree with your last sentence, but my sentiments are directed at the anonymous blogger calling himself Steve Goddard. Maybe he has discovered some flaw in the NOAA US surface temperature time series, or maybe he hasn't. Goddard has form for making all sorts of ridiculous claims, which suggests digging into his latest claim is likely a ginormous waste of time. Can you summarize what he thinks he may have found?
-
Poster9662 at 19:18 PM on 20 January 20142014 SkS Weekly Digest #3
OK I just did see something so I suppose I'd better say something. I hope this comment isn't disappeared because it is deemed to be off topic. Steve Goddard in his blog Real Science has been looking at the NOAA adjustments to the US Historical Climate Network (USHCN) temperatue readings and makes this comment "I spent the evening comparing USHCN V1 and V2 graphs, and discovered a huge discrepancy between their V1 and V2 adjustments". tinyurl.com/k8qh4zf He discusses these at length. It is this type of report that creates unease in many as it suggests that results from "official bodies" might be not be entirely what they appear to be. This, I think, does a disservice to all who are involved in studying the climate.
-
barry1487 at 17:44 PM on 20 January 2014Australia’s hottest year was no freak event: humans caused it
@4, 9 & 11,
Spencer was asked if the parameters he used for RCP85 projections were the same as the parameters for observations (mid-troposphere 20S to 20N). Last I looked, he hadn't answered the question.
As has been mentioned already, that problematic (error-prone) data is a pretty thin slice of the global budget. Essentially his graph is about the tropospheric 'hotspot'.
-
MA Rodger at 08:14 AM on 20 January 20142013 was Australia's Hottest Year, Warm for Much of the World
Tom Dayton @45.
You say you are "unsure whether he is trolling or is sincerely incapable of having a coherent discussion". Do you consider it would be worth the time explaining the obvious errors in MoreCarbonOK's 'maxima' results? Or would such explanation be too challenging for its recipient?
Moderator Response:(Rob P) - Note that several posts have been deleted primarily because they are off-topic. Further excursions away from the topic of this post may likewise attract the same response.
-
grindupBaker at 07:47 AM on 20 January 20142014 SkS Weekly News Roundup #3
Slight snag with "...it's cold outside, like during this recent ..." article, it isn't cold outside and it wasn't before. Rain stopped today Sunday 9C going to 13C Friday and I'm out now for quick bicycle to the border. I think this U.S. (?) might be other side of that border, I'd like to hear more about the place.
-
Prufrocks at 06:04 AM on 20 January 2014Australia’s hottest year was no freak event: humans caused it
Topal@4, there's a reason why Roy Spencer uses rcp85 for every one of his 73 comparison model simulations.
And there's a reason why Spencer compares those rcp85 runs reflecting global average temp anomalies with balloon and satellite observations for only 20S-20N.
Moderator Response:Fixed link
-
Tom Dayton at 04:33 AM on 20 January 20142013 was Australia's Hottest Year, Warm for Much of the World
Really, everybody, it is pointless to try to converse with Henry Pool (MoreCarbonOK). He reads little or none of the scientific literature no matter how precisely people point him to it. Despite that he continues to object that there is no scientific evidence. He switches topics at the drop of a hat, then a long time later brings them up again out of the blue, in the process abandoning whatever other discussion he had initiated. I'm unsure whether he is trolling or is sincerely incapable of having a coherent discussion, but the effect is the same waste of everyone's time in either case. An example is a long string of his comments and multiple people's replies back in 2009.
-
MoreCarbonOK at 03:46 AM on 20 January 20142013 was Australia's Hottest Year, Warm for Much of the World
Tom Curtis
I will just note that by treating his "biblical connection" and his purportedly emperical findings equally as "scientific evidence", Pool has showed that is purported science is just religion in disguise.
Henry says
I did not call you Curtis, did I?
In fact, it shows your lack of respect for an opinion based on my own observations that is not yours or the scientists that you believe in. Anyway, I lost you on your argument. Are science and religion not supposed to work together to find the truth? Perhaps you should watch this program
http://www.youtube.com/watch?v=WNJPJ4JwHeE
and see how science and religion can work together to establish the truth.
God bless you all who keep looking for the truth/Truth
Henry
-
Tom Curtis at 00:58 AM on 20 January 2014Australia’s hottest year was no freak event: humans caused it
Topal @4 seems to think the models run hot. That is, if the models were accurate, both temperature distributions in the final figure above should be shifted to the left. The effect of this, depending on the size of the shift, would be to make Australia's observed 2013 temperature less probable for both natural and natural plus anthropogenic forcings. The effect, however, is not equal. A shift of 0.5 C, for example, would reduce the probability of a year at least that hot from about 30% (1 SD) to about 5% (2 SD) with anthropogenic forcings, but from about 0.25% (3 SD) to about 0.006% (4 SD) for natural forcings only. The reduction factor would be far greater for the natural forcings only than for all forcings.
-
Tom Curtis at 00:37 AM on 20 January 20142013 was Australia's Hottest Year, Warm for Much of the World
MoreCarbonOK @42:
"So, to sum it up, my scientific evidence for natural climate change ... include
...
5) the quoted biblical connection"
Henry Pool (MoreCarbonOK) clearly doesn't get it, so possibly others will not either.
The fact is that the "biblical connection", which is a mere numerological coincidence, is not scientific evidence of any sort.
It is not even theological evidence - even if we accept the Bible as a divinely inspired revelation. No book or verse in the Bible says that there 50 half wave length cycles in warming and cooling. Therefore, even if you accept Christian or Judaic relegious claims, the mere mention of a 50 year interval in the Bible is not evidence of a 50 year climate half-cycle.
But even if it was theological evidence, that would not make it scientific evidence. It would have no bearing on the science, one way or another. The only way it could be supposed to be evidence is if you think that finding any coincidental period equating to what you have decided you want to find counts as evidence. But that being the case, that is also Pool's standard when studying emperical data. He approaches the data not to find what it says, but to find how it can be contorted to suport his preexisting opinion.
With that approach, Pool will sift through data to find the pattern he wants to find. If a paleoclimate paper does not show his 90-100 year cycle, he will simply ignore it - and likewise with all contrary evidence. But any data which does show it (and some must inevitably among all the data around, even just by coincidence), he will trumpet as proof of his theory with no more warrant than his trumpeting of the years of Jubilee.
Added in edit:
I will just note that by treating his "biblical connection" and his purportedly emperical findings equally as "scientific evidence", Pool has showed that is purported science is just religion in disguise.
-
jgnfld at 21:42 PM on 19 January 2014Australia’s hottest year was no freak event: humans caused it
@4 What possible connection between GLOBAL warming(black line) or USA warming (dotted line) in the LOWER troposphere--which is what the models are predicting--and REGIONAL warming in the MIDDLE troposphere in the TROPICS from 20S to 20N are you trying to draw? Be specific.
Looking at the labels on a graph is important.
-
Stephen Ferguson at 21:01 PM on 19 January 2014Methane emissions from oil & gas development
newairly @21 & gws @23
Surely focussing on electricity generation alone gives a false sense of security about what level of fugitive emissions of natural gas produces the same global warming effect as coal?
In the US for example, the vast majority of coal (~90%) is burnt by the electric power sector, whilst the majority of natural gas (~70%) is burnt or otherwise consumed by innumerable much less efficient end users across the economy (namely in sectors covering residential & commercial buildings, industry and transportation).
My understanding is this the main reason why Howarth et al from Cornell University rejected the electric power sector-only comparison between gas and coal as flawed is because gas in particular is burnt with very high efficiency in power stations. In isolation, this scenario takes a flatteringly high amount of methane leakage to achieve the same global warming effect as coal - namely the 7.5% figure given above by gws.
However what of all the other energy uses of natural gas? Howarth et al took this into account by normalising the quantity of energy released at the time of combustion. This seems to me to be a far more realistic approach, but one that unfortunately results in a far lower methane breakeven leakage rate. My recollection is the Howarth et al methodology produces a far less comforting breakeven leakage rate of only ~3%, which is well in line with the recent Miller et al findings on actual methane leakage rates.
Ref "Methane and the greenhouse-gas footprint of natural gas from shale formations" (Robert W. Howarth,Renee Santoro,Anthony Ingraffea)
-
Tom Dayton at 13:17 PM on 19 January 2014Other planets are warming
No, mkuske, I did not assume that equilibrium was reached almost instantly. Read my reply to you again. Carefully. Really, read it. All of it. Then refrain from typing for awhile, ponder, and read it again. All of it.
-
Daniel Bailey at 12:21 PM on 19 January 2014Other planets are warming
mkuske, please do not refresh the page after submitting a comment. Doing so inserts a duplicate of your just-submitted comment. Thank you.
-
denisaf at 10:44 AM on 19 January 2014Australia’s hottest year was no freak event: humans caused it
The principle requirment is to convince the powerful and the masses to adopt measures that will ameliorate and adapt to the irreversible rapid climate change that is under way. That objective will be fostered by emphasising that it is the technological systems that are emitting the greenhouse gases. That is obvious to the technically inclined but not to the masses."humans caused it" in the title of this article is conveying a false impression that will not help in acceptance of the insight provided.
-
mkuske at 10:42 AM on 19 January 2014Other planets are warming
Tom Dayton, I also find it interesting and somewhat amusing the differing standards that are applied. For instance, the reason given for solar activity not causing global warming is that solar activity has retreated ever so slightly (while still being at an atypically much higher rate over an extended period of time). Meanwhile the Earth's temperature virtually flat-lining over a period of time in which CO2 has been released into the atmosphere at the highest rate ever is in fact accepted.
Moderator Response:[DB] This thread is about other planets' warming, or not. If you wish to discuss whether global warming has continued over the recent decade+ period, go to this thread where they explain why you are very, very wrong:
Global warming since 1997 more than twice as fast as previously estimated, new study shows
Further, you should also review this post:
-
mkuske at 10:26 AM on 19 January 2014Other planets are warming
Tom Dayton, First I'll acknowledge that this is a simplistic analogy. However, you're assuming that the Earth has in fact reached the equilibrial state for the amount of increased activity from the Solar Grand Maximum (Modern Maximum), likewise assuming that the equiibrial state would be met almost instantly (in the larger picture of time).
Just like the temperature of the brisket doesn't instantly jump to 350 degrees just because the oven around it did, neither does the Earth when irradiated by the Sun. In fact the oven could heat to 350 degrees in minutes but it would take hours for the brisket to reach that temperature.
In this analogy the brisket only increases in temperature if affected relatively constantly by the heat input of the oven over an extended period of time. Also when the brisket is cooked, it doesn't immediately express it's stored heat and become room temperature, it releases it over time. After all you don't have to heat it back up 5 minutes after it comes out of the oven. Likewise if it's been out of the oven for 30 minutes and you do want it a little warmer, you don't have to cook it for an hour again, starting from scratch. It has stored some of that heat radiation and gets to temperature much more quickly. Likewise the Earth would not immediately express its stored energy especially considering it -- until very, very recently -- has been exposed to a fairly constant and atypical excess of irradiation from the Sun.You're assuming that the Earth -- and rest of the solar system -- has reached the temperature that it would if the Solar Grand Maximum were the typical constant state.
In this analogy, what is typical for the brisket is the 175 degrees worth of heat radiation from the oven. What's typical for the Earth is a normal non-Solar Grand Maximum fluctuation of radiation from the Sun. The brisket only heats because it is exposed to a constant yet atypical 350 degrees of heat radiation from the oven before the oven drops slightly to 325 degrees, as the Earth has been exposed to an atypical and constant amount of the Sun's increased energy, even though there has been the slightest dip in activity -- which is still being atypical.
And the constancy is important. After all if you turn the stove on for 15 minutes, then turn the stove off for fifteen minutes, then turn the stove on for fifteen minutes, then turn it off for fifteen minutes and continue on that way, you won't get very far at cooking your meat as the brisket will barely have time to absorb more enegy than it expresses. Keep that oven on for 45 minutes though, with the meat continuing to absorb more and more heat and what happens? Your brisket gets cooked. As for Earth -- and the rest of the solar system -- because of the extended Solar Grand Maximum, the Earth has been in the "oven" and constantly asborbing a hightened level of radiation for an extended period of time (since approximately 1900). That doesn't mean it met its equilirial temperature for that heightened state of solar activity.
-
Tom Curtis at 10:04 AM on 19 January 20142013 was Australia's Hottest Year, Warm for Much of the World
An addendum to my @39, I have just been perusing MoreCarbonOK's website, and came across some of the "scientific" evidence he adduces for his theories:
"THE BIBLICAL CONNECTION
My A-C wave for the drop in maximum temperatures obviously does not reflect exactly at the same time what happens to temperatures on earth. Earth has an intricate way of storing energy in the oceans. There is also earth’s own volcanic action, lunar interaction, the turning of Earth’s inner iron core, electromagnetic force changes, etc. It seems to me that a delay of about 5 years either way is quite normal. That would place the half cycle time as observed from earth at around 50 years, on average. 50 years of warming followed by 50 years of cooling. It seems to me the ancients knew this. Remember 7 x 7 years + 1 Jubilee year?"
Might I suggest that he debate his religious views somewhere more appropriate. It is plain he has no scientific views on this subject.
-
Tom Dayton at 09:50 AM on 19 January 20142013 was Australia's Hottest Year, Warm for Much of the World
MoreCarbonOK is Henry Pool, who behaved similarly on other topics in 2009--for example, claiming that evidence is "hidden" when it is in papers that are published but require fees or (horror!) a visit to a library. I suggest we all give up on him again, because he has repeatedly demonstrated he is uninterested in actual discussion.
-
Tom Curtis at 09:38 AM on 19 January 20142013 was Australia's Hottest Year, Warm for Much of the World
MoreCarbonOK @27 made a specific claim:
"[I]f more carbon dioxide (CO2) or more water (H2O) or more other GHG’s were to be blamed for extra warming we should see minimum temperatures (minima) rising faster, pushing up the average temperature (means) on earth.
That is not happening."
(My emphasis)
I showed @28 from a peer reviewed paper that it in fact was happening, contrary to his emphatic claim. So, @29, he simply changes the subject. Rather than acknowledge his error, he talks abotu something else. What is worse, having set up the DTR as a predicted consequence of an enhanced greenhouse effect, when he finds the test returns the results predicted by the enhanced greenhouse effect he changes the predicted cause.
Very clearly, he is not going to allow evidence to stand in the way of his beliefs. Nor will he acknowledge any of the frequent errors he makes when they are pointed out to him. There is no point, IMO, in further discusion with somebody so lacking in intellectual integrity.
-
Tom Dayton at 08:58 AM on 19 January 2014Other planets are warming
mkuske, also see the post "It's the Sun." Be sure to read the Basic tabbed pane, then the Intermediate one, then the Advanced one.
-
Tom Dayton at 08:46 AM on 19 January 2014Other planets are warming
mkuske, the only way your analogy is valid is if the brisket has not yet reached the oven's temperature of 325 when you lower the oven's temperature from 350 to 325. The oven is still warmer than the brisket, so of course the brisket continues to warm toward that temperature of 325. If instead the brisket has reached the equilibrium temperature of 350 before you lower the oven's temperature to 325, then the brisket will start to cool down from 350. (And it will cool slower than the oven does, because the brisket has greater thermal mass than the oven's air.)
But let's skip your analogy and use the real Earth. You are implying there is a lag between the increased incoming energy from the Sun and the Earth's heating. You are quite correct. Assuming the Earth initially was in thermal equilibrium (same energy coming in as going out to space), an increase in the energy coming in from the Sun will cause energy immediately to start accumulating in the Earth (by which I mean the atmosphere, surface land, surface water, deep oceans--the whole shebang). But that extra energy is distributed among all the components of "the Earth," which takes time. So although parts of the Earth immediately start heating, there is a lag before the entire Earth system reaches a new temperature. If the Sun's input stops increasing--flattens out--then the Earth's energy indeed will continue to increase, but only until it reaches equilibrium.
But simultaneously, as the Earth's temperature increases, the Earth emits more energy to space. So as soon as the Sun's input to the Earth flattens, the energy imbalance in the Earth (energy in minus energy out) instantly starts decreasing. That makes the rate of temperature increase slow down. But that is not what has been happening. Instead the energy imbalance has continued to increase, and the rate of temperature increase has not slowed. Also, we have a large amount of empirical evidence of the length of the lag between a change in the Sun's input to the Earth and the resulting temperature change (e.g., the Sun's 11-year cycle and volcanic eruptions of large amounts of reflective aerosols). The lag is not nearly as long as the time in which the Sun's radiance has been flat.
For more details, and for a more proper place to put your comments on this topic, see the post "Climate time lag."
-
nigelj at 08:13 AM on 19 January 2014Australia’s hottest year was no freak event: humans caused it
Topal #4. Regarding your link, what makes you think satellite or ballon data is the full story on temperature trends? There are questions about the accuracy of both. You are better to average all datasets from atmospheric to surface based. I think if you do that, the IPCC predictions have been reasonable.
-
mkuske at 07:42 AM on 19 January 2014Other planets are warming
This defense of position is particularly poor and can be refuted by a simple 5th grade-level experiment. Take a brisket and put it in your oven, setting the oven at 175 degrees Fahrenheit. After an hour check the brisket's temperature. Put it back in the oven and raise the oven's temperature to 350 degrees Fahrenheit for twenty minutes. After twenty minutes, take it out and check the brisket's temperature. It went up right? Now put the brisket back on the oven and lower the oven's temperature slightly to 325 degrees Fahrenhiet for a half hour. Take the brisket out and check it's temperature. The temperature of the brisket will have continued to rise! "How is that?", you seem to say, "How could the temperature of the brisket continue to rise when the temperature of the oven went down by 25 degrees?" Your "defense" is that the oven couldn't be warming the brisket because the brisket didn't cool when the oven's temperature was slightly lowered -- even though the oven's temperature was still well above the brisket's point of stasis. Seriously???
-
grindupBaker at 06:36 AM on 19 January 2014Australia’s hottest year was no freak event: humans caused it
william #5 I see no quantification in the article at your link. Sans quantification it says nothing useful regarding the current ultra-short-term topic of a few decades of big, quantified, warming (maybe bodes even extra badder for Aus over the century). Interesting in its own right of course.
-
william5331 at 04:29 AM on 19 January 2014Australia’s hottest year was no freak event: humans caused it
I'm no climate change denier. I think the climate is changing and the results will be pretty nasty. However a tad of scepticism is in order. A study mentioned in the following link in which isotopes in the rings which occur in stalactites suggested that Aus is going into a natural dry period. (if the past was the wet period, what must the dry look like??). Presumably less rainfall will lead to generally hotter conditions. Aus may be in for a double whammy.
http://www.smh.com.au/environment/climate-change/every-drip-has-a-climate-story-to-tell-20100711-105pv.html
-
George Fleming at 03:37 AM on 19 January 2014Matt Ridley's misguided climate change policy
To understand skeptics such as Matt Ridley, the best aid is Mark Twain:
"...There is something fascinating about science. One gets such wholesale returns of conjecture out of such a trifling investment of fact."
To get the full impact of this statement, see how he prepared the ground at:
http://www.twainquotes.com/Conjecture.html
-
Rob Honeycutt at 03:27 AM on 19 January 20142013 was Australia's Hottest Year, Warm for Much of the World
MoreCarbonOK... What I did above was to crop your image down and then resize it to 550 pixels wide. Anything wider than that breaks the formatting of the entire page.
You can also limit the image width by going to the second tab within the insert image dialog box. That will tell you the current width and you can just change the number to something smaller than 550 px.
-
MoreCarbonOK at 03:04 AM on 19 January 20142013 was Australia's Hottest Year, Warm for Much of the World
wow
I am getting the hang of this
sorry I am such an old fart
-
MoreCarbonOK at 03:03 AM on 19 January 20142013 was Australia's Hottest Year, Warm for Much of the World

I hope this works
Moderator Response:[RH] Fixed image width. I may have accidentally deleted part of your comment while I was fixing the image. If so, sorry about that.
-
MA Rodger at 02:14 AM on 19 January 20142013 was Australia's Hottest Year, Warm for Much of the World
Instruction for Inserting Images into Comments
The image you want to insert has to be already on the web. Even so, some locations are not useful (ie an image on Googlesites will only work for people who are logged into Google. All others see nothing.)
(1) Obtain the URL of the image (Right click on it & 'Copy Image Location')
(2) In SkS text editor, position your cursor where you want the image inserted.
(3) Click the 'Insert/edit image' button on the 'Insert' tool bar.
(4) Paste in the image URL. The text editor also likes an 'Image Description' so type in a short descriptor.
(5) The second page of the 'Insert/Edit image' window - 'Appearance' - allows you to set the image size (amongst other stuff). Ensure the 'constant proportions' box is ticked. The lefthand 'Dimensions' box gives full width at 500px. An image above this width will overflow the thread so adjust accordingly.
(6) Be mindful that the image may be lacking its caption. And crediting the source is a common courtesy.
Thus:-
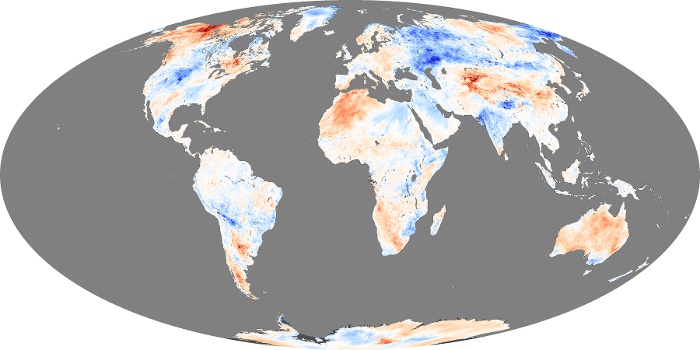 October 2013 temperature anomaly map (2000-8 base) as cherry-picked by Wattsupian Easterbrook. Image source - NASA Earth Observatory.
I think that is all you need to be aware of.
-
MoreCarbonOK at 02:06 AM on 19 January 20142013 was Australia's Hottest Year, Warm for Much of the World
@MA Rodgers
Sorry I did not comment on your post, I am puzzled as to what best is and what it represents. I suspect it is not a global data set? The 2010 cooling looks a bit extraordinary to me as well. Perhaps you can explain this to me, before I make a comment on that graph?
@ composer99
1) I picked all 4 major global data sets (except UAH)
2) Yes, you must know or figure out (preferably use your own method, so that you can be convinced yourself) when earth reached its highest output. To me, it looks like 1995, when looking at energy-in and 1998 when looking at energy-out.
hence, if you look from around that time, most data sets (including my own 3 data sets) will show global cooling from the turn of the millennium
Whatever the case, it is certainly not wrong to say that earth is cooling from around 2000.
In fact, I am saying we should get worried about it.
http://blogs.24.com/henryp/2013/04/29/the-climate-is-changing/
-
Mike3267 at 01:32 AM on 19 January 2014High-stakes climate poker
In 2008 Stern doubled his estimate of mitagation costs to 2% of global GDP. By comparison the world spends about 2.5% of GDP on military.
-
Composer99 at 01:28 AM on 19 January 20142013 was Australia's Hottest Year, Warm for Much of the World
MoreCarbonOK:
Per your comment #29 it is of course the case that if, you pick a temperature dataset, ignore the underlying physics when performing mathematical operations to it, and selectively cherry-pick the dates to start your trend lines, you will see what you want to see. Which in this case appears to be global cooling.
Of course, it is also the case that if you have jettisoned physics and correct dataset analysis in order to see what you want to see, that what you see (global cooling) will be a spurious artifact. As, indeed, it is.
-
MoreCarbonOK at 01:19 AM on 19 January 20142013 was Australia's Hottest Year, Warm for Much of the World
@MA Rodgers
Thanks, it would be nice if you can help me
here is the picture I wanted to show initially
to tell you not to worry about the warming in Australia
but to start getting worried about the cooling in Alaska
but I am not yet sure how to put it up here as an image in the comment
-
MA Rodger at 00:42 AM on 19 January 20142013 was Australia's Hottest Year, Warm for Much of the World
MoreCarbonOK @30.
While I assisted in your desire to link to WoodForTrees, I refrained from commenting about the substance of that linkage. I do so now.
You are indeed "cherry picking" with the graph you present, both in the temperature series you choose and in the time periods chosen for analysis.
Note the plot below where a negative trend is only achievable by creating a significant discontinuity with the past. The analysis 2002-2014 is obviously absurd.
Re your comment @20 - Do you still want instruction on inserting images?
-
MoreCarbonOK at 23:55 PM on 18 January 20142013 was Australia's Hottest Year, Warm for Much of the World
add to 29
sorry, I see there was no title in that display of all the data
it should be: Global cooling since 2000 (Earth Observatory)
The display is a bit more graphical than
-
MoreCarbonOK at 23:45 PM on 18 January 20142013 was Australia's Hottest Year, Warm for Much of the World
Tom Curtis says
the cause of our current warming
but
You can see that Australia is the exception, which, as I have explained before is probably due to it getting drier, i.e. less clouds, and as result more sunshine hours.
If you guys are from BOM I will also bet that if you do trending on rainfall, you will find some increase in rainfall in the lower [latitudes] and some decrease in rainfall at the higher [latitudes].
"a reduction in the Diurnal Temperature Range (DTR):"
this will (also) happen when the maxima are dropping, faster than that the minima are dropping (but they are also dropping)
That this is happening and for you to see that this is happening you have to try and understand
If you set the speed of warming out against time (years) you will see that there is high correlation on binomials for all three maxima, means and minima. Use the 4 reported figures of the speed on the bottom of each table and set those out against time. You then get acceleration, or on this case, deceleration of warming
in degrees C / annum2
Hope this helps.
-
Tom Curtis at 16:58 PM on 18 January 20142013 was Australia's Hottest Year, Warm for Much of the World
MoreCarbonOK @27:
"[I]f more carbon dioxide (CO2) or more water (H2O) or more other GHG’s were to be blamed for extra warming we should see minimum temperatures (minima) rising faster, pushing up the average temperature (means) on earth."
Exactly. If the enhanced greenhouse effect is the cause of our current warming, night time temperatures should warm faster than daytime temperatures, resulting in a reduction in the difference between daytime maximums and nighttime minimums, ie, a reduction in the Diurnal Temperature Range (DTR):

Of course, as can be seen above, or in the original article, that is exactly what we do see.
What I am puzzled by is your treating the successful prediction of an observation by a theory as disproof of the theory.
(Edited to correct error in figure.)
-
MoreCarbonOK at 16:24 PM on 18 January 20142013 was Australia's Hottest Year, Warm for Much of the World
@ Tom Dayton
if you are interested you can read some of my arguments here:
http://blogs.24.com/henryp/2011/08/11/the-greenhouse-effect-and-the-principle-of-re-radiation-11-aug-2011/
I figured that the proposed AGW mechanism implies that more GHG would cause a delay in radiation being able to escape from earth, which then causes a delay in cooling, from earth to space, resulting in a warming effect.
It followed naturally, that if more carbon dioxide (CO2) or more water (H2O) or more other GHG’s were to be blamed for extra warming we should see minimum temperatures (minima) rising faster, pushing up the average temperature (means) on earth.
That is not happening. This was already apparent to me from the 2007 IPPC AR4 report.
-
topal at 15:53 PM on 18 January 2014Australia’s hottest year was no freak event: humans caused it
How well have models performed so far? See IPCC's CMIP5 http://www.drroyspencer.com/wp-content/uploads/CMIP5-73-models-vs-obs-20N-20S-MT-5-yr-means1.png
-
DavidFaubion at 15:35 PM on 18 January 2014Breathing contributes to CO2 buildup
Factor in all the fuel and oxygen spent in agriculture, storage and transport. Then, calculate how deep each of our carbon sink is on average. The more local our food source, such as our back yards, the deeper your carbon sink. Can we dig the treasure of honest living on the beautiful Earth?
-
wili at 15:32 PM on 18 January 2014Australia’s hottest year was no freak event: humans caused it
And now CA seems to be drying up, burning down, and blowing away!
http://www.cnn.com/2014/01/17/us/california-wildfire/
-
chriskoz at 11:44 AM on 18 January 2014Australia’s hottest year was no freak event: humans caused it
smh env editor Peter Hannam has noted in his latest piece Scorchers: the reality of a sunburnt country:
Before the 2009 [...] Black Saturday bushfires, Melbourne had never recorded a day where the temperature averaged above 35 degrees. That event delivered two of them.
This week's heatwave [...] delivered three more such days with average temperatures over 35 - and a record four days with maximums over 41 - in a row.
So, from the climate perspective, the 2014 heatwave is more remarkable than that famous 2009 devastation because it was even more extreme.
People (except few BOM analysts and climatologists) obviously will not think of it as such because there were no "big fires" (as yet, thankfully Black Saturday-like strong winds have been missing us), so we need to trumpet this news throughout: folks, 2014 is even more extreme than 2009! We've beat that famous extreme record in just 5 years and under ENSO neutral conditions!
-
Riduna at 10:42 AM on 18 January 2014Australia’s hottest year was no freak event: humans caused it
Interestingly, 2013 records were set in the presence of an ENSO hiatus. 2014 is likely to see development of an El Niño resulting in surface temperatures exceeding those of 2013.
South Eastern Australia has already had its first heat-wave of 2014 with sustained temperatures exceeding 40°C for >3 consecutive days causing bushfires which have ravaged over 500,000 ha of South Australia and Victoria.
In terms of premature deaths and property loss, it is possible that 2014 will set new records, possibly exacerbated by El Niño induced drought affecting stock and agricultural yields. The immediate future is far from bright.
Unfortunately these outcomes are compunded by public policy which is, nominally, predictaed on recognitiion of anthropogenic global warming but in practice seeks to significantly increase the production, export and use of fossil fuels.
-
Tom Dayton at 09:49 AM on 18 January 2014Global warming stopped in
1998,1995,2002,2007,2010, ????
Andrew Dessler reproduced The SkS Escalater in his U.S. Congressional testimony yesterday.
-
DSL at 07:52 AM on 18 January 2014Global warming stopped in
1998,1995,2002,2007,2010, ????
On a side note, I have to point out that Henry P's analysis should be submitted for publication. It's perfect for a journal like, oh, Pattern Recognition in Physics.
Prev 777 778 779 780 781 782 783 784 785 786 787 788 789 790 791 792 Next


