


 Arguments


Recent Comments
Prev 786 787 788 789 790 791 792 793 794 795 796 797 798 799 800 801 Next
Comments 39651 to 39700:
-
jja at 06:51 AM on 6 January 2014Hockey sticks to huge methane burps: Five papers that shaped climate science in 2013
industrialization ended the little ice age
the next one would probably be a recent analysis by JPL regarding the little ice age:
skeptics are forever saying that the recent warming is caused by "coming out of the little ice age" without causation. If industrialization is the cause of "coming out of the little ice age" and industrialization is the primary force that increases atmospheric CO2 then, in this case, I am in full agreement with those "skeptics". -
william5331 at 05:32 AM on 6 January 20142014 SkS Weekly News Roundup #1
The demise of corals would be a double whammy. As sea level rises, the vertical restraint on coral growth is removed and Corals, which are a tad over 60% Carbon dioxide by weight, should be doing their part in sequestering CO2. Kill the corals (and the oysters and the pteropods and the foram's etc) and this sink ends. Note that corals kept up with the 6mm/year rise in sea level since the end of the last glacial and filled in 120m.
The cloud thing is interesting. If we kill the oceans will there be more methyl sulphide or less emitted into the atmosphere. (have I got the chemical right). This is an emission from algae and is supposed to help seed clouds. I suppose if the oceans are completely dead, there will be no more algae but in between, the oceans could be a slimy soup of algae with more of the chemical emitted???
mtkass.blogspot.co.nz/2012/02/carbon-sinks.html
-
John Hartz at 02:01 AM on 6 January 20142014 SkS Weekly News Roundup #1
@ Matthew L: Your post was deleted in its entirety becuase it constituted inflamatory sloganeering which is prohibited by the SkS Comments Plolicy. Please read the Comments Policy and adhere to it.
-
OPatrick at 21:40 PM on 5 January 2014Hockey sticks to huge methane burps: Five papers that shaped climate science in 2013
Tom, I agree - and, as you've said, similar can be said for the Sherwood paper and indeed probably for any of the papers listed above. Any single paper is only ever likely to be an incremental improvement in our understanding.
-
barry1487 at 14:33 PM on 5 January 20142014 SkS Weekly News Roundup #1
Took Abbott only a few days in government to axe the Climate Change Commission.
Dark days indeed.
-
newairly at 13:41 PM on 5 January 2014Methane emissions from oil & gas development
What is the level of fugitive emissions at which natural gas has the same global warming effect as coal when used for electricity production?
The comparison should use modern, efficient coal fired plants and the most efficient natural gas plants to give the best case scenario for "base load" electricity. Many comparisons I have seen use the 100 year GWP for methane, but this is not realistic. We should worry about a much shorter timeframe and the use of the 20 year GWP of 84, or even the 10 year which I think would be way over 100.
It would appear that if the warming over shorter time frames is used that fugitive rates as low as 1% would totally negate any benefit compared with coal. What happens in the next decade is crucial.
-
Tom Curtis at 12:39 PM on 5 January 20142013 SkS Weekly News Roundup #52
Doug @15, I cannot show you that you are wrong. Nor can I show you that you are right. The BAU trajectory depends on too many imponderables, such as the relative rate of improvement in the technology of fossil fuel extraction vs the rate of improvement of power output from renewable sources. Our civilization can probably struggle along long enough to exhaust all conventional sources of oil and gas. If technological development makes harnassing unconventional sources economic, then BAU will take us to a CO2 warming induced hell faster than projected by IPCC BAU models, which assume declining carbon intensity whereas a widespread conversion to non-conventional fossil fuel sources will see a significant increase in carbon intensity. Alternatively, renewable energy may become much cheaper faster than costs of extraction of non-renewable fossil fuels and of coal, in which case fossil fuel use will be driven to only a small part of the economy by economics alone. It is possible that neither will happen, in which case we are indeed heading for a peak-oil like catastrophe.
What I am confident of is that we need to load the dice in favour of renewable energy (including "renewable nuclear power", where that is defined as nuclear power in which disposed waste is rendered no more dangerous than the original ores) to have a chance of steering though to a winning solution. That is, we need a carbon price. But even an effective carbon price does not gaurantee we will avoid all of the other potential ecological catastrophes (for humans) we are facing.
-
Doug Hutcheson at 11:43 AM on 5 January 20142013 SkS Weekly News Roundup #52
Tom Curtis @ 14, you correctly state "continuing growth - bar an apocalypse - is locked in". I have to admit, I am expecting some kind of 'apocalypse' to reduce our population, whether it be resource wars, drug-resistant epidemics, or starvation triggered by economic collapse (perhaps due to the loss of economic growth following that other elephant in the room, peak oil).
What I do not expect is BAU to continue long enough for humaity to have time to burn all available fossil carbon: if I am wrong about that, we are doomed to even worse causes of negative population growth.
Sadly, I have no science to link to in support of my pessimism, just my reading of human nature and (dim?) awareness of some of our looming problems. Please show me I am wrong!
-
Doug Hutcheson at 11:25 AM on 5 January 20142014 SkS Weekly News Roundup #1
I have to admit, my anger at Abbott's climate science denialism has caused me to make somewhat intemperate comments, both here and at The Conversation. As I am not a scientist, speaking in anger does not reflect badly on my dispassionate professionalism, but it still disappoints me that I can be so provoked. This inexplicable blindness by Tony Abbott single-handedly caused my traditional Conservative vote to go to the Left in the recent Australian election and I see no prospect of it going back to the Right any time soon.
I am also encountering a surprising number of people who share my concerns: surprising, in that I live in an overwhelmingly Right wing electorate, where the National member enjoys a massive share of the vote.
Is it too much to hope that light is dawning in this benighted political landscape? Time will tell, but time is against us.
-
Tom Curtis at 11:10 AM on 5 January 20142013 SkS Weekly News Roundup #52
Oneplanetforever @9, the per capita Australian dietary intake is 13,350 kilojoules per day, which I am informed represents 4.28 times the global per capita sustainable food intake. Presumably, therefore, we must reduce our food intake to 23.4% of its current value, or 3,120 kilojoules per day. As it happens, that is 46.9% of the per capita daily dietary intake of Eritrea, the nation with the lowest per capita food intake in the world (first link). It is also only 35.9% of the recommended daily dietary intake. Put another way, if we are to live "sustainably" with regard to food intake, we must either all live in a permanent state of malnutrition, or we must reduce the Earth's population to less than 2.5 billion people. The later, unfortunately, is not an option in the near term in that population growth is governed by generational factors, so that continuing growth - bar an apocalypse - is locked in over the next twenty odd years at least.
I take dietary food requirements as it is fundamental, and stark. It places our dilemma up front. The dilemma is this:
1) We can accept the ecological constraints as an upper bound on our capability and aspiration that can never be exceeded; or
2) We can recognize the ecological constraints but find technological means to break through them.
The later means finding new means of food production that exceed the energy constraints of the biosphere without imparing the biosphere. One potential such method (already tried by the Russians) is growing food underground using energy from artificial sources. Another would be the staple of sci-fi, yeast (or algae) vats, again with energy from artificial sources. A third is increasing biological productivity be fertilizers. A fourth might be the direct production of the chemicals of food on an industrial basis. These all require the use of artifical energy. That may include solar energy from solar plants, as plants are very inefficient at producing food energy from solar energy. Alternatively, it may mean nuclear power. Because all these means require the large scale production of energy, all make more accute the issue of finding sustainable energy sources.
However, the former means permanently locking humans in an economic state no more advanced than feudalism. It requires switching to wide scale farming for a small population using limited energy sources. That will tie a far greater proportion of the Earth's population directly into food production, and make inefficient wide spread trade. High technological science (particularly in electronics and medicine) cannot survive in that sort of context. Nor can the existence of a substantial scientific class. That rout means, in fact, the end of the great experiment that began with the enlightenment.
Faced with that dilemma I do not hesitate to choose the second option. In one respect it is more risky, but from another perspecitive, the first option avoids risk by accepting complete defeat as a solution. By giving up our aspiration to be more than another disease ridden animal subject to the whims of nature and distinguished from other animals primarilly only by the fact that we are smart enough to bind ourselves in superstition; we have given up that which makes us human, and that which makes being human something special.
Granted, if we take the second option, we may fail. Our economy may become sustainable again by force majeure of nature, dropping us through catastrophe back to the situation to which you aspire, or even to extinction. But that failure matters not one wit to the planet, which will still have life, and still rebuild within a few millions of years (a trivial time period geologically) ecosystems as complex as any that exist now. It only matters to us now. So our choice is simple. Do we strive to be more - or settle for failure for fear that our striving will not succeed.
You have chosen failure. It is a choice I cannot accept.
-
Tom Curtis at 10:25 AM on 5 January 20142013 SkS Weekly News Roundup #52
davidnewell @10, without going into detail, sea water already has a large DIC content so that spraying it in the open is likely to absorb little, if any, extra CO2. Further, any water that evaporates in droplet form will tend to release its CO2 so that the volume of water transported and evaporated does not contribute to carbon sequestration. What would contribute to carbon sequestration using play soils is the difference in DIC content between sea water and that formed in the ponds resulting from spraying. As far as I can tell, given that the water is sprayed onto carbonate, the DIC will increase, potentially releasing CO2 by reducing the pH in of the soils. Chemistry is not my strong suite, so I can be persuaded otherwise - especially by a chemist who specializes in this area (such as David Archer) indicating my error.
My essential point, however, is that the factors you cite (total CO2 content of airflow through spayed area) as indicating the carbon sequestration potential of your scheme are in fact irrelevant to that potential. Further, your stated secondary benefits are at the expense of greatly reduced effectiveness in your scheme. If I am wrong about the chemistry, your scheme may work as a method of carbon sequestration, but you have not shown that it will, nor given any reasonable means of calculating its potential benefit.
-
gws at 10:14 AM on 5 January 2014Methane emissions from oil & gas development
Stephen @16: Basically, yes.
However, consider that the EPA uses only data it considers very well established, and goes at times to extremes to make sure measurements and resulting data it uses are essentially unassailable (since the EPA has to defend itself in court a lot ...). Thus the outdated use of the methane GWP. Now that a new IPCC report is out, EPA will consider redoing calcs using the new GWP, but possibly not until a few more papers come out addressing that topic. I will not make a prediction.
-
Tom Curtis at 09:58 AM on 5 January 2014Hockey sticks to huge methane burps: Five papers that shaped climate science in 2013
OPatrick @11, creating a buzz in the denialosphere is not the same as having a significant scientific impact. As to the later, Nic Lewis's paper is just one recent paper on climate sensitivity, many of which show much larger values:

There is no particular reason to think his method is more reliable than others, and indeed, some reason to think its results vary widely depending on choice of time frame, making it a fairly unreliable method.
-
OPatrick at 08:52 AM on 5 January 2014Hockey sticks to huge methane burps: Five papers that shaped climate science in 2013
Maybe I've spent too much time in the wrong places to judge the real nature of the climate science discourse (it certainly feels that way) but I'd have said Nic Lewis' climate sensitivity paper probably had a disproportionately large impact. Did this paper get on to the short list Roz?
-
michael sweet at 07:44 AM on 5 January 2014Medieval Warm Period was warmer
Aristotelian,
This Wikipedia article describes the break up of the Ward Ice shelf on North Elesmere Island in the Canadian Arctic from 2002-2010. It was a remnant of the Ellesmere Island Ice Shelf which was 3,000 years old when discovered in 1875 (dated using drift wood on the inner surface of the shelf). Virtually all of the Arctic ice shelves have melted since their discovery, this is only the first hit of a Google search. The shelf survived the MWP and has melted with modern AGW. Since the ice shelf was 3,000 years old, how could the MWP have been warmer, even in the Canadian Arctic where it was presumably the warmest?
Please provide a link for your supposed Ice shelf melting during the MWP. Perhaps your sources of information are feeding you fabricated data. That is why they are called deniers.
-
scaddenp at 06:36 AM on 5 January 2014Medieval Warm Period was warmer
MWP has warming occuring in different places at different times and not at all in some places. Warming now is occuring at different rates in different places, but the whole planet is warming. eg see here spatial distribution for warming since 1980. Compare that with spatial distribution during the MWP shown in the intermediate version of this article.
-
Rob Honeycutt at 06:32 AM on 5 January 2014Medieval Warm Period was warmer
And to answer your question, modern warming is homogeneous, whereas the MWP was heterogeneous. Peaks of MWP warming occur during a span of about 600-800 years. Some places it was as early as 1400 years ago, some places as recent as 600 years ago.
If you go back to the CO2 Science site and look closely at all the graphs they present, you can clearly see this.
-
Rob Honeycutt at 06:27 AM on 5 January 2014Medieval Warm Period was warmer
aristotelian... RE: "artice shelf melting"
It would be helpful if you could provide links to what you're referring to.
-
Rob Honeycutt at 06:25 AM on 5 January 2014Medieval Warm Period was warmer
Aristotelian... This is definitely not a 1000 year representation, but it gives you a better idea of the changes in spacial distribution of temperature on the planet for the past 150 years.
-
Philippe Chantreau at 05:55 AM on 5 January 2014Medieval Warm Period was warmer
Aristotelian, SkS is not some random website and if you believe so, you have not paid any attention. It won the Eureka Prize of the Australian Musem for advancement of climate knowledge. That's not a popular online vote in which everybody who has no clue can click and bots can click automatically. Every SkS article is backed up by peer-reviewed science papers, readers are encouraged to explore them, so the kind of dissimulation that happens at Idso's site can't happen. Several of the SkS moderators have had publications in high impact science journals in the past 3 years. In comparison, it took years for Watts to publish one paper, and when he did, it failed to confirm the very premise to the existence of his website. It also brought nothing new to previous publications by others that had already done that.
So really ,the choice is between a website with established expertise demonstrated by winning awards from scientific organizations and a record of publications in the field, against some random interview in the NYT. That is a much better representation of reality in this case.
-
aristotelian at 05:49 AM on 5 January 2014Medieval Warm Period was warmer
Is the current Global Warming trend hetetrogeneious? If the artice shelf melting was not a indicator of global warming 1000 yeears ago, why is it considered an indicator, today?
-
william5331 at 05:36 AM on 5 January 2014Hockey sticks to huge methane burps: Five papers that shaped climate science in 2013
There is a mechanism that could result in a sudden methane burp. As a thougt experiment, take a diving bottle and fill it half full of clathrate that you have dredged from the ocean. Put a bung in the opening. Deck temperature is, say 50C. The clathrate begins to give up its methane and the pressure rises in the bottle. When the pressure gets to a certain point (equivalent to a depth of about 700m) the clatrate stops giving out its methane. If clatrate below the bottom of the ocean is being stabilized by, for instance, the strength of an overlying layer of permafrost rather than by the depth at which it occurs. anything that breaches this cap (mehanaclude - like an aquaclude) could result in a sudden release of methane that is already in the gasseous form and from remaining clathrate that is now exposed to warm water but now without sufficient pressure to keep it stable. An earthquake could do it or a land slide on the contenental slope north of Russia as the permafrost slowly weakens to the point where such a land slide can occur.
http://mtkass.blogspot.co.nz/2013/08/a-methane-spike.html
-
Gestur at 02:08 AM on 5 January 2014Hockey sticks to huge methane burps: Five papers that shaped climate science in 2013
We all have our own personal vectors of importance weights when it comes to climate research. These days mine tend to place much weight on research that sheds a clearer light on why we shouldn’t be considering solar radiation management geo-engineering, what I’ve called ‘the mother of all moral hazards’. And so the two papers that I would rate as highly policy relevant this past year are the theoretical paper by A. Kleidon and M. Renner of the Max Planck Institute published in Earth Systems Dynamics (“A simple explanation for the sensitivity of the hydrologic cycle to surface temperature and solar radiation and its implications for global climate change”) and then the multiple Earth System climate-model verification of this effect by S. Tilmes et al. in the Journal of Geophysical Research: Atmospheres (“The hydrological impact of geoengineering in the Geoengineering Model Intercomparison Project”). Together, they make a compelling case that if you tried to nullify global temperature increases with solar radiation management techniques, the expected consequences would be reduced global evaporation leading to lower rainfall and significant changes in its distribution.
-
RozPidcock at 00:35 AM on 5 January 2014Hockey sticks to huge methane burps: Five papers that shaped climate science in 2013
Interesting discussion, thanks. I'd say my idea was to summarise papers that made it into the media's collective consciousness this year rather than perhaps the most worthy contributions to climate science - although some tick both boxes. I suppose a better title might have been "5 papers that shaped climate science discourse'.
Kosaka & Xie nearly made the cut (and I do link to it in the final section) since the pre-WG1 timing made it quite a media conversation piece. But I felt Balmaseda et al. first described the Pacific warming/cooling mechanism (incidentally, the authors of that paper had some interesting comments about Kosaka & Xie on that front http://bit.ly/1g7Ocm6)
And yes, sadly the new Sherwood paper about climate sensitivity came just after I'd written this piece. Though it perhaps would have slotted in as a continuation of the media interest in climate sensitivity this year rather than forming a category on its own. Glad to hear all your thoughts, keep them coming ...
-
StBarnabas at 23:28 PM on 4 January 2014Hockey sticks to huge methane burps: Five papers that shaped climate science in 2013
Kevin
Cowtan and Way is a very nice paper. I do wish I had written it; but it is not fair to say "anyone could have done it" a good grounding in physical sciences is needed. I know in much of my professional life everyone has a PhD in Physics - but this is not generally true. When I discuss climate change with my brother in law (who is a skeptic) we have no common ground. Much of the population has very little grounding in Physical Sciences. Well done again
sean
-
Andy Skuce at 18:25 PM on 4 January 2014Methane emissions from oil & gas development
Miguelito @6
Michael Levi has also written about the Uintah study. According to him, there is a fairly recent bottom-up study that showed that there are high leakage rates, around 5%, in that area due mainly to gas gathering and processing activities. Had the authors of the top-down study used a 2-sigma confidence interval, their results would have overlapped with the bottom-up results.
-
Andy Skuce at 17:43 PM on 4 January 2014Methane emissions from oil & gas development
Synapsaid:
You may be interested in this excellent long read on an amateur scientist looking for gas leaks in the US NE.
There is some information on the problem with corroding cast-iron distribution pipes here. Astonishingly, some of these pipes, still in use, were installed as early as the 1830s, decades before the Civil War.
-
Rob Honeycutt at 15:20 PM on 4 January 2014Medieval Warm Period was warmer
aristotelian... Whenever you hear someone say (or see it stated somewhere) that the MWP was global, ask one simple question: "Was the MWP heterogeneous?"
That's all you have to say.
-
Rob Honeycutt at 15:16 PM on 4 January 2014Medieval Warm Period was warmer
aristotelian... Three of the four references you provided are well known AGW denial sites. I've spent a large amount of time going through the MWP material shown on CO2 Science, in particular. Many of their written synoses of the research actually contradict the actual research they present. And they, curiously, do not (though they are clearly capable) endeavor to sythesize the data into any kind of multiproxy reconstruction.
The other thing you'll notice at CO2 Science is that, what they call the MWP does not occur at the same time in all the datasets. And this is clearly pointed out in most of the research, but CO2 Science goes to great lengths to hide this fact.
When you read the actual research papers what you find is that the MWP was "heterogeneous." That is, it's not homogenous. It occurs at different times, at different places. And it doesn't occur at all in still other places.
When people go to such lengths, as CO2 Science does, to hide this elemental fact, then yes, I call those denial websites.
-
michael sweet at 13:35 PM on 4 January 2014Medieval Warm Period was warmer
Aristolean,
This Skeptical Science article describes an article written by 78 climate researchers who combined data from around the world to make a graph of the temperature for the last 2000 years. The MWP does not show up in analysis that combine all the world data. The MWP was evident in some areas, but other areas were colder at the same time so the global temperature was not warmer. By contrast, in the current warming everywhere is warmer. It is possible to find warm areas somewhere in the World at almost any time in the past you choose, they are just balanced by other cold areas. Do you believe a careful analysis by 78 scientists or a blog post on WUWT? (note this confirms Mann's Hockey stick data, again)
In general, WUWT leaves out most of the data. You can make anything appear to be true if you leave out enough data. The IPCC report does not leave out any data and they find no MWP.
-
aristotelian at 12:47 PM on 4 January 2014Medieval Warm Period was warmer
Thanks, Tom. That makes more senese.
-
Tom Dayton at 12:38 PM on 4 January 2014Medieval Warm Period was warmer
aristotelian, you misinterpreted Rob's reply. When he wrote "where no MWP shows up at all" he did not mean absence of evidence of the temperature. He meant there is solid evidence of the temperature, and that temperature was not anomalously warm. That is existence of evidence, not absence of evidence. Click the Intermediate tab at the top of the original post on this page, to see more evidence.
-
aristotelian at 12:25 PM on 4 January 2014Medieval Warm Period was warmer
Also, one of these links is a video of a NYT reporter interview scientists. As a layman, who am I more likely to believe, some random website I found the immiediatly lables someone "a denier" which is a clear reference to the holocost deniers so is a gross ad hominin attack or some scientists interviewed by the NYT?
Moderator Response:[TD] Nearly every claim on Skeptical Science is backed up with references to, and often links to, scientifically peer reviewed publications. Those are even more reliable than interviews with scientists, because some scientists make claims in interviews, editorial writings, and web sites that they are unable to make in peer reviewed publications, due to the strict quality controls over peer reviewed publications.
-
aristotelian at 12:23 PM on 4 January 2014Medieval Warm Period was warmer
re: "aristotelian... Making the rounds at all the climate denial sites, I see.
What WUWT, CO2Science and Science&PublicPolicy are not going to tell you is that there are many places where no MWP shows up at all. Such as, the Tibetan Plateau."
Where talking about 1000 and 2000 (Roman Warm Period) years ago. I don't see how the absence of evidence is evidence of absence in this case.
-
Rob Honeycutt at 12:17 PM on 4 January 2014Medieval Warm Period was warmer
aristotelian... Making the rounds at all the climate denial sites, I see.
What WUWT, CO2Science and Science&PublicPolicy are not going to tell you is that there are many places where no MWP shows up at all. Such as, the Tibetan Plateau.
-
aristotelian at 12:03 PM on 4 January 2014Medieval Warm Period was warmer
What about these studies using senentments ect indicating the MWP was global?
http://wattsupwiththat.com/2013/10/31/new-paper-shows-medieval-warm-period-was-global-in-scope/ Shows a NYT reporter intervieweing 2 scientist who measured sentiment samples around Indonesia. Look at 11:15
http://www.sciencemag.org/content/342/6158/617
MWP in China http://www.co2science.org/subject/m/summaries/mwpchina.php
http://scienceandpublicpolicy.org/images/stories/papers/originals/mwp_asian_countries.pdf
-
Doug Hutcheson at 10:31 AM on 4 January 20142013 SkS Weekly News Roundup #52
One Planet Only Forever @ 11, you said:
"the best solution would be for humans to strive to minimize the impacts of their lifestyles"
The problem is our species' dependence upon energies greater than can be generated by muscle power, wind, sunlight and burning renewable organics. The only solution to that is for us all - globally - to reduce our expectations/desires/demands of life and that is what is impossible, for all practical purposes. We have had it too easy for too long and our profligacy is now coming home to roost.
-
Kevin C at 08:43 AM on 4 January 2014Hockey sticks to huge methane burps: Five papers that shaped climate science in 2013
Well, Cowtan and Way will also be listed as 2014 when it hits the print edition.
While the attention is very flattering, in scientific terms our paper is really only addressing a technical data analysis issue. If climate change skeptics had not managed to inflate the short term trend into the "most pressing" issue in climate science (according to BBC Newsnight) then it would not have attracted much interest. That's not to say that it didn't need doing, but as the Stoat said, "anyone could have done it".
In my view the real scientific breakthrough missing from this list is Kosaka and Xie.
-
michael sweet at 08:31 AM on 4 January 2014Hockey sticks to huge methane burps: Five papers that shaped climate science in 2013
Chriskoz,
While the paper you linked is very interesting, the original article in Nature is dated January 2. If the results hold up it might be one of the five top articles for 2014.
-
Synapsid at 08:12 AM on 4 January 2014Methane emissions from oil & gas development
Dallas showed high CH4 emissions. How much is known about emissions from natural-gas transmission and distribution networks in and between US cities and towns, and from such networks in industrial areas outside them--well, from transmission and distribution networks in the US? I've often wondered how these emissions compare to those associated with the fossil-fuel industries.
There are lots of old and poorly maintained gas lines; the San Bruno explosion south of San Francisco some years back underlined that.
-
Stephen Ferguson at 08:09 AM on 4 January 2014Methane emissions from oil & gas development
@gws, Do you concur with Joe Romm that the EPA are significantly understimating the global-warming potential of methane compared to the latest IPCC figure of 34 over a 100-year time scale?
"Amazingly, the EPA has been using a GWP of 21 for its estimate of how methane compares to carbon dioxide — a figure that is nearly twenty years out of date. That means methane is a whopping 60% stronger than EPA calculates in its GHG inventory. Back in April, EPA finally said it was thinking about raising the GWP — to 25!"Ref. http://thinkprogress.org/climate/2013/10/02/2708911/fracking-ipcc-methane/
-
chriskoz at 07:24 AM on 4 January 2014Hockey sticks to huge methane burps: Five papers that shaped climate science in 2013
The author has missed the latesat paper by Steven Sherwood from NSW uni, quantifying the cloud formation changes from H2O forcing:
Planet likely to warm by 4C by 2100, scientists warn
Several SkS commenters quoted that paper lately.
That late 2013 paper, has not "shaped climate science" yet, but it certainly will. It should put to bed the Lindzen's "negative cloud feadback". Then, I predict, it will cause IPCC to revise upwards their ECS.
-
rocketman at 06:55 AM on 4 January 2014Hockey sticks to huge methane burps: Five papers that shaped climate science in 2013
"Skeptics" don't cite a lot of papers.
As for these being the top 5, I would say that 1, 2 and 5 are well chosen. 3 and 4 were more media sensations than major contributions to climatology.
-
PluviAL at 06:39 AM on 4 January 2014Methane emissions from oil & gas development
Wili, I concur. My work is application oriented. I count on detail-oriented folks to keep the data and conclusion good, but the real world measurements seem more reliable to me than the menutia of inventory procedures. They have already been proven to be wrong, and it seems, manipulated by the industry. Real measurements by sampling seem much more reliable, but discounted in the article. In my book, I simply report EPA has been underestimating CH4 emissions measurements. Excellent work, though, Thanks.
-
scaddenp at 06:16 AM on 4 January 2014Hockey sticks to huge methane burps: Five papers that shaped climate science in 2013
Really? And which peer-reviewed papers would these be that tell an entirely different story?
-
gws at 05:01 AM on 4 January 2014Methane emissions from oil & gas development
deweaver, the atmosphere is not interested in which sources emit the methane, and the NOAA studies are not designed to study just oil&gas exploration emissions. However, they are still useful, and trustworthy, despite their integration over several possible sources, because the major non-oil&gas exploration sources (such as landfills and cow population) can be assessed independently, and then subtracted from the total. In addition, several tracers are used to distinguish between sources, such as co-emitted ethane and 13C-CH4.
Natural seepage cannot be easily distinguished from explorative sources, but while possibly large locally, the continental or global source is uncertain at best. There is, at this point, mostly speculation of how much it might contribute realtive to natural gas production. Dedicated measurements and careful extrapolation are needed.
Ruminants are a large anthropogenic source, approx. three to four times larger (75-95 Tg/yr) than the extrapolated termite source (20-30 Tg/yr), which has been investigated several decades ago. Your last statement is an interesting speculation, inferring that termite numbers would increase dramatically if you removed cattle production from a tropical area. Have any evidence for that?
-
OPatrick at 04:45 AM on 4 January 2014Hockey sticks to huge methane burps: Five papers that shaped climate science in 2013
Whilst these were all significant and interesting papers it seems a stretch to say that they were the five papers that 'shaped climate science' last year. I can imagine certain 'sceptics' selecting their own set of five papers to tell an entirely different story.
-
Tom Curtis at 04:43 AM on 4 January 2014It's waste heat
Old Sage @153:
1) "...the earth is a spheroid which will see its surface temperature vary by 1 deg K (around 300 say) for every 1.35% change in solar energy..."
A 1.35% alteration in the solar constant represents a 3.23 W/m^2 change in TOA forcing. That means OS is assuming a no net feedback climate sensitivity, ie, a climate sensitivity equivalent to 1.15 C per doubling of CO2. That figure disagrees with nearly all studies of the subject, and is almost certainly inconsistent with the past history of the Earth's temperature variation, as is shown by the IPCC AR5:
2) "...the difference between a cloud base at the bottom of the troposphere and top, ten miles, corresponds to a 0.5% change in the effective radiating surface area..."
The actual difference in area between sea level, and 10 km above sea level is 0.31%. That is not a 0.5% change in the effective radiative surface as the effective altitude of radiation to space is already approximately 5 km of altitude, meaning shifting the effective radiation to space to 10 km would only increase the effective radiation surface by 0.16%.
3) "It means that should the temperature rise by 1/3rd degree, it could be eliminated by increased radiation from elevated cloud cover."
This assumes 100% cloud cover. It also assumes the increased effective area of the clouds will have no effect on albedo. These, however, are trivial flaws by OS's standards. The beggest flaw is that he ignores the fact that the atmosphere cools with increased altitude. As IR radiation to space is proportional to the fourth power of temperature, that means increasing the altitude of effective radiation to space reduces the radiation to space (which is the essence of the greenhouse effect). Assuming a reduction in temperature of 6.5 K per kilometer of altitude, and an average surface temperature of 288 K, and allowing for the change in surface area, increasing the effective altitude of radiation to space from 0 to 10 km would reduce radiation to space by 64%. The reduction from increasing the current effective altitude of radiation to space to 10 km is reduces the radiation to space by 32%. This would require a substantial increase in the Earth's surface temperature to compensate (significantly greater than 10 C). (It should be noted that these figures are calculated using OS's black body assumption of all radiation coming from just one level, which is false. Using a realistic model the reduction in IR radiation, and hence the compensating temperaure increase prior to feedbacks would be less.)
4) "... it is a scientific fact that the major energy transfer agent from the surface is kinetic by gases."
In fact, within the troposphere the dominant form of energy transfer between atmospheric layers is by convection (ie, kinetic by gases). Contrary to KR, Trenberth adresses the different issue of transfer of heat between the Earth's surface (ie, dirt and rock, or water) and the atmosphere. So OS is correct on this one, but while correct he is irrelevant. The only form of energy transfer from the surface or atmosphere to space is by IR radiation (ignoring a very small amount of energy carried of by hydrogen and helium escaping to space). The kinetic transfer of energy in the atmosphere establishes a very clear gradient in temperature, which limits the IR radiation to space as the effective level of radiation to space is forced higher in the atmosphere by greenhouse gases.
5) "The physical mechanism for raising the emitting surface is that as water is the pervasive surface on earth ..."
As a side note, we see here that OS assumes the WV feedback rases the effective level of radiation to space, with together with the declining temperature with altitude makes it a strongly positive feedback. He is, of course, unaware of the implications because his grasp of the physics is so poor.
More importantly, water vapour is IR active. That is, it absorbs IR radiation in part of the spectrum in proportion to its emissivity, and emits in the same part of the spectrum in proportion to its emissivity, and as a function that increases with increasing temperature. Thus implicit in OS's argument is the fact that increasing the concentration of any IR actively gas (eg, CO2) in the atmosphere will increase temperature.
6) "As CO2 is 2.5 times heavier than H2O, I doubt that there is a significant CO2 effect trapping heat above the topmost cloud cover."
OS "doubts", but in the mean time observations* show the following:
Note that while water vapour declines in concentration rapidly, being almost completely absent above 10 km in the atmosphere, CO2 remains near constant in the atmosphere up to 80 km in altitude. The decline in water vapour concentration is because it precipitates out of the increasingly cold atmosphere. Even in the tropics, atmospheric temperatures fall below freezing around 5 km of altitude, so that apart from in thunderstorms, water vapour is largely absent above that altitude.
Even better, we can see which has the most effect on IR radiation to space, as it has been observed from space:
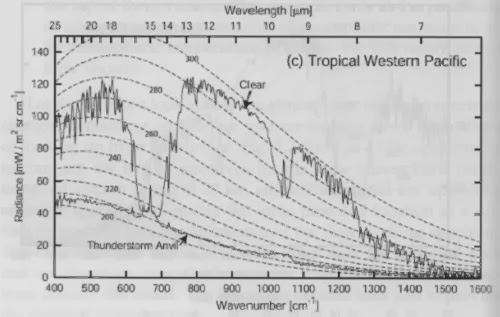
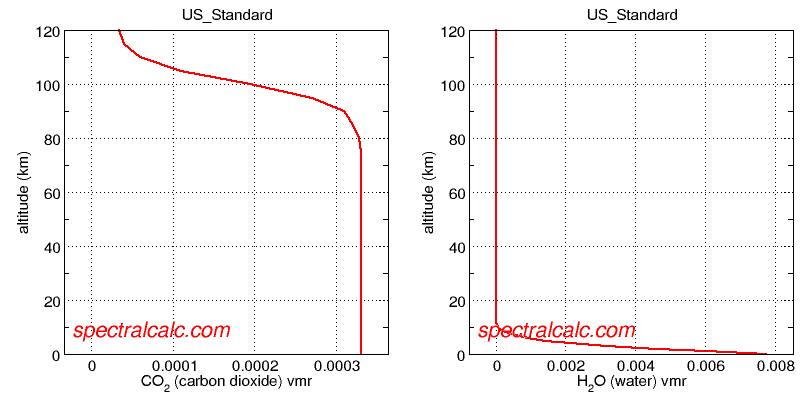
The black body curves show the average temperature of gas radiating at that level. As can be seen in the clear sky example, water vapour (to the left of the large notch at 650 cm^-1) has a brightness temperature in this example, of about 260-270 K, indicating its effective altitude of radiation is 4.6 km. The large notch, however, is due to CO2. Its brightness temperature is around 225 K, indicating an effective altitude of radiation of 11 km. The spike in the center of the trough is because where CO2 most effectively absorbs, its effective altitude of radiation is in the lower stratosphere, which is warmer than the upper troposphere.
Of course, you cannot fail to have noted the spectrum for the thunderstorm anvil, with a brightness temperature of 210 K, and hence an approximate altitude of 13 km. High altitude clouds are amazingly effective greenhouse agents, but only high altitude clouds can get above the warming effect of CO2; and they occupy only a small proportion of the Earth's surface.
These two observed spectrums (and countless others like them) show clearly, and by observational data, that OS's doubts exist only from failure to look at the evidence.
(*The graphs are for the US Standard Atmosphere which is a standard specification of average US atmospheric conditions, primarilly used in aviation. It is based on very detailed observations, but only approximates to those observations.)
7) "The upshot is that waste heat involves ..."
OS continues his evidence free ramblings. The facts are that waste heat is dissipated very rapidly to the rest of the Earth's surface by winds. For small wheather effects, that dissipation may not be fast enough so that it has some effect. For climate, however, the dissipation is sufficiently rapid that the feedbacks for waste heat occure at the same pace and geographic scale as the feedbacks from increased CO2 concentration. Therefore there effective impact on the Earth's climate is given to a first approximation by the scale of their globally averaged output. That is, waste heat has one hundredth of the impact of increased CO2.
In summary, OS demonstrates yet again that he has no clue about the basic physics involved in climate change, and a very poor, and in most areas, non-existent grasp of the relevant observational evidence. He never-the-less is "sage" enough to think he knows better than scientists who spend their life studying the subject, and have gone over the observations and basic physical principles with a fine tooth comb. His "sagacity" is, therefore, the sagacity of the witch-doctor rather than the scientist.
-
deweaver at 04:18 AM on 4 January 2014Methane emissions from oil & gas development
Living in an oil/gas area of the country and spending an early part of my life dealing with natural seepage problems, the topdown NASA approach may be very misleading. We have houses and buildings in the local area where the natural emissions are so high that we intalled permanent tiki torches, membranes and collection systems (some passive and some with active pumping) to prevent explosive levels in the buildings. These tiki torches are still burning after 40 years.
A few of the larger natural sources are now going into generators for small scale power generation.
In the LA basin, there is a strong relationship between locations of natural gas seeps and locations that became large oil producing areas, but the natural seeps existed before the oil/gas wells. Some of the largest natural seeps are within 1 km of active wells and the existance of natural seeps of both oil and gas were used to locate good drilling sites, both on shore and offshore, before 4-D seismic studies.
How can natural seeps and oil filed induced leaks be separated in a low resolution study? Why should we give credability to the low resolution NASA type study? If they had no data before the oil field development, they have no real information beyond political PR.
Articles that discusses methane discusse cattle and ruminants but never seems to mention termites, which utilize the same microbiology as rumiminates with methanogenic bacteria to eliminate excess hydrogen from fermentation of carbohydrates. In tropical areas full of termites, the cellose that would not be eaten were the numbers of cows to be reduced would be consumed by the termites, so the net production of methane would not be diminished by diminishing cattle production.
Moderator Response:[JH] Unnecessay white space eliminated.
-
gws at 02:35 AM on 4 January 2014Methane emissions from oil & gas development
Miguelito, continued hammering on the Petron et al. pilot study looks like a strawman at this point. As this post is trying to highlight, science has progressed much beyond that study. The Levi papers were included in our earlier post. His points are well taken, but I linked to the more detailed ClimateCentral study in this post.
Prev 786 787 788 789 790 791 792 793 794 795 796 797 798 799 800 801 Next


