


 Arguments


Recent Comments
Prev 804 805 806 807 808 809 810 811 812 813 814 815 816 817 818 819 Next
Comments 40551 to 40600:
-
vrooomie at 14:00 PM on 20 November 2013Global warming since 1997 more than twice as fast as previously estimated, new study shows
Sorry, Poster, but using Curry as an exhibit to cast doubts on Cowtan and Way is still using the scientific illiterati. She has no cogent response to their work, has used nothing that can even come close to being called a rigorous look at their paper, and is just doing her usual heming and hawing, and using the old tactic she's perfected, of parroting something about "uncertainty." Will Cowtan and Way stand the test of time? I don't know, for I am not an expert, but, having read in excess of 1200 various articles, essays, and papers concerning this subject, one thing I can say, with good reliability, is Curry hasn't done anything except her usual non-rigorous trashing of a paper I sincerely doubt she understands.
-
Riduna at 10:41 AM on 20 November 2013Global Warming Paws Fails to Materialise: Earth Still Warming and Global Sea Level Rising Like Gangbusters
Just as well the oceans are such a large heat sink ... but isn't there a price to pay for all that energy being absorbed into deeper and cooler parts of the ocean, particularly in polar regions?
-
Tom Curtis at 09:47 AM on 20 November 2013Antarctica is gaining ice
Morgan Wright @204 (cont), I have been a bit confused about my account of the effect, specifically with regard to the location and altitude of the relevant winds. In particular, I thought the relevant winds were those bringing warmth into the upper troposphere of Antarctica, whereas they are those related to bringing warmth to the Antarctic Ocean. To avoid furhter confusion, I think it best that I lay out the observations directly.
First, the winds involved are those bringing warmth along the surface from about 30o to about 60o South:

These result in westerly winds (clockwise around the pole as viewed from below) just above the edge of Antarctica in the region where the seasonal sea ice forms, ie, the west wind drift:

These have been strenthening, and it is their increased speed that is one of the postulated causes of increased Antarctic sea ice.
Gillet and Thompson (2003) show a comparison between the observed increase in westerly strength and that prediced from a model driven only be reductions in ozone set to match observed reductions:

Gillet and Thompson indicate the strongest effect occurs in the spring in the stratosphere, but then propogates downward to summer (summer and autumn according to Turner et al, 2009).
How could ozone drive this pattern?
The west wind drift is formed by air coming south and then rising as it encounters colder air from Antarctica. For it to rise, air above it must disperse, ie, move either north or south. If it does not disperse, the rising air will cause a build up in pressure that will stop further rises in air. The air moving south in turn must fall at or near the south pole in order to make room for more air. That, however, creates a problem. The air moving south is typically of a similar temperature to the surface in Antarctica, or warmer. If it falls, it will be warmed by increase pressure, making it warmer than the surface air. As a result it will not fall any further. Unless upper troposphere are over Antarctica falls to temperatures approximately 6.5o C per km of altitude above the surface, it cannot fall, with the consequence that pressure will build up at altitude stopping further circulation. Therefore the air coming south must be cooled, primarilly by radiation to space. The radiation to space is made less efficient by the existence of a warm stratosphere above the air, generating IR radiation from above, and limiting the net cooling of the upper troposphere. At this stage, reduced ozone results in a cooler stratosphere and more efficient cooling of air in the upper troposphere. Reduced ozone, of course, cools the stratosphere by the simple expedient of reduced absorption of UV radiation from the sun.
It should be evident that increase CO2 should also result in more efficient cooling of the upper troposphere. When the air below this effect is overwhelmed by increased IR radiation from below. But over Antarctica, increased CO2 should also accelerate the circulation of the polar cell, and hence indirectly that of the mid-latitude cell, and with it the west wind drift. Models do in fact show this effect, but show it to be significantly weaker than the effect of reduced ozone.
-
scaddenp at 08:09 AM on 20 November 2013Broad consensus on climate change across American states
Something like the NZ Electoral Finance Act?
I think Americans strongly believe that the rights of very rich people to have undue influence on politics is a fundamental freedom, and this "freedom" trumps any other rights that might be conflicted.
In short, good luck. As an outsider looking in and having discussed this with many US citizens, it appears vested interests have very successfully pushed rhetoric about "freedom" to point where no reasonable discussion is possible. I'm glad I live here instead.
-
Tom Curtis at 07:51 AM on 20 November 2013Ljungqvist broke the hockey stick
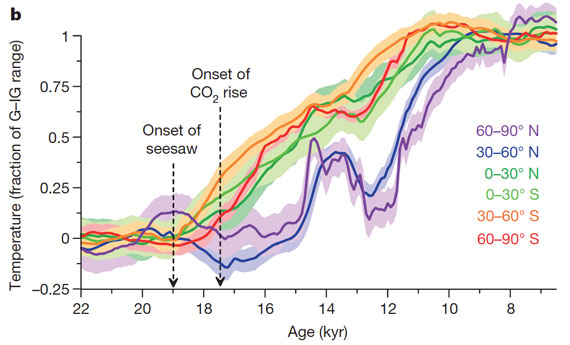
Morgan Wright @33, taking your lower graph, you show peaks that differ in timing by around 500 years in one case, and by about three thousand years in two other cases as evidence that NH and SH temperatures vary in sync. Oddly, I am not convinced. In fact, the "syncrhonization" of Arctic and Antarctic warm events is such that scientists have proposed a "bi-polar seesaw" to account for the fact that, in general, while the Arctic cools, the Antarctic warms. Equally important, the temperture differences between found at Greenland and those in Antarctica are significantly different in scale, and cannot by rendered similar by a simple linear rescaling. Your charts, therefore, merely establish that you cannot use a single local proxy as a global proxy (or a hemispheric proxy).
Single site polar proxys are only usefull as global proxies for indicating the onset or end of interglacials. Even then, they are only approximate indicators for the rest of the global, as Shakun et al have shown:
Morgan, everybody does foolish things, especially in areas where they are largely ignorant (as you evidently are in this). What distinguishes the wise the fools are that the fools persist in their mistakes in the face of contrary data. The evidence clearly shows that global and hemispheric temperature variations can differ substantially from that of local proxies, and that single local proxies are, therefore, very poor indicators of global patterns except for the very largest patterns (ie, transitions from glacial to interglacial and others of similar magnitude).
-
Lanfear at 07:23 AM on 20 November 2013Antarctica is gaining ice
Morgan Wright@206: "Now, let's iron this whole thing out. South pole, not warming"
While I realize that this is not peer reviewed, or even strictly speaking a scientific result, it might bear some counter value to the claim above:
And while MW does refer to a NASA-produced anomality-picture from 2005 (apparently), there are newer ones, which are showing that the anomality is positive.
So, old information says cooling. New information says warming.
-
william5331 at 04:25 AM on 20 November 2013Broad consensus on climate change across American states
Politicians serve the people that give them funds to run their campaigns, not the people that elect them. The only way America will get out of this paradigm is to ban all election contributions and legislate equal, tax payer funded air time for each politician to present his case. Besides air time, each politician gets a set amount of funding from the government. It sounds expensive. It is far less expensive that the present completely democracy corrupting system.
-
PhilMorris at 03:28 AM on 20 November 2013Broad consensus on climate change across American states
kanspaugh @3. While not denying the power of lobbying groups, the analogy between the NRA and fossil fuel industry doesn't play well. The former claim second amendment rights in support of the right to bear arms, and short of being in the firing line, Joe Public isn't affected by the NRA's love of weapons. Not so with climate change; Joe Public most certainly will be affected. And while a good majority of them may believe that climate change is real, I suspect very few really have any idea of the catastrophe that awaits, if not them, then their children and grandchildren.
With at least one notable exception, climate scientists have been very conservative in aggressively telling the public about what the future may – no, WILL – bring without adequate reductions in CO2 emissions. I suspect most of the public think in terms of perhaps a few more storms in the mid-west, maybe some water shortages in the south west, and maybe some more events like Sandy (but the insurance companies will pay, won’t they?). Do they really know the likelihood of extended drought in the mid-west and south west, decimating livestock production, and making the south west uninhabitable due to lack of fresh water (‘A 12000 year perspective of 21st century drought in southwestern North America’, Woodhouse et. al, PNAS 2009)? Do they understand that there is nothing they can do to save east coast cities from rising sea levels (‘Rapid accumulation for committed sea level rise from global warming’, Strauss, PNAS, 2013)? Do they understand that rising summer temperatures will result in significant decline in production of corn, soybeans and cotton (‘Nonlinear temperature effects indicate severe damages to US crop yields under climate change’, Schlenker and Roberts, PNAS, 2009)? I suspect not.
Some people may take solace in knowing that timescales may be measured in centuries, but with the Arctic melt trend lines suggesting an ice free summer by 2016/2017 weather patterns will continue to change for the worse in much shorter timescales. And catastrophic collapse of the WAIS – likely to occur once the Ross ice shelf disintegrates - would cause significant sea level rise occur in decades.
-
CBDunkerson at 03:24 AM on 20 November 20132013 SkS Weekly News Roundup #46B
CCE, actually I expect that global warming denial will evaporate quickly after the fossil fuel industry loses its political clout. Solar power is starting to catch on in the US and direct exposure to the reality of solar power is starting to change 'conservative' viewpoints away from their propaganda driven opposition. More and more Republicans are coming out 'pro solar' in a party that reviled solar power just a decade ago. People can see for themselves that solar works, and as that knowledge spreads the days of fossil fuel political domninance are numbered.
So, I'd say there is a tsunami of change already wiping out 'business as usual' power generation, and our political institutions are starting to shift in response.
BTW: Next news report should include the interesting study by Halfar et al in PNAS extending Arctic sea ice records back ~650 years based on coral proxies. This finally provides decadal resolution data on how sea ice has responded to previous climate shifts. Should help pin down whether we are looking at a mostly ice free Arctic ocean by 2040, 2030, or 2020.
-
MA Rodger at 03:13 AM on 20 November 2013Models are unreliable
Echoing KR@659, I too have occasioned upon dvaytw engaging the denialista. My only criticism would be his (once) suggesting that I was an "actual climate scientist" which I am not. Then as @565 "Credentials are irrelevant in science, what matters is the strength of the evidence and the internal consistency of the argument. "
-
Models are unreliable
Moderators - My apologies, the link in my previous post should be "dvaytw's presentation of SkS information on other forums".
-
Models are unreliable
John Hartz - I would strongly disagree based on dvaytw's presentation of SkS information on other forums. He indeed is arguing the science with support from discussions here.
dvaytw - I would strongly suggest including such links (if possible) to these various discussions whenever referring questions from deniers? As in, every time? Not only does that make your position clearer, but provides context that might greatly aid answering such questions. In fact, that might cut short a pattern I've seen with your questions from several back-and-forths to a briefer conversation that more directly addresses the denier myths involved.
As it is, your questions feel like a game of Telephone...
Moderator Response:[JH] Thanks for the feedback re dvaytw's credentials. Your advice to him is also appreciated.
-
PluviAL at 02:46 AM on 20 November 2013Broad consensus on climate change across American states
This is very positive. It shows that the hard work of scientists and dedicated people in general to get the word out, despite defective media tendencies to mal-inform. Except for Murdock's private disinformation network, most media is simply not dedicated to good reporting. As the article shows they must make the show flow and interesting. Importantly, reporters don't want to alienate the audience. They will say we listened to both sides, giving the impression of equality.
One way to combat this tendency may be to take the rhetoric to the other side. The argument that all weather events are affected by additional energy in the system is more true than the idea that any single event cannot be demonstrated to be exclusively the result of climate change. The meteorological community, reporters in particularly, should consider the important responsibility of the distinction, just like they inform people when weather threatens their life of property.
-
tmac57 at 02:42 AM on 20 November 2013Global Warming Paws Fails to Materialise: Earth Still Warming and Global Sea Level Rising Like Gangbusters
"Get your 'pause' off me you damned dirty deniers!!!"
Sorry...I couldn't resist :)
-
Dikran Marsupial at 02:31 AM on 20 November 2013Models are unreliable
JH, surely nobody would stoop to that sort of behaviour on climate blogs? Perish the thought! ;o)
-
Albatross at 02:27 AM on 20 November 2013Super Typhoon Haiyan: Realities of a Warmed World and Need for Immediate Climate Action
Hi Tom @3,
That Wunderground figure you posted does tell a "nice" story. This is not a rigorous statistical analysis, but what struck me about that figure is that is does support the research finding that the strongest tropical storms are becoming stronger as the oceans warm in response to global warming.
For example, according to that Wundeground figure that you posted, 70% of the strongest landfalling hurricanes on record have occurred since 1990, and a whopping 50% since 2000. That is not consistent with claims being made by some "skeptic" contrarians.
In the case of Haiyan, data suggest that the cyclone traversed waters that were much warmer than usual below the surface, with anomalies approaching 5 C above normal near 100 m below the surface. Consequently, this storm had an immense amount of energy to tap into once it started to strengthen, and we witnessed the tragic and horrific consequences. For example, here is some footage of the storm surge as it came ashore at Hernani in eastern Samar on 8 November 2013.
-
John Hartz at 02:17 AM on 20 November 2013Models are unreliable
MA Rodger & Dikran Marsupial:
It is possible that dvaytw's "friend" is a ruse by dvaytw to get around the SkS Comments Policy. You should keep this possibility in mind when responding to dvaytw's "friend." I and other Moderators need to keep this possibility in mind when reviewing dvaytw's posts.
-
kanspaugh at 01:21 AM on 20 November 2013Broad consensus on climate change across American states
Just as fear of the gun lobby keeps politicians from passing sensible gun laws, so fear of the fossil fuel industry lobby leads politicians from addressing the threat of climate change. Even though the vast majority of Americans are in favor of universal background checks for buying firearms, members of Congress won't pass such laws for fear that the NRA and its minions will punish them politically. Even if the vast majority of Americans believed in anthropogenic global warming and demanded our government do something about it, the Republicans in Congress would persist in pretending that global warming is not happening, is all a "liberal hoax" -- this to keep from being "primaried." Depressing.
-
Dikran Marsupial at 00:30 AM on 20 November 2013Models are unreliable
dvaytw's friend wrote "What I am saying is that your belief in climate models is based on accounts written by science journalist, none of whom actually do the research themselves. In fact, looking through Skeptical Science, I am left wondering if the writers of the blogs actually can understand the original studies they are reporting on."
Actually, I have worked on statistical downscaling of climate models, which is a task that requires a reasonable working knowledge of the operation, mathematical and statistical principles involved. The paper was published in the international journal of climatology here:
M. R. Haylock, G. C. Cawley, C. Harpham, R. Wilby and C. M. Goodess, Downscaling heavy precipitation over the United Kingdom: A comparison of dynamical and statistical methods and their future scenarios, International Journal of Climatology, volume 26, issue 10, pp. 1397-1415, August 2006. (doi)
However, given he starts his question with an ad-hominem and just continues it, and adds little detail of the scientific question he wanted to ask, I rather doubt that any answer will change his opinion.
Credentials are irrelevant in science, what matters is the strength of the evidence and the internal consistency of the argument. Now if your friend is really concerned about credentials, ask him why he doesn't accept the views of the IPCC on models, as the authors of the IPCC report have as good a set of credentials as you could possibly want to see. I suspect the reply will be another ad-hominem, but do ask him.
-
kmalpede at 00:22 AM on 20 November 2013Broad consensus on climate change across American states
"Extreme Whether" is a new play that tells the story of the obstruction of climate science by deniers. www.theaterthreecollaborative.org
-
YubeDude at 23:24 PM on 19 November 2013Super Typhoon Haiyan: Realities of a Warmed World and Need for Immediate Climate Action
Mod in response @22
RP is the official name; it stands for the Republic of the Philippines and it happens to be where I live...also known as the PI (for old school US Navy types) or as I like to call it “the corrupt and fetid 7100”.
The UN (using the World Bank "World Development Indicators 2012) list the RP on the per capita income index @114 out of 186, tied with Uzbekistan, just behind Moldova and slightly above Botswana; that supports the statement that the Philippines is impoverished.
http://hdrstats.undp.org/en/indicators/20206.html
The good news that the government is trying to pass on is that 26% of the population is under the poverty line; they forget to include that the poverty line is a bar set very, very low, around $2600usd they also forget to mention that the % has increased 1%+ in 6 years. Of course Wiki list the poverty line at 16,000p per capita which is a long way away from $2600usd…
So as a point of accept social science, the RP has a long history and culture of poverty that impacts any response to a natural disaster.
These are the accepted points of fact concerning the RP that I was referring to. In the social sciences facts and metric standards have a little more interpretive breathing room than say chemistry or biology; but still your point is taken and in the future I will refrain from injecting any bias or subjective observations. As an aside notice all the construction bamboo and corrugated tin roof sections in the rubble…unlikely these kind of building materials were found in large quantities in New Orleans or New Jersey after those dramatic storms. There really isn’t any reason to compare building codes or enforcement; apples and cockroaches.
Yes I know, this is not scientific nor does it address any aspect of climate science, it is merely an observation regarding the comparative impacts of this kind of weather event on a first world country vs. a third world country.In the future I will make nonscientific observations in the weekly forum as you suggested.
-
MA Rodger at 22:51 PM on 19 November 2013Models are unreliable
dvaytw @654.
Your physicist friend-of-a-friend asks an exceedingly narrow question (presented @650) given he is describing his reasons for entirely dismissing climate modelling. And now he impunes SkS blog-writers & blogs and accuses commentors of wielding Okhams broom.
All in all, folk who speak with such 'authority' do not do so in such a dismissive way if they are genuine. (The apparent incoherence is not untypical of a 'technophile' but not entirely a good sign.) So I fear that that broom is in the hands of you physicist
You could ask him to (or may be you could yourself) describe the "many of the points Tom and (he) have been stating (t)here (that) have been brought up, and if you watch closely, ... get brushed aside, as if paying too much attention to them would spoil the game." It would allow all to get the measure of each other without his personal appearance here at SkS which he is so afeared to do. -
dvaytw at 21:20 PM on 19 November 2013Models are unreliable
Thanks guys. My friend now makes the following objection in defense of his refusal to actually simply appear in the comments section and ask his questions himself:
What I am saying is that your belief in climate models is based on accounts written by science journalist, none of whom actually do the research themselves. In fact, looking through Skeptical Science, I am left wondering if the writers of the blogs actually can understand the original studies they are reporting on. I did a search through the blog for hindcasting and looked at some of the studies they comment on. It's clear that their representation of hindcasting in your link is not at all what the original researchers thought they were doing. http://www.skepticalscience.com/loehle-scafetta-60-year-cycle.htm Even in Skeptical Science account of the study, it's clear the aim of the research is to isolate relevant variables, not to 'test models'. http://www.skepticalscience.com/team.php But none of this surprises me when I look at the background of the people posting on the blog. Almost all of them are computer scientists or involved in Earth science of some sort. None of them have formal backgrounds in experimental research. They are like talking to economists about society and culture. They would have had little instruction or research experience in issues related to causality and experimental control. And as I said above, none of them have even published in this field. I don't know if you read through the comments to your link, but many of the points Tom and I have been stating here have been brought up, and if you watch closely, they get brushed aside, as if paying too much attention to them would spoil the game. Which, indeed, it would. They're bloggers, after all, not climate scientists.
It strikes me that I've never paid too much attention to credentials here, but would y'all respond to this?
-
Kevin C at 21:09 PM on 19 November 2013Help make our coverage bias paper free and open-access
I've put in the Open Access payment, although we're still about £300 short of covering costs. Hopefully QJRMS will update the paper status today.
Thanks again to everyone who has contributed!
-
Morgan Wright at 19:56 PM on 19 November 2013Ljungqvist broke the hockey stick
Not only am I foolish enough to use that single proxy for a whole hemisphere, I use it for both hemispheres. And let me tell you why:


-
Poster9662 at 17:37 PM on 19 November 2013Global warming since 1997 more than twice as fast as previously estimated, new study shows
Dhogaza Perhaps it didn't take decades for plate tectonics to become accepted but as it took about 50 years for mainstream science to "properly reject" continental drift, it seems an extraordinarily long time for scientists to recognise that the continental drift hypothesis was physically impossible
Thank you Victor Venema, your comment is the epitome of scientific restraint which is as it should be given the "newness" of the paper. I mentioned Judith Curry in response to this challenge from "Bert" who wrote "Show me a reputable site that refutes this refereed paper that is not run by the scientific illliterati". So I did.
-
Tom Curtis at 16:24 PM on 19 November 2013Ljungqvist broke the hockey stick
Morgan Wright @15:52, it is the standard convention in geology and radiocarbon dating that "the present" is 1950, ie, before large scale distortion of C14 levels in the atmosphere by atomic testing. As wikipedia notes:
"Before Present (BP) years is a time scale used mainly in geology and other scientific disciplines to specify when events in the past occurred. Because the "present" time changes, standard practice is to use 1 January 1950 as the origin of the age scale, reflecting the fact that radiocarbon dating became practicable in the 1950s. The abbreviation "BP", with the same meaning, has also been interpreted as "Before Physics"; that is, before nuclear weapons testing artificially altered the proportion of the carbon isotopes in the atmosphere, making dating after that time likely to be highly unreliable."
The obvious inference with regard to GISP2 is that 95 years BP is 1855, not 1905. As noted in the article linked by scaddenp @23 above:
"Easterbrook plots the temperature data from the GISP2 core, as archived here. Easterbrook defines “present” as the year 2000. However, the GISP2 “present” follows a common paleoclimate convention and is actually 1950. The first data point in the file is at 95 years BP. This would make 95 years BP 1855 — a full 155 years ago, long before any other global temperature record shows any modern warming. In order to make absolutely sure of my dates, I emailed Richard Alley, and he confirmed that the GISP2 “present” is 1950, and that the most recent temperature in the GISP2 series is therefore 1855."
(Emphasis added)
So, yes it is both well known that BP is before 1950, and hence that when Alley 2000 produces a temperature proxy ending 95 years BP, it ends in 1855; and well known that deniers did not acknowledge that fact, instead claiming the data ended in 1905. That is why there is a rebutal on that point dating back to February, 2011.
That is something you would have known if you had bothered to pay attention to those who responded to your original post instead of making silly comments about puppies.
And yes, I am more than happy to be remembered for drawing attention to the foolishness of treating the temperature proxy for a single location as the reconstruction for a hemisphere. Far rather that than to be remembered for promoting denier arguments out of (at best) complete ignorance on the subject at hand.
-
dhogaza at 16:06 PM on 19 November 2013Global warming since 1997 more than twice as fast as previously estimated, new study shows
PluviAL:
"It took dacades for the scientific community to accept plate tectonics"
Plate tectonics was accepted quite quickly after the theory was developed to explain (among other things) observed sea-floor spreading.
Not only does it provide a satisfying explanation for the fact that the continents fit together roughly like jigsaw puzzle pieces, it was the final nail in the coffin for the proposed mechanisms underlying the continental drift hypothesis, all of which were physcially impossible and therefore properly rejected by mainstream science.
There is a reason why modern scientists speak of plate tectonics rather than continental drift ...
-
Morgan Wright at 15:52 PM on 19 November 2013Ljungqvist broke the hockey stick
Just some basic fact checking for Tom. The GISP2 data does not start in 1855 as Tom says. At least not the source I used:
.095 thousand years is 95 years.
I only said 1900 as a rough approximation, far from "repeating a well known denier error" (not well known, never seen it before, I may have been the first to ever use it, please cite reference that it's a well known denier error). (-snip-)
Moderator Response:[RH] Hotlinked url. Ad hom snipped.
[RH] Tom is actually correct about the start date. I've spoken to Dr Alley personally in reference to this point. He says that 0.095 thousand years "before present" uses the common dating convention of 1950 representing "present."
-
Morgan Wright at 15:06 PM on 19 November 2013Ljungqvist broke the hockey stick
(-snip-)
Moderator Response:[RH] Morgan, please read the commenting policy for SkS. The tone you're setting is not tolerated here. People are trying to have an honest discussion with you. Please respond in kind.
-
Tom Curtis at 14:37 PM on 19 November 2013Ljungqvist broke the hockey stick
Morgan Wright @25:
"I just put the GISP2 chart here to show how it compares to the other 3 data sets. Looks like a nice fit."
Actually, no, it does not:

What is more, even if it did, using a single local proxy as a proxy for hemispheric or near hemispheric temperatures is always wrong, with the only exception being when the changes of interest globally are greater than 2 C (as between glacial and interglacial). Even if the comparison looks good, making the comparison will teach those who know no better to continue doing so when they should not.
When you make the comparison, repeat a well known denier error (GISP2 ending in 1900 rather than in 1855); and then try on a well known and deceptive denier tactic (adding in global temperature values to a local proxy); and all this with the local proxy most famously abused by deniers in exactly these ways - it gives me serious reason to doubt your bona fides.
-
Morgan Wright at 14:09 PM on 19 November 2013Ljungqvist broke the hockey stick
I just put the GISP2 chart here to show how it compares to the other 3 data sets. Looks like a nice fit. It also looks like some people are having a bad Monday.
Scaddenp that is a great idea, splicing modern Greenland Summit Station temps onto it. I probably should have done that. My bad.
Not a dogpile, more like puppies untying shoes.
-
Tom Curtis at 14:09 PM on 19 November 2013Ljungqvist broke the hockey stick
As some may not want to trouble themselves following links, here is the GISP2 data with the difference in temperature between the end of the data and 2010 at the site appended, for comparison with Morgan Wright's effort @9:

That, however, is not the last word. Since the GISP2 data was analyzed by Alley et al, Kobashi et al (2011) analyzed the same ice core at higher resolution, and to a more recent date. The higher resolution shows some greater temperature excursions in the past. Kobashi et al also directly compare the proxy data with the reconstruction of modern temperatures at the site by Box et al (2010), and to the actual recent instrumental record at the site:

You will notice that the recent temperature was just, and briefly exceded during the MWP, and significantly (approx 3 C) exceeded around 750 C.E. (ie, prior to the commencement of the MWP). That, of course, is of little relevance except as regards temperatures in Greenland. A single site is not the globe. It is not the Northern Hemisphere. It is not even the extra tropical Northern Hemisphere. Pretending that it is, ie, that a single local proxy can substitute for a multi-proxy reconstruction is (at best) incredibly foolish.
An argument that such a local proxy is acceptably representative because "it seems to agree fairly well with the others" is jaw-dropping in its audacity. Such an appearance of similarity is, in fact irrelevant and gives no basis to trust the local proxy in prefference to the reconstruction - especially where they disagree. When the argument is backed by simple errors of fact (the original GISS2 reconstruction extends only to 1855, not 1900), and is followed by appending global temperatures to a local proxy to represent changes in extra-tropical NH temperatures, it is evidently an invitation to inaccurate analysis. The only thing correct in Morgan Wright's analysis is that he did in fact show the GISP2 data from Alley et al.
-
scaddenp at 13:01 PM on 19 November 2013Ljungqvist broke the hockey stick
At risk of dogpiling - but Morgan, have you considered putting modern greenland temperature at the GISP2 site instead of a global average? (and I think the last record in GISP2 is 1855) . Don Easterbrook is the specialist in this nonsense. See here for more (including putting the modern temperature on).
-
Rob Honeycutt at 12:59 PM on 19 November 2013Ljungqvist broke the hockey stick
And not only that, you're splicing a global record onto a very high latitude temperature record.
-
Rob Honeycutt at 12:56 PM on 19 November 2013Ljungqvist broke the hockey stick
Morgan... You do realize, don't you, that you are splicing a global record (GISS) onto a regional record (GISP2) of temperature... right?
-
michael sweet at 12:48 PM on 19 November 2013Ljungqvist broke the hockey stick
Morgan,
Have you spliced the GISS world wide temeprature record onto Ljundqvist's Northern Hemsiphere only data? Please provide citations for how you have concocted this graph. Why don't you compare the price of oranges to the price of gold? The OP shows that it is currently much warmer in the Northern Hemisphere than it ever was during the medieval warm period. Your post should be deleted as off topic. If you want to impress people you need to cite peer reviewed data, not graphs you make up after your frisbee golf tournaments.
-
Morgan Wright at 12:21 PM on 19 November 2013Ljungqvist broke the hockey stick
I like how we are comparing Ljundqvist to Mann 2008, and Moberg. Just for fun I'm linking the GISP2 data. It seems to agree fairly well with the others.

http://www.hyzercreek.com/hockey3j.jpg
Because the GISP2 data only go up to 1900, I attempted to splice the last century of thermometr data (GISS) onto it to bring it up to 2013

http://www.hyzercreek.com/hockeysplice.jpg
I hope people enjoy my splice
Moderator Response:[RH] Fixed image widths.
-
johnthepainter at 11:30 AM on 19 November 2013Broad consensus on climate change across American states
This is all familiar for those who have been following the subject. But the fact that most people have wildly mistaken understandings of what scientists and non-scientists think shows there is need to keep getting the information out. As Frank Luntz, the man who taught Republicans how to get their message out, wrote, "There’s a simple rule: You say it again, and you say it again, and you say it again, and you say it again, and you say it again, and then again and again and again and again, and about the time that you’re absolutely sick of saying it is about the time that your target audience has heard it for the first time."
-
PluviAL at 10:55 AM on 19 November 2013Global warming since 1997 more than twice as fast as previously estimated, new study shows
Is it that the "ignorati" might disagree with us, or is it that scientifically minded people are logically superior and more fair? It took dacades for the scientific community to accept plate tectonics, now it is conventionial earth physiscs. People are passionate, since scientists are people they are passionate too.
It seems we have to do a better job of communicating to each other, to the media, and thus to the scientifically untrained. One of the ways is to be a little more humble about how fair we are. I am speaking from current experience trying to introduce a new concept to the scientific comunity. It is much hareder than one might think. But Thomas S. Kuns (the structure of scientific revolutions) would not be surprized.
-
davidnewell at 05:36 AM on 19 November 2013Super Typhoon Haiyan: Realities of a Warmed World and Need for Immediate Climate Action
It was interesting to listen to the two scientists discoursing about this subject on "Science Friday" on PBS last week.
Enragingly (to me) they concluded that by the end of this century they may have accumulated enough data to determine if climate change is influencing the matter.
This seems to me to be akin to a person, standing beneath a piano which has been dropped from 10 stories above, deciding to see if a breeze will come up to change the trajectory of it's fall, before electing to move out of it's way.
"Come ON, breeze!!"
http://www.sciencefriday.com/segment/11/15/2013/gauging-the-impact-of-climate-change-on-hurricanes.html
Moderator Response:[JH] Unnecessary white space deleted.
-
VictorVenema at 05:06 AM on 19 November 2013Global warming since 1997 more than twice as fast as previously estimated, new study shows
Poster, in case you are interested, I just wrote my thoughts on the comments of Judith Curry (and Watts and Lucia).
Concluding, I see no problems with this paper. Like any work of science there is no certainty and we will have to see what future scientists will find. The comments by Judith Curry and Lucia point to interesting points for future research, but do not invalidate the study in any way.
-
Paul Magnus at 03:54 AM on 19 November 2013Super Typhoon Haiyan: Realities of a Warmed World and Need for Immediate Climate Action
There are quite a few effects that a warming climate will have on storms. It can't not affect them can it. The profile is changed. Anecdotally it seems to me that powerful storms are spinning up much quicker.
They are also happening earlier and later. Their tracts are also changing. They are starting and traversing over wider regions due to a greater spread of warmer surface temperatures. Are they lasting longer? Seems that way. Both these means they are combining with other weather phenomena more often like what happened with Sandy.
Higher sea levels are having an impact on bigger storm surges. Their intensity certainly seems to be getting more or peaking higher at certain times.
Precipitation for less intense storms is going through the roof. Thus making those quite devastating on a region. Not only for humans but for wild life etc.
The frequency of more powerful storms seems to me to be increasing. See also this...
intensity-or-frequency
http://residualanalysis.blogspot.ca/2010/04/intensity-or-frequency.htmlhttp://climatecrocks.com/2013/11/13/haiyun-is-this-a-trend/
So there are all these things and a few more which are happening due to global warming. Various sorts of storm records are been broken more frequently now.
We need to have a central reference repository that meteorologist and climate scientist can use as a base line when talking about storms and global warming. There is still too much confusion when this topic is presented to the public unfortunately.
-
ajki at 00:13 AM on 19 November 2013Help make our coverage bias paper free and open-access
hm.
I think, I'll throw in another £40 (roughly about 50€). That would be the sum I'd give to SkS and John Cook for this great website this year - but I really believe that free access to scientific papers is necessary. There are still far too many papers not accessible to everyone.
-
YubeDude at 23:18 PM on 18 November 2013Super Typhoon Haiyan: Realities of a Warmed World and Need for Immediate Climate Action
From the RP:
This is slightly off topic...(ok way off topic but where on SKS can this be posted?)
Part of the measure impact as far as the death count is concerned is related to the infrastructure and culture of poverty that defines this 3rd world effort at modernity. This in no way lessens the tragedy or alters the storms intensity or even addresses the climate science issue. I am only stating a point of fact about the Philippines. Had this storm hit Japan you would not had seen anything like this as far as damage or body count. Often the media gets into a frenzy over the numbers without any perspective.Moderator Response:[JH]What does the phrase, "From the RP" mean?
For future reference, the threads to Weekly Digests and News Roundups are "open threads."
Your "point of fact" is nothing more than your personal opinion. Unsubstantiated global assertions carry little or no weight on the SkS comment threads.
-
Kevin C at 21:18 PM on 18 November 2013Help make our coverage bias paper free and open-access
Now at £1500. I've just been through the Wiley website, and while I do qualify for the RMS discount, the prices don't include VAT. So it's going to be $3000 unfortunately.
-
Paul Pukite at 15:28 PM on 18 November 2013Help make our coverage bias paper free and open-access
I put in 20 pounds in retaliation for my employer who won't support any publishing cost.
-
Tom Curtis at 11:01 AM on 18 November 2013Super Typhoon Haiyan: Realities of a Warmed World and Need for Immediate Climate Action
jzk @19, when you think about it, most of the data about peak intensity for cyclones since the 1970s will come from sattelite observations. That is because it is very rare for cyclones to strike land at their peak intensity, and even when they do strike land data will be distorted by the slowing of the winds due to friction, the location of the instruments relative to the eye, and the period over which the instruments survived. Thus, the Tacloban Airport anenometer only recorded gusts up to 23 km, but that is hardly relevant given that it was destroyed four hours before the nearest approach of the eye. As another illustration, here is a pressure record from Tacloban City (probably the closest surviving record):

It, however, was taken "a few miles north of the edge of the eye" and so certainly do not indicate directly the actual pressure at the center of the eye (estimated at 895 mb by the Japanese Meteorolical Agency from satellite).
The PAGASA record may in fact be derived from the JMA estimates which are based on satellites in the same way as the JTWC, although using a 10 minute time period for gusts.
If you wish to avoid comparing apples and oranges, I'm sorry. You are out of luck. All we have been served is fruit salad. All I know is that the JTWC data are typically used by researchers in preference to that of JMA/PAGASA; and that the JTWC long term record rates the Haiyan as the fourth most powerfull tropical cyclone in terms of wind speed, and the most powerful at the time of landfall, while the JMA ranks it as the second most powerfull, and the most powerfull at landfall; and that two lists for tropical cyclones making landfall in the Philippines purportedly from PAGASA disagree about the cyclones in the top five, their windspeeds, and their rank order.
-
grindupBaker at 09:53 AM on 18 November 2013Super Typhoon Haiyan: Realities of a Warmed World and Need for Immediate Climate Action
I think the comment "but most notably through rising sea levels" needs modification or clarification because I would think by general logic that the extra energy added significantly more to the energy that this typhoon delivered to land than the small sea level increase. Dr. Mann quotes Yeb Saño on this but I infer that his posting does not allow him realistically to delve into complexities without losing the focus on this particular disaster. That could be done in this posting. I infer that sea level rise is a longer term issue than current times (currently minor). If I am incorrect, somebody please educate me regarding the amplification of the small sea level increase as the surge pushes and squeezes water up the gradient (choke-point) to land.
-
jzk at 09:48 AM on 18 November 2013Super Typhoon Haiyan: Realities of a Warmed World and Need for Immediate Climate Action
Tom @ 18
"You may want to speculate about a fundamental disagreement between PAGASA and JWTC, but in the absence of specific information, that is all you are doing. Inexpert sepulation in the face of the better informed opinions of experst such as Jeff Masters."
Really, when I saw that ranking I wanted to understand the source of your data. I don't fault Jeff or the JWTC for making estimates at the time based on the best information that was available to them. But, if we are going to be comparing storms, we should compare apples to apples. Are the other storms on that list ranked by 1 minute sustained gust data estimated by satellites, or is it based on actual instrument readings on the ground over ten minutes? Even inexperts like me can ask questions like that to ascertain the vailidity of the comparison, no?
Prev 804 805 806 807 808 809 810 811 812 813 814 815 816 817 818 819 Next


