


 Arguments


Recent Comments
Prev 815 816 817 818 819 820 821 822 823 824 825 826 827 828 829 830 Next
Comments 41101 to 41150:
-
Doug Bostrom at 14:39 PM on 19 October 20132013 SkS Weekly News Roundup #42B
Re the mess caused by the shutdown, I'd like to see a clearinghouse set up for researchers to describe the impact on their work.
I know of a major meeting here in Seattle to do with earthquake resilience that was thrown into chaos thanks to the GOP's psychotic clown posse. Researchers coming in from New Zealand and other places at great expense arrived to find that their USGS counterparts could technically face fine and imprisonment* for meeting as agreed, ages ago. Not only were we wasting our own time but that of others. We're also destroying our credibility as reliable partners.
Other people I know faced similar absurd problems. Seeing all of this waste summarized in one place would be helpful and instructive.
-
bwilson4web at 13:53 PM on 19 October 2013Does the global warming 'pause' mean what you think it means?
Maybe I missed it but claiming something about a change in the slope of global warming is nonsense. Now if the sign of the slope changed, I'd be interested but to quibble about the value of the slope?
The honorable global warming deniers are face with some hard, undenible facts. Arctic shipping through the NorthEast and NorthWest passage exceeded 1 million tons in 2013. It was 1.2 million tons in 2012 and similar numbers of ships, tonnage unknown, in 2011. The practical effect, the business effect, is Arctic shipping is open for the third year in a row.
So if this is just a slope problem and not a sign, hammer them away with "Is it cooling now?"
Bob Wilson
-
Manwichstick at 12:54 PM on 19 October 2013Does the global warming 'pause' mean what you think it means?
I just rebutted a piece by a local TV meteorologist here in Toronto, and I used an "office building analogy" to explain the pause in global warming.
See what you think of it. I'm wondering if I subconciously "borrowed" it from someone here at SKS...
The scientists understand how “temperature” is not the same thing as “heat”. They have a good understanding of how surface temperatures are coupled to global heat content and how ocean currents affect surface temperatures. Farnell’s point is false because surface temperatures can drop while the Earth still warms (over short time periods). The folly of point 1) can be illustrated with this example:
Imagine an office building with 10 floors. Now picture yourself sitting on the 10th floor of the building and making this claim,
“No one must be entering this building since the number of people on the 10th floor has not gone up.”
Imagine making that statement above while simultaneously looking out the window and noticing the number of people entering the building is greater than the number of people leaving the building. Point 1) is like that. Its conclusion does not follow from its premise, and it is observably wrong. -
gws at 09:07 AM on 19 October 2013Does the global warming 'pause' mean what you think it means?
caroza @12
hmmh, an analogy may be a bedroom: the person in bed is the heat source, the blanket the top layer of the ocean, the air in the room all deeper layers; the bedroom is thermally well insolated. Findings, with heat source constant:
- the blanket heats up quickly but then stays at equilibrium Temp., the air in the room will heat up more slowly over time although the blanket does not change Temp. any more
- if you shake out the blanket regularly (ENSO), then put it back in place, it will cool a little temporarily while the room keeps heating
-
Tom Curtis at 07:26 AM on 19 October 2013IPCC model global warming projections have done much better than you think
VeryTallGuy, first (and with all respect), Dikran Marsupial has misinterpreted me. I do say that ENSO is the dominant cause of the "hiatus" (better, slowdown), not that it could explain it. Of course, it is always possible that I am over interpreting the evidence, and that Dikran's claim is more accurate given the evidence. That would be the case if global warming would have accelerated absent all factors contributing to the slowdown. In that case, the contribution of ENSO could be sufficient to almost completely explain the reduction in short term observed trend relative to the long term observed trend, but changes of forcings could likewise explain a similar amount. In that case, temperatures without these short term influences would have accelerated to an approx 0.25 C per decade warming trend.
With respect to my actual claim, however, it is not inconsistent with that in the IPCC. To be specific, my claim is that, when compared to all other individual factors influencing the slow down in global temperature rise, ENSO has a significantly larger influence than any other individual factor; and that the influence of ENSO is not much smaller (if smaller at all) then the sum of all other factors. That is what is mean by "dominant". In contrast, the IPCC claims that the sum of the influence of natural variability is not much different from the sum of the influence of changes in forcing. Thus, there may exist natural variability of opposite sign to the ENSO influence, reducing the net impact of natural variability relative to the net impact of changes of forcings. Or the influence of ENSO based natural variability may be greater than the combined influence of changes in forcing, with the two individual factors contributing to change in forcing each individually being significantly smaller than the ENSO influence. In both these cases, both my claim and that of the IPCC would be correct.
A third possibility is that the IPCC understates the influence of natural variability. Given that the IPCC did not have access to Kosaka and Xie (published online in late Aug 2013, and not included in the IPCC references), that is plausible. Equally plausibly, a new study may come out showing Kosaka and Xie's result to not be reproducible, or to have overstated the influence of ENSO (in which case my opinion would revise back towards that of Dikran Marsupial and the IPCC).
So, to summarize:
1) My claim, which assumes a linear base trend in global temperatures, may be incorrect and the IPCC's correct because global temperatures would have shown an accelerating trend absent both the ENSO influence and the reduced forcings;
2) We could both be correct, with the ENSO influence on the lower end of what I expect based on the evidence but still the dominant influence (ie, greater than 50% and >> than any other individual influence);
3) Either I or the IPCC could be wrong, they because they present a snapshot of the science as it existed 6 months ago; or I because the most recent evidence (on which I rely) is overstated in some way.
Finally, I note that the IPCC discuss the influence of the PDO rather than ENSO. That is not a difference between us in that the two are closely related, with PDO states causing dominant influences of La Nina or El Nino (depending on whether the PDO is +ve or -ve) in ENSO; or because the PDO is just a filtered effect of ENSO on the north Pacific. (SFAIK, it is not as yet clear which of these is the case.)
-
Tom Curtis at 06:38 AM on 19 October 2013Why Curry, McIntyre, and Co. are Still Wrong about IPCC Climate Model Accuracy
WebHubTelescope @190, can you direct me to documentation justifying the SALT model method, because on a casual perusal I am far from impressed.
My initial concerns were raised by the tunable, and different lags for different forcings. If you allow yourself to tune lags, I am sure you can get some very good fits between models and observations, but a physical explanation as to why solar forcings should have half the lag of anthropogenic forcings, and nearly one sixth that of volcanic forcings is decidedly lacking.
On closer inspection, I am even more perplexed. The "fluctuation components" show a very large, unexplained "linear" adjustment peaking at 0.396 in Nov 1943, and apart for its rapid fall off, is essentially zero at all other times. That is by far the largest single fluctuation value on the chart, and has no apparent physical basis. The lod adjustment is also unexplained (what does lod stand for?) and is certainly not a component of the GISS model forcings. Further, the volcanic "fluctuation component" does not match the GISS model forcings from the 1920s to 1940s.
Without documentation, it appears from the "fluctuation components" chart that arbitrary "fluctuations" are added as necessary to ensure a fit between model and observations. If so, we should be less than impressed that a fit is then found.
-
caroza at 05:41 AM on 19 October 2013Does the global warming 'pause' mean what you think it means?
dana @ #5, would it make sense that as the oceans warm overall, upper layers might cool? I remember reading years ago (can't remember where, sorry) that as the ocean warms it mixes better and becomes less stratified. I assume that's still true although I don't know what sort of temperature increment results in what sort of degree of mixing. But it occurred to me at the time that as the deeper ocean warmed, if it mixed better with the layer above 2000m then that might cool the upper layer (for a while), given that the volume of water below 2000m is so huge by comparison to the thin upper layer, and relatively cold, so a tendency in the direction of thermal equilibrium might reduce upper layer temperatures.. Is that a possibility? Sort of analogous to the weakening jet stream resulting in weather which is warm by Arctic standards but very cold by British or European standards dumping snow and ice all over Britain and Scotland and making the deniers happy because of the snow in their back garden.
-
Doug Bostrom at 05:38 AM on 19 October 2013Does the global warming 'pause' mean what you think it means?
Sou at Hot Whopper has posted a pleasingly concise explanation of the major fallacy of Bob Tisdale's attempt to reply to Dana:
Bob Tisdale rejects the greenhouse effect
The seemingly rude title of the piece is unavoidable due to Tisdale's conclusions; the title is not impolite but is neutrally descriptive of the logical box Tisdale has constructed around himself.
-
ajki at 04:17 AM on 19 October 2013IPCC model global warming projections have done much better than you think
Perhaps the best way of showing the effect of removing *some* of the more or less known "internal variables" is... well, show it:

-
Paul Pukite at 04:11 AM on 19 October 2013Why Curry, McIntyre, and Co. are Still Wrong about IPCC Climate Model Accuracy
For SteathGuy, I would recommend looking at energy balance models first. Go over to this web site that generates model-based fits to various temperature series and intereract with the graphs:
http://entroplet.com/context_salt_model/navigate
I spend too much time at Curry's site tryin to reason with the skeptics and I at least give you credit for trying to construct a somewhat methodical argument. I just suggest that instead of looking at the GCMs at first, that you try to pull apart the possible independent factors that give rise to subdecadal and decadal climate variability. The snaphot below is a view of an interface that you can play with and see how the various lags have an effect on volcanic disturbances, TSI, etc.

-
Alpinist at 02:03 AM on 19 October 2013Does the global warming 'pause' mean what you think it means?
Here's Tamino's take on one of Tisdale's recent posts:
http://tamino.wordpress.com/2013/10/05/bob-tisdale-pisses-on-leg-claims-its-raining/
Moderator Response:[Sph] This is a borderline violation of the Comments Policy (no links without context). As it clearly relates directly to an analysis of Tisdale it is applicable (although, too, the whole Tisdale thing is in in danger of wandering off-topic), but in the future, please provide your own (better clarified) context around such a link.
-
Does the global warming 'pause' mean what you think it means?
garethman - That's a very good point, rhetorically "plausible" often has little connection with "likely" or "reasonable". Folks like Monckton make it a way of life, sounding entirely plausible while under closer examination what they are saying is utter nonsense. (Sounds great - just don't think about it...)
General items that jumped out at me in Tisdale's piece, which I've come to associate with unsupportable 'skeptic' nonsense:
- Short time frames, focus on small regions of the oceans/world (cherry-picking)
- No statistical analysis of trend(s) versus variation (i.e., math), just rhetoric that any statistical analysis would show invalid
- Claims that 'models fail', ignoring the physics basis
- Red herrings - for example, going on about models when the article under discussion is about observations
- Claims that the variable of interest isn't measureable (when that actually invalidates their own argument(s) as well)
- And "Buy my book", when said book has no peer-reviewed support
I may have have missed a few bits of nonsense - I didn't bother to check every assertion. But when there are so many red flags, I consider it safe to conclude that the article containing those errors isn't saying much worth reading.
-
garethman at 01:01 AM on 19 October 2013Does the global warming 'pause' mean what you think it means?
Thanks KR, I did indeed write that, but that is from a lay persons perspective. I wanted to check how accurate his essay was and a useful way of doing that is to get the experts here to dig a bit deeper and explain any mistakes in a way that I, as a lay person will be able to make sense of. The word interesting by the way can be applied to many things, they do not have to be correct! In some ways it is really difficult and long winded to check out all the facts in any essay item by item on both sides, thats why it is really helpful to have critical appraisals in this way by people who have previous experience.
-
Dikran Marsupial at 00:48 AM on 19 October 2013IPCC model global warming projections have done much better than you think
VeryTallGuy, I would say Tom's arguments show that most if not all of the hiatus can be explained by ENSO, but cannot show that it is caused by ENSO. Thus both Tom and the IPCC are right AFAICS, looking for other causes of the hiatus is just part of normal science (keeping an open mind), however Tom is right in suggesting that there is no pressing need for an alternative explanation as it is already quite well explained by ENSO. This sort of thing is a limitation of science, it is very difficult to show that X caused Y, only that Y can be explained by X.
The way science works is that if you can't show that the existing explanation doesn't explain the observations, or that your hypothesis provides a better explanation, then you probably shouldn't put much confidence in it. At the moment ENSO (i.e. internal variability) is a sensible null hypothesis, and it explains the observations pretty well, without ruling out alternatives.
Personally as a statistician, I am still waiting for statistically significant evidence that there actually has been a hiatus (i.e. a change in the underlying rate of warming). It is possible that there is actually nothing that needs to be explained in the first place! ;o)
-
kmalpede at 00:41 AM on 19 October 2013Science of Climate Change online class starting next week on Coursera
I'm teaching a section on climate change and the censoring of science in my Theater and Justice Class at John College of Criminal Justice: dramatic readings An Enemy of the People, my play Extreme Whether about climate change scientists and deniers, and Euripides The Bacchae. I've gathered some basic readings about climate change, but wonder if you have suggestions. I would also hope to see climate change and global warming integrated more broadly into (what is left of) The Humanities.
-
Paul D at 00:40 AM on 19 October 2013Science of Climate Change online class starting next week on Coursera
I have watched David Archers original videos of his lectures based on his book.
I found them very useful in understanding the basics, so I imagine the new course will be just as good with the new materials and additional learning facilities that Coursera enables. -
Does the global warming 'pause' mean what you think it means?
Tisdale also dismisses peer-review, claiming his data is from peer-reviewed sources (although certainly not his statistically unsupportable conclusions), and that the post here isn't peer-reviewed.
The SkS post isn't peer-reviewed, of course - but it's reporting peer-reviewed conclusions (IPCC AR5, not to mention a more direct reference to Nuccitelli et al 2012). And that's the major difference - the conclusions regarding OHC described in the IPCC are supported by science and good practice, while Tisdale's conclusions are based on cherry-picking, misunderstandings of statistics, and confirmation bias towards his personal "it's all ENSO and climate shifts" framework.
garethman - Over on WUWT you wrote "I suppose Dana’s essay and Bob’s both seem pretty plausible...". I would have to disagree.
-
VeryTallGuy at 00:30 AM on 19 October 2013IPCC model global warming projections have done much better than you think
KR, I think you misunderstand me. I wasn't trying to suggest that ENSO isn't part of natural variability.
Tom presents a view that ENSO explains most if not all of the hiatus (using IPCC terminology)
AR5 seems to focus on volcanoes and solar, and does not split out natural variability at all.
So I wonder if I'm missing something, and Tom seems well informed to comment.
-
numerobis at 00:28 AM on 19 October 2013Does the global warming 'pause' mean what you think it means?
I'm confused how Tisdale's response could possibly be qualified as "interesting" -- he has already written the same before, Nuccitelli here is pointing out Tisdale (among others) is wrong in several ways, Tisdale responds by ... making exactly the mistakes that Nuccitelli is pointing out in this article?!
-
dana1981 at 00:27 AM on 19 October 2013Does the global warming 'pause' mean what you think it means?
As usual Tisdsale is still focusing on surface temperatures and ignoring ocean temperatures. He does have a valid point that 0-700m ocean warming has slowed a bit, but only because 700-2000m ocean warming has accelerated. He's guilty of the same type of cherry picking I discussed above, just regarding surface ocean temps in addition to surface air temps.
-
garethman at 00:08 AM on 19 October 2013Does the global warming 'pause' mean what you think it means?
Many Thanks for your response KR.
-
IPCC model global warming projections have done much better than you think
VeryTallGuy - "...from internal variability..." includes the ENSO, one of the primary and in fact easily identified internal variations of the climate. It's hardly unattributable.
-
Does the global warming 'pause' mean what you think it means?
garethman - "Interesting", in the Bob Tisdale sense. Or nonsense, really.
Tisdale, as usual, focuses on extremely short time periods (2005-2013 for ocean temps, 2000-2013 for air temps, neither of which has statistical significance), on small regions of the world oceans rather than the globe as a whole (cherry-picking), on surface sea temps only while seemingly dismissing the energy accumulation in the volume (2D vs. 3D cherry-picking), disses the satellite temps while ignoring their agreement with surface temperature data sets, tosses out the old 'can't trust the models' myth, etc.
He even attempts to toss all of the ocean heat content data by inappropriate scale comparisons - yes, the energy throughput of the climate is very large, but no, that doesn't block our ability to measure changes in temperatures.
Quite frankly, having looked at Tisdale's writings before, I would consider this one more (and rather boring) Gish Gallop of myths and misunderstandings.
-
garethman at 23:44 PM on 18 October 2013Does the global warming 'pause' mean what you think it means?
Bob Tisdale has written an interesting response to this as published in the Guardian. http://wattsupwiththat.com/2013/10/18/dana-nuccitelli-cant-come-to-terms-with-the-death-of-the-agw-hypothesis/#comment-1452081 I would be really interested to see how Dana views this response and whether he feels it is valid.
-
Dikran Marsupial at 21:46 PM on 18 October 2013CO2 lags temperature
dvaytw, yes the rate of warming per unit CO2 does indeed decrease with increasing CO2 concentration, which is why equilibrium climate sensitivity is usually presented as the temperature rise for a doubling of CO2, rather than for a fixed increment.
CO2 solubility in the oceans is sensitive to both temperature and the difference in partial pressure of CO2 between surface ocean and atmosphere (Henry's law). Fortunately the difference in partial pressure is currently a stronger influence than temperature, which is largely why atmospheric CO2 has only been rising at half the rate of anthropogenic emissions.
David Archer is a top scientist working on the carbon cycle, and has some lectures etc. on his website that are well worth watching. He has also written a nice primer on the carbon cycle (see also his papers via google scholar).
-
dvaytw at 21:41 PM on 18 October 2013Temp record is unreliable
Thanks guys for all the tips. My initial tactic was to point out to him that there are so many temperature records showing the same basic pattern; if the measurement system were flawed, errors would be in all directions and there wouldn't be such obvious similarity between them. I also pointed him to a very useful pair of charts: on Wikipedia, 'temperature records by countries'. A quick glance of the 'hottest temperature records' vs. 'coldest temperature records' shows that the former outnumber the latter by a large margin in the last couple decades. So even just looking at that, the trend is pretty obvious.
I have another question, but I don't want to keep bothering y'all for answers, so maybe you could just direct me to the most pertinent article, in response to this point of his:// ...if anyone wants to claim that CO2 levels in the upper atmosphere are causing ground level increases in temperature, there would need to be much greater warming there, which is demonstrably not happening. //
PS - Moderator, please feel free to delete any of my "please help me with debate" questions to the forum if you feel they are off-topic or don't contribute to the discussion! Thanks in advance! -
dvaytw at 21:00 PM on 18 October 2013CO2 lags temperature
Dikran, thanks... that was exactly what I needed. Can you point me to a good online source to read more about this particular topic?
Also, a couple clarifications, please. When you say "temperature only rises logarithmically with CO2", does that mean that the rate of warming per CO2 concentration actually decreases as concentration increases? (I know this is a dumb question... sorry!)
About ocean solubility increasing with atmospheric concentration, is that also affected by temperature?
Finally, to JH: I apologize if I appear lazy in not using the search engine; however the problem I often find is in properly wording the inquiry and in searching through extraneous links. People are often better at pinpointing what you want and getting you the answer with minimum hassle. I spend a lot of time in these debates, and I try to minimize the time I spend on research as much as possible for obvious reasons (IE, no one's paying me!) That said, I feel I've learned so much about the topic in recent years maybe I should start working towards a degree!
-
garethman at 20:43 PM on 18 October 2013Time to change how the IPCC reports?
The infrequent release of IPCC reports does not really bother me, with such a comprehensive and complex document it takes me a long time to read and understand it in any detail.
-
Dikran Marsupial at 19:06 PM on 18 October 2013Why Curry, McIntyre, and Co. are Still Wrong about IPCC Climate Model Accuracy
SASM If you want to learn about models, then there are some very good books that are well worth reading on the subject. I have "A Climate Modelling Primer" by McGuffie and Henderson-Sellers, Wiley (there appears to be a new edition available shortly), which I would recommend. I would also recommend "Principles of Planetary Climate" by Raymond Pierrehumber (Cambridge University Press), although that is generally more concerned with basic physics and more basic models than GCMs. I have used GCMs for my research, and it took a lot of background reading before I had a good grasp of the essentials.
The IPCC have made all the data from the model runs publically available, including information about the forcings, so if you want to know how this is done, there is nothing to stop you from getting the data and finding out the answers to your questions. You appear to have a suitable background for this kind of work, but you just need to learn the basics of climate modelling first, before reaching judgements.
-
VeryTallGuy at 18:58 PM on 18 October 2013IPCC model global warming projections have done much better than you think
Tom Curtis @79
Your analysis of the hiatus vs ENSO is interesting and IMHO convincing. However, it doesn't seem to be the view of IPCC AR5 who don't mention ENSO specifically but say
The observed recent warming hiatus, defined as the reduction in GMST trend during 1998–2012 as compared to the trend during 1951–2012, is attributable in roughly equal measure to a cooling contribution from internal variability and a reduced trend in external forcing
and on which external forcings
primarily due to a negative forcing trend from both volcanic eruptions and the downward phase of the solar cycle.
Which basically reads as "mainly volcanoes and the sun, plus unattributable variability"
Your perspective on the AR5 conclusions would be interesing.
-
garethman at 18:37 PM on 18 October 2013Does the global warming 'pause' mean what you think it means?
The fairly simple point that occurs to me is the temperatures overall have not fallen, if they have not fallen the trend is still for warming, even if this slowdown in rate lasted a thousand years.
-
chriskoz at 17:07 PM on 18 October 20132013 SkS Weekly News Roundup #42A
'Australia to see worse ElNino drought'
You bet. No need to mention the record fires in NSW thanks to that drought, everybody's heard the news.
However, I want to mention the other part of the story: the wetter than usual ElNino conditions shall be predicted in the NE Pacific (or Pacific NW in US-centric nomenclature). Accordingly, we're seen just that: torrential rains and even rare tornado in Seattle as reported here. So, many pieces of evidence align for that case.
-
scaddenp at 17:05 PM on 18 October 2013Why Curry, McIntyre, and Co. are Still Wrong about IPCC Climate Model Accuracy
"The devil is always in the details." Agreed - which are not going to get in blog comments. If you are ready for that, then you should be moving on the primary literature and WG1 works pretty well as an "index" to that.
-
StealthAircraftSoftwareModeler at 13:33 PM on 18 October 2013Why Curry, McIntyre, and Co. are Still Wrong about IPCC Climate Model Accuracy
Moderator JH @183: Okay, fair enough. I’ll take the blame for starting the pissing contest. I do want good communication. Honestly! It is very easy to miscommunicate in email and upset people, and that is when they know who you are. Blog posts greatly amplify this effect because people will shoot off because of the anonymity. But I’m sure I’m not telling you anything new as a moderator.
Moderator Response:[JH} Been there. Done that. Let's all move forward in a civil manner.
-
StealthAircraftSoftwareModeler at 13:30 PM on 18 October 2013Why Curry, McIntyre, and Co. are Still Wrong about IPCC Climate Model Accuracy
John Hartz @184: Oh, I would. I wouldn’t do anything like contact GISS. Why would they waste their time talking to me? I understand that.
Your link to CM101 is broken, by the way, but I found it with Google. In looking at #2 “Understanding Computer Models” – I have some experience with every one listed, and enormous experience with some (i.e. flight simulators). The 101 video was extremely simple; I’m sure it is aimed at the masses, but remember I am a software modeler with a computer science and physic degree and 30+ years of experience. I’m looking for a lot more meat and the details. The devil is always in the details.
I’ve got Chapter 9 printed out. Hate that I nearly killed a tree, but I skipped all the references in the middle, and printed two pages per page, so that saved a bunch of paper.
Moderator Response:[JH] The most prominent feature of the Climate Modeling 101 website is the National Acadamy of Scinces report,
I highly recommend that you study this report if you are sincere in your stated goal of better understanding how global climate models work.
-
scaddenp at 12:58 PM on 18 October 2013Why Curry, McIntyre, and Co. are Still Wrong about IPCC Climate Model Accuracy
"There has to be a way of telling the model about..." well of couse there is. Forcings are input into the model. The CMIP experiment is about getting the different modelling communities to run the same forcing experiments and comparing results. The forcings to use are on the site but I see it is still down due the goverment shutdown.
-
John Hartz at 12:41 PM on 18 October 2013Why Curry, McIntyre, and Co. are Still Wrong about IPCC Climate Model Accuracy
SASM @ 179:
I highly recommend that you do more homework about GCMs before you begin to correspond with various modeling groups.
In addition to reading Chapter 9 of ARM 5, you should careful go through the Climate Modeling 101 website created by the National Academy of Sciences. [Link fixed - I hope.]
-
StealthAircraftSoftwareModeler at 12:35 PM on 18 October 2013Why Curry, McIntyre, and Co. are Still Wrong about IPCC Climate Model Accuracy
Moderator PW @179: So it is okay for Dikran to accuse me of Dunning Kruger syndrome, and state I haven’t bothered to find out about models – which is EXACTLY why I’m on this site. Then he states I think my field is better than climate modeling, when I’ve said no such thing at all! He can kick me all over, tell me to read up climatrology, which has nothing to do with anything in this thread and try to send me on wild goose chases. That isn’t obfuscation? C’mon.
BTW, what question have I failed to answer and is being noted and tracked? I apologize if I missed one, but trying to discuss things with an angry mob can be confusing.
Moderator Response:[JH] You came to this website with a chip on your shoulder. If you lose that, people will respond to you with civility.
-
StealthAircraftSoftwareModeler at 12:11 PM on 18 October 2013Why Curry, McIntyre, and Co. are Still Wrong about IPCC Climate Model Accuracy
Scaddenp @180: Thanks for the links. I’m downing loading AR5 Chp 9 now for a trip tomorrow. I have about 6 hours of captive time for a bit of reading. Ugh, 207 pages, but I’m sure it will be easy reading [sarc].
What I mean by “inputs for volcanic climate forcing” is: If in 1990 for the FAR they run a GCM from 1990 until 2090, then the models would not properly project the large temperature drop around 1992. How could it, no one knew that Mt. Pinatubo would erupt before it happened. Then, for the SAR report in 1995 and after Mt Pinatubo, the models are run again from 1990 until 2090, but this time they have “injected” additional data into the model with estimates of aerosols from Mt Pinatubo. This, of course, causes sunlight to reflect and the temperature takes a big dive. The models show this effect, so assuming the physics haven’t changed from 1990 to 1995, then there has to be a way to tell the model about a specific large eruption. Without that additional input data, I would think the model would produce the same result as in 1990, assuming the model is deterministic, which may not be the case. This is not a complaint, just an observation. Some of you are so jumpy and ready to pounce on me, that I’m starting to qualify a lot of what I say.
-
scaddenp at 10:56 AM on 18 October 2013Why Curry, McIntyre, and Co. are Still Wrong about IPCC Climate Model Accuracy
If you are putting a lot of thought into evaluating of climate models, then I hope you are also putting a lot of reading into Chp 9 of AR5 which precisely about this. if you want to know about models are made, then why not read the primary literature first instead of speculating?
-
scaddenp at 10:53 AM on 18 October 2013Why Curry, McIntyre, and Co. are Still Wrong about IPCC Climate Model Accuracy
SASM - As pointed earlier, some/lot of this is in FAQ on climate modelling at Realclimate (where you can ask the GISS modellers).
I am a little puzzled about what you mean about "inputs inserted in models for volcanic forcings". The big point about Pinatuba, was models forecast what an eruption like that would do (Hansen at al 1992) and then after the eruption (put in actual forcing), confirm the result (Hansen et al 1996). The only thing you "add" to model is the actual forcing in terms of aerosol load. The response to the forcing was already in the model. So models say "If you get X aerosol loading, then you should get Y responses". When X actually happens, you put in actual loading and compare output with observations. I dont think models have "random" forcings. In running a projection for next 100 years, you have to put in "random" volcanoes" at the rate you expect to get eruptions to happen historically otherwise model runs too warm. Noone expects that eruptions will actually happen at those dates, but if eruption rate matches historical norm, then 30 year trends should be predicted. Is that what you mean?
-
chriskoz at 10:05 AM on 18 October 2013Science of Climate Change online class starting next week on Coursera
Hi David,
Thanks for that course. I was a fan of your Modtran model. I'm looking forward to some good in-depth learning of Carbon cycle (i.e. 3 stages of ocean sink as I learned them from Archer 2005) and experimenting with the new models. Perfect content and perfect timing for me.
Thanks again
-
StealthAircraftSoftwareModeler at 09:48 AM on 18 October 2013Why Curry, McIntyre, and Co. are Still Wrong about IPCC Climate Model Accuracy
Dikran @178: I’m ignoring most of the accusations you make and all of your sidelobe jamming, except for the accusation of boasting, hubris, claiming my field is superior, and “not trying to find out what climate models involve”. Huh? That is exactly what I am trying to do on this site, but it has been circuitous due to (-snip-).
Geeze. I admit I have asked pointed questions, and part of this is to get you all to respond and defend the science. I am not exactly sure of what to look for, but your defense helps me figure out what I need to examine, and now I have a much better idea. Thanks!
Question 3: I retract my comment about being suspect about retro active adjustments to the models. It was late and I was tired. What I really meant to say is: clearly some sort of inputs are inserted into the model to properly force climate responses to volcanic eruptions. This is a completely reasonable thing to do, but my question is about other input adjustments that are injected into the models in the past to “get them to balance, or to reproduce observed results.” I am curious if (note, this word “if”, as in “maybe”) there are any of those types of input adjustments, and if so, what are they and why are they done.
I think this thread is winding down for me. I doubt anyone here can answer the questions I now have because you do not know enough about how the models are built. If I’m wrong and you do know a lot about how the models are built, I’d love to talk to on the side and offline. I have given more thought about how to test climate models, and the best would be to make projections and measure the results against real world measurements. Unfortunately, the issue with this is the amount of time it takes. Currently, I think a subsystem analysis of the various components of the model is the best that can be done. I would like to see what GCMs predict/forecast/project for major climatic components, not just air temperature. Here is a summary of what I am looking for:
I am looking for the forcing input adjustments used to represent volcanic and other random forcing. I would like to see model global projections (mean, 97.5%ile and 2.5%ile) from 1950 for air temp for multiple altitude layers, sea temp for multiple depth layers, humidity or water vapor by altitude layer, global cloud cover, and precipitation. I would also like actual measurements of these values.
Moderator JH @ 171: If you have any contact information for the organizations that develop and maintain the GCMs, I would like that. I assume you do not want to post their email and/or phone numbers. You can email the information to my email that I used to sign up on this website (it is a real email address, and please keep it private).
Moderator Response:[PW] Accustations of impropriety removed. Your further reluctance to answer direct questions also noted.
-
Fergus Brown at 07:38 AM on 18 October 2013Time to change how the IPCC reports?
Composer at #5; Yes, this is the elephant. The UN already hits the spectrum of politicised polemic in the USA (I don't think too many other countries have the same track record of disavowal). Such a process would simply draws cries of 'Lo the Antichrist rises' and similar nonsense. It would be changing one punchbag for another. But would it be a better means of providing a context for policy decisions?
-
scaddenp at 07:16 AM on 18 October 2013Temp record is unreliable
As I understand the question, it means the questioner expects upper atmosphere to warm. This is a misunderstanding about how the greenhouse works. In fact, the stratosphere is predicted to cool. You might like to look at SoD article on why though though there a number of other resources. However, most deniers are looking for a convenient excuse to ignore science and are unlikely to put the effort needed into understanding this.
-
Tom Curtis at 06:22 AM on 18 October 2013Temp record is unreliable
dvaytw, in response to the statement that:
"... if anyone wants to claim that CO2 levels in the upper atmosphere are causing ground level increases in temperature, there would need to be much greater warming there, which is demonstrably not happening"
I would point out that, first, "skeptics" greatly exagerate the expected amount of warming due to CO2 (and other anthropogenic factors); second, scientists have always expected that other short term factors will cause fluctuations in the increase of temperature so that, over short periods it may be much less than is expected over the long term, or even negative; and that third, a very powerfull short term factor is known to be depressing the rate of temperature decrease, and in fact accounts for nearly all of the discrepancy between the actual temperature increase and that predicted by the models.
With regard to the exageration of the expected rate of warming, this is typically done with graphs such as this one by Murry Salby:
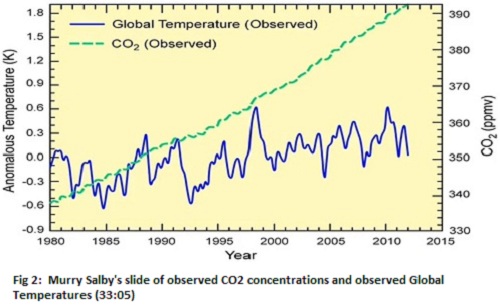
Such graphs may be created in ignorance, by simply scaling the (smoothed) CO2 and Temperature graphs to have a common standard deviation. Such a scaling ignores the fact that annual fluctations in CO2 concentration are too small to significantly effect global temperature, and so on short times variations in CO2 are not expected to match variations in temperature. As a result the scaling does not reproduced the expected temperature increase. That mismatch is exagerated if the match is done between annual (or worse, monthly) temperature variations and a smoothed CO2 curve as done above.
In some instances, however, including that of Salby, the exageration must be deliberate. That is because the same authors show graphs of the expected temperature increase as a function of CO2 concentration over the coming century. As a result, when they show the short term "prediction", they must know that they have changed the relative scales of CO2 concentration and temperature, thereby mistating the predicted increase in temperature from the increase in CO2. This can be seen by comparing the prediction at the scale used for centenial predictions with that used over the last few decades:
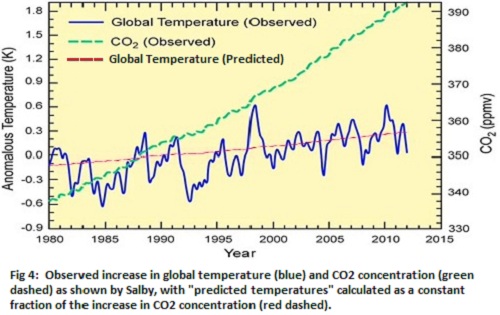
As can be seen, with an honest scaling, recent temperature increases have closely matched those predicted by the IPCC Assessement Report 4 (AR4). To avoid any misunderstanding, however, it should be clear that the "prediction" above is produced by simply using the same scale ratio between CO2 and temperature as is used in Salby's centenial comparison, and slightly understates the actual AR4 short term prediction, which was for 0.2 C per decade. Salby's graphic manipulations are discussed in more detail here.
With regard to the expected short term fluctuations, that can be seen in the temperature record up to 2005 (when the short term temperature trend met or exceeded IPCC predictions). During that period, however, there are many short term periods with zero, or slightly negative growth:

Climate scientists are not utter fools. They can read temperature graphs as easilly as anyone else; and could see, therefore, that a prediction of temperature increases without faltering (ie, monotonic increase) was already falsified, and would not be so foolish to frame their predictions in a fashion that was already falsified. The assumption that a short term low trend in temperature increase somehow falsifies AGW, however, tacitly assumes that they were such fools, for it assumes a "hiatus"not greatly different from "hiatuses" that occured before the predictions will falsify AGW.
Nor do climate scientists predict short term fluctuations merely to save appearances. In the CMIP5 model intercomparison for IPCC Assessment Report 5, using the scenario with the strongest warming (RCP 8.5), over 8% of 15 year trends with a start year of 1970 or later, and and end year of 2015 or earlier are smaller than the HadCRUT4 trend since 1998. Indeed, 4.48% are negative and there is one 15 year trend of negative 0.15 C per decade. The prediction of short term fluctuations and hiatuses comes from the models themselves. They are not ad hoc afterthougths. They do not typically show up in statements about predictions because they represent short term chaotic factors that have no influence on the long term trend. Consequently they do not coordinate in position across all models in the ensemble, and do not appear in the ensemble mean. Indeed, the lowest 15 year trend in the ensemble mean over that period is more than twice the HadCRUT4 trend since 1998; but that is because the ensemble mean has eliminated short term non-forced fluctuations while the real world has not. Climate scientists know this, indeed insist upon it. So-called "skeptics", however, blur the distinction whenever possible.
In this regard, it is worthwhile noting that the peak temperature of the 1997/98 El Nino was 0.6 C warmer than the La Nina years on either side of it (see first graph). That is the equivalent of three decades global warming. With ENSO introducing such large fluctuations into short term temperature trends, it is impossible that trends of less than thirty years should consistently show trends near to the long term trend.
Finally, there is, in fact, a known short term non-forced factor that accounts for nearly all of the discrepancy between predicted and observed short term trends. Given the comment in my last paragraph, it will come as no surprise that it is ENSO:

Very clearly, ENSO has had a strong negative influence on the temperature trend since 2006, and arguably since 1998. That ENSO is the major driver of the recent temperature "hiatus". In fact, three very clear lines of evidence demonstrate that beyone reasonable doubt IMO. They are the fact that if you only examine the trends in ENSO equivalent years, all trends are nearly the same and close to that predicted by the models; that if you adjust temperatures for known ENSO states,the result is a trend close to that predicted by the models, and finally, if you constrain a model to match the historical ENSO pattern, it reproduces the historical temperature record. I discuss these points in detail here.
It should be noted that ENSO is not the only known factor that helps explain the reduces recent trends. Tropical volcanism is known to have increased the aerosol load, a factor that should induce cooling if not for a countervailing warming trend. We are also experiencing unusually weak solar activity, which should also have the same effect. Other factors may also have influence, and scientists are examining these factors, and others to determine the relative importance of different factors. But ENSO is the main factor, without doubt. It is sufficiently strong a factor that, if CO2 forcing did not have a significant warming effect, we should be experiencing a significantly negative short term trend in global temperatures, not the weakly positive trend we are currently experiencing.
-
Rob Nicholls at 04:30 AM on 18 October 2013Time to change how the IPCC reports?
Is frequency of IPCC reports really the issue? How much have things really changed between AR4 and AR5? I've never had a sense that AR4 was very out of date or very far off the mark in the last few years. One of the things that I like about IPCC Assessment reports is that they're done properly. I've never read such an awesome synthesis of a complex subject anywhere else. I wouldn't mind seeing them done more often if they're going to be as good quality.
More importantly, humanity ought to fund the IPCC properly, particularly if the IPCC is going to start producing more products, in more innovative ways (and, if needed, more often). I find it incredible that IPCC ARs, which are of such massive importance to the future well-being of our species (and many others) are written largely through voluntary efforts of already very busy scientists (although certain commentators will have us believe that climate science is just one big gravy train, I've never noticed science as being a particularly lucrative career, and I can imagine that the overall hourly rate is rather low, especially for those hundreds of experts who selflessly give up their time to work on IPCC assessment reports.)
The IPCC could really help us prevent a whole of trouble in the future, so it ought to be much better funded.
-
jja at 03:52 AM on 18 October 2013Time to change how the IPCC reports?
You absolutely need to update AR5 figures 6.25 and 6.27.
6.25 -Compatible fossil fuel emissions simulated by the CMIP5 ESM models for the 4 RCP scenarios
This figure needs to be updated to show a 2-sigma uncertainty. A 68.2% uncertainty band is doing us all an incredible disservice.
6.27 -Compatible fossil fuel emissions for the RCP4.5 scenario (with and without carbon cycle feedbacks)This figure needs to be updated to show 2-sigma uncertainty as well as RCP 8.5 scenarios.
I understand why a 2-sigma uncertainty wasn't shown, because of the fat tails of carbon cycle feedbacks and equilibrium climate sensitivity uncertainties.
The risk associated with the potential for a 2-sigma error are so great, it is vital that these uncdetainties are reflected in the AR5, even if the authority of the report may seem diminished. This is a scientific exercise, not a political one.
in other words. would you propose that the designer of a nuclear power plant only use a 1-sigma uncertainty for the integrity of the reactor pressure vessel, so that her calculations appear to be very precise and authorative? NO, of course you wouldn't.
well, the RCP 8.5 ECS and climate cycle feedback uncertainties directly affect potential mitigation solutions. If we don't take that into account then our hopes to adequately address them will fail. With results that are many orders of magnitude worse than a total nuclear power plant meltdown.Moderator Response:[JH] Is your request directed to the IPCC or SkS?
-
Dikran Marsupial at 02:36 AM on 18 October 2013CO2 lags temperature
dvaytw, you would need to be a bit more specific about which events you have in mind. keysersoze's comment at 70 was pretty vague, but I suspect he meant the Paleocene-Eocene Thermal Maximum (PETM), in which case the recovery wasn't nearly as rapid as he suggests, according to Wikipedia (yes, I know) the Earth cooled again over a period of 120,000 years which is not at all brief in relation to the 800 year lag time in the question. A timespan of 120,000 years is a bit brief to be fully explained by weathering, but not by a huge amount.
The other problem with keysersozes question is that the existence of feedback does not necessarily mean that there is runaway feedback. In the case of the carbon cycle, equilibrium temperatures rise only logarithmically with rising CO2 (which is slow), but the rate at which the oceans degass goes up linearly with temperature, so immediately there is a case of diminishing returns. Also the solubility of CO2 in the oceans increases with increasing atmospheric concentrations, which makes it progressively more difficult for CO2 levels to rise substantially naturally (other than due to volcanos or methane releases etc.). The positive and negative feedbacks involved keep the carbon cycle quite well balanced unless perturbed by some external forcing. These positive and negative feedbacks tend to bring the carbon cycle back into line automatically if left alone.
-
dvaytw at 01:57 AM on 18 October 2013CO2 lags temperature
Back at #70, the moderator said:
Response: Good question - I considered addressing this in the original article above but opted to keep things simple and address it in a future post. In the case of Milankovitch cycles, just as orbit changes initiate the warming, they also end the warming. Towards the end of the deglaciation, orbit changes cause the amount of June sunlight falling on the northern land masses to change by several tens of percent (not an insignificant change). Gradually over time, northern ice sheets start to grow again.
For greater time scales (eg - over millions of years), rock weathering is another factor that keeps the climate regulated. Rock weathering is the phenomenon where CO2 is scrubbed out of the atmosphere by chemical reactions with rock surfaces. As temperatures warm, the rate of rock weathering increases - this acts as a natural thermostat to keep CO2 levels from getting too high. However, this process occurs over millions of years so don't expect rock weathering to bail us out of our current situation (although interestingly, there is research into using artificially accelerated weathering as a technique in sequestering CO2).
I'm wondering if there have been any follow-up articles on the topic of what brought our climate back out of Greenhouse Earth periods. I haven't read through the entire comments section yet, so sorry if this has already been addressed.
Moderator Response:[JH] You may also want to try using the SkS search engine to identify articles that address your topic of concern.
Prev 815 816 817 818 819 820 821 822 823 824 825 826 827 828 829 830 Next


