


 Arguments


Recent Comments
Prev 829 830 831 832 833 834 835 836 837 838 839 840 841 842 843 844 Next
Comments 41801 to 41850:
-
Dikran Marsupial at 00:55 AM on 3 October 2013IPCC model global warming projections have done much better than you think
Tom Curtis - A five year baseline period? That is quite, err... unusually short!
To be fair, there are those that like to use an even shorter baseline ;o)

Same idea though (click on the graph for a debunking).
-
Tom Curtis at 00:12 AM on 3 October 2013IPCC model global warming projections have done much better than you think
John Oh @51, looking at Christy's graph, as reproduced by Spencer shows that the observed record lies below the multi-model mean not just in the recent, so-called "hiatus" years, but over the whole record. The apparent disagreement, therefore, consists entirely in Christy using a low baseline to creat a visual appearance of disagreement, where little disagreement actually exists.
Having said that, it is interesting to see how he accomplishes this legerdemaine. The graph indicates that it indicates "departure from the 1979-83 average". That means that for both observational series, and for the multi-model mean, the average over the period 1979-83 equals zero. Despite that, there is already a marked discrepancy between observations and multi-model mean in that period. Specifically, for most years the obeservations are below the multi-model mean, but in 1983 they are well above it. Indeed, because the average over that interval is set to zero, because the observations are well above the multi-model mean in 1983, the other years need to be below the mean to achieve the same average over that period.
1983, of course, was an unusual year. Specifically, it was unusual because of the significant volcanic eruption the year before (El Chichon), which as a forcing shows up in the multi-model mean as a dip in temperatures. It was also unusual for possibly the strongest El Nino on record, with an SOI reading of -33.3 in Feb, 1983 (compared to the -28.5 in March 1998 for the more famous 97/98 El Nino). Unlike volcanic forcings, however, El Nino warmings do not show up in the models - or at least, they do not show up in the models on the same year for all models, with the result that in the multimodel mean they are cancelled out.
So, Christy has forced a low baseline for the observational records by including in the baseline period a known, very large warming perturbation which he knows to be reflected in the observations, but which cannot be reflected in the models. To ensure that this lowers the baseline sufficiently, he then makes the baseline as short as possible to ensure the effects of the 1983 El Nino in distorting the graph are not diluted (as they would have been had he used a more appropriate 1970-2000 baseline).
And to top it all of, knowing the so-called "hiatus" is predominantly a consequence of recent ENSO variations, he has chosen a data set which shows a heightened ENSO effect relative to the surface temperature record. I assume he has done this because an honest comparison would be too damaging to his case.
-
empirical_bayes at 00:02 AM on 3 October 2013Why is the IPCC AR5 so much more confident in human-caused global warming?
I also think some assessments, while they may be well-meaning, fall into a trap of statistical methodology. In particular, surface temperature profiles from, say, HadCRUT4, express a single realization of surface temperature development on Earth. It's highly probable that even if the entire system were magically reinitialized to the state it was in 1980, with exactly the same GHG forcings and solar radiation vs time, it would track a different path of temperature. What we observe is but one realization.
Now, you can try to assess the so-called "internal variability" by looking at ensembles of temperature subsets, appropriately adjusted for serial dependency, but classical ("frequentist") techniques will never produce temperatures outside of the observed range. This is also true of climate models, e.g., 37 models from CMIP5.
What's needed is a Bayesian extension of both data sets, perhaps using predictive posteriors and weak priors, or priors initialized with paleoclimate results. (I'm thinking of Geisser and Eddy, 1979, "A predictive approach to model selection", http://dx.doi.org/10.1080/01621459.1979.10481632, or the paper on the same subject by Gelfand in the compendium, Gilks, et al, Markov Chain Monte Carlo in Practice.)
Facts are, and to use a very rough analogy, if you try to estimate the proportions of differing colored balls in an urn by sampling, knowing the possible colors but not knowing how many balls there are in the urn, a frequentist assignment will give you zero as the proportion for any colors you have not observed. A Bayesian assessment assigns some non-zero probability to colors which have not been observed, so after the data, they have some proportion, possibly small. Temperatures which have not been observed are not impossible and, to the degree to which models try to minimize error against all possible futures, they go for that, not a specific path.
There are also problems with trying to estimate magnitude of "internal variability" without taking such an approach, but the analysis is more involved there, and includes serious questions of identifiability without making unrealistic assumptions. More on that some other time.
I have not done the calculation so cannot assert, but I have done toy problems that are pretty analogous, and what happens is that there is a much greater overlap between the range of possible temperatures HadCRUT4 and others suggest and CMIP5 and others, and, so, assertions of incompatibility stand on less evidence than other kinds of analyses indicate.
-
IPCC model global warming projections have done much better than you think
John Oh - What "exaggeration" are you referring to? Are you making a claim that IPCC data is in error, and if so on what grounds?
As I noted on that Spencer thread, satellite temperatures have their own issues, many of which are not acknowledged by the collectors of that data. From “Temperature Trends in the Lower Atmosphere – Steps for Understanding and Reconciling Differences” 2006, authored in part by the very John Christy who supplied the data in your linked blog post:
“On decadal and longer time scales, however, while almost all model simulations show greater warming aloft (reflecting the same physical processes that operate on the monthly and annual time scales), most observations show greater warming at the surface.
These results could arise either because “real world” amplification effects on short and long time scales are controlled by different physical mechanisms, and models fail to capture such behavior; or because non-climatic influences remaining in some or all of the observed tropospheric data sets lead to biased long-term trends; or a combination of these factors. The new evidence in this Report favors the second explanation.”
[Emphasis added]
Radiosonde data (intended for short-term weather analysis, not climate studies) has consistency/calibration issues, and the quite complex satellite data analysis has been repeated updated due to various errors.
-
John Oh at 23:06 PM on 2 October 2013IPCC model global warming projections have done much better than you think
http://www.drroyspencer.com/2013/04/global-warming-slowdown-the-view-from-space/ < see link.
The satelite figures differ with IPCC numbers, and show steady, historic increases in temperature. The exagerated numbers again come from the IPCC. So can this be explained or is this also IPCC figures that are being misrepresented?
-
Dikran Marsupial at 19:27 PM on 2 October 2013IPCC model global warming projections have done much better than you think
engineer wrote "I think I'm being misunderstood.". The reason that I suggested that you dial back the tone of the discussion is that quite often it is difficult for individuals to know if they are being misunderstood or whether they themselves misunderstand something. This is a classic example as in my post I explained the difference between a projection and a prediction, but in your reply you ignored this point and return to "but if a model disagrees with nature then there is something wrong with the model. And that applies to any model.". The distinction between a prediction and a projection is very important in this situation because the reason for the disagreement may be because the scenario (the X) is not a sufficiently accurate representation of reality, and that needs to be taken into account.
If you think that someone is using a subtle distinction between words to evade a point, then the onus is on you to do your best to understand the distinction when it is explained to you, rather than just ignore it, which leads the discussion to becoming ill tempered.
I am a big fan of Hanlon's razor ("never attribute to malice that which can be adequately explained by thoughtlessness/stupidity"), which I generalise to "always try to view the intentions of others in the best light that is consistent with the observations". So rather than assume that someone is being evasive, assume there is some subtle point that you don't understand and help them to explain it to you.
-
Drewd006 at 18:54 PM on 2 October 2013Dueling Scientists in The Oregonian, Settled by Nuccitelli et al. (2012)
I have come across this blogger who is claiming: "The oceans are cooling just like the air is, as proven by the measurements of the 3,000 Argo buoys; the oceans are cooling at all measured levels, and have been since the buoys were launched"
I cited: Levitus et al. 2012, Lyman et al. 2010, Von Schuckmann et al. 2009, Trenberth 2010, Purkey & Johnson 2010, and Trenberth & Fasullo 2010.
And he response saying:"NOAA have just used Levitus's paper, we can forget them as they simply estimated the OHC using a model; there were no measurements (only ARGO after 2003).
Lyman et al's paper has been debunked by R. S. Knox and D. H. Douglass and by NODC OHC data.
Trenberth 2010; HAHA! This is the guy who said; "“The fact is that we can’t account for the lack of warming at the moment and it is a travesty that we can’t.”
HE is debunked by FOUR other papers; Willis, and Loehle, and Pielke, and Von Schuckmann."
Are there any validity to this mans claims, if he is misrepresenting the science I would love to know.
Thank You -
rkrolph at 16:05 PM on 2 October 2013IPCC model global warming projections have done much better than you think
On the chart above titled "Global Average Surface Temperature Change" there isn't a clear distinction between RCP8.5 and RCP2.6 until around 2060, which means we could still be arguing for about 45 more years whether the climate is changing per a low emissions or a high emissions scenario, based on model projections. So it seems to me that arguing about exactly how accurate the models are shouldn't be the point to get caught up on.
-
DSL at 14:02 PM on 2 October 2013IPCC model global warming projections have done much better than you think
I stand corrected. Thanks Mammal_E, and I agree that a post would be a nice thing, though the comment is surely at least halfway there.
-
scaddenp at 13:28 PM on 2 October 2013Models are unreliable
You would also need to separate out the other forcings at play if trying to establish k by simple fits. I would recommend Chpter 10 of the newly out AR5 WG1 which has a section on estimation of TCS and ECS, along with references to the papers which attempt this from various observational sets. The section of estimation from the instrumental record looks like it would interest you most.
-
WheelsOC at 13:00 PM on 2 October 2013IPCC model global warming projections have done much better than you think
In fact, mousing over the underlined word "projection" anywhere on this page brings up a cogent explanation in the upper right of the screen.
-
mikeh1 at 12:42 PM on 2 October 2013IPCC model global warming projections have done much better than you think
There is a discussion of statistical language at the Australian Bureau of Statistics web site which compares the terms projection and forecast. This may help Engineer get over his apparent belief that the distinction was invented by climate modellers.
"A projection is not making a prediction or forecast about what is going to happen, it is indicating what would happen if the assumptions which underpin the projection actually occur."
-
Bob Loblaw at 10:37 AM on 2 October 2013IPCC model global warming projections have done much better than you think
engineer: "the terms are interchangable"
No, they are not. If you have a model that states a + b = 12, a projection is saying "if a = 4, then my model says b = 8". An observation that b=14 is not a falsification of the model, if a<>4. A prediction would be to say that a will = 4, and b will = 8.
A series of projections might cover a range of values of a, stating what the model says b will be for each value of a. In modeling terms, this is call a sensitivity analysis - seeing how a change in an input parameter affects an output value, or how sensitive b is to changes in a. If you want to talk about the probability distribution function of output values (e.g., there is a 95% chance of an outcome in range X), then you also need to look at the probability distribution of the input parameters. You can't just take N runs of unknown input distribution and assume that it fits your expectations. At least, not if you are doing good science.
-
engineer8516 at 09:37 AM on 2 October 2013IPCC model global warming projections have done much better than you think
@Rob, ok, I think understand what you're saying, but why is this distinction between prediction and projection even necessary? the terms are interchangable. Adding a distinction seems like adding confusion for no reason.. "This is why climate modelers don't make predictions; they make projections, which say in scenario 'x', the climate will change in 'y' fashion." when I read it the first time it seemed like a dodge to the standard of falsifiability. Apparently, I'm the only one that thought that.
-
scaddenp at 09:37 AM on 2 October 2013Models are unreliable
But you would only expect temperature rise to be linear if transient climate sensitivity was same as equilibrium climate sensitivity. Emperical determinations of ECS suggest it is reasonably robust over quite a temperature range. However this is an observation, not an assumption.
-
scaddenp at 09:34 AM on 2 October 2013IPCC model global warming projections have done much better than you think
I think it would also be helpful to say climate models say IF you get this forcing, THEN you get this result. They do not however predict what the forcings will be.
Climate models also make no pretense at having any skill at decadal-level surface temperature trends, only on climate trends where most certainly the models can be tested.
-
Rob Honeycutt at 09:18 AM on 2 October 2013IPCC model global warming projections have done much better than you think
Engineer @41... But this is exactly the same thing as what Dana is stating, just using different words.
"Prediction" would be saying stating what the temps will do, which seems to be the view most "skeptics" seem to take toward models. Modelers don't do that. They, 1) make a variety of "projections" based on different emissions scenarios, and 2) the projections say that surface temps will likely run in the bounds of the model runs.
None of that suggests anything about the falsifiability of the projections.
-
engineer8516 at 09:03 AM on 2 October 2013IPCC model global warming projections have done much better than you think
@Rob, "What is expected is that surface temps will continue in the general direction of the mean but stay within the bounds of the model runs." I completely agree.
My point of contention was this statement: "This is why climate modelers don't make predictions; they make projections, which say in scenario 'x', the climate will change in 'y' fashion.", which in my opinion (-sloganeering snipped-).
Moderator Response:[DB] Your opinion has been voiced before, and addressed by multiple parties. To then repeat said opinion without the added value of new information based in the science is pointless sloganeering. Such sloganeering is a waste of everyone's time here, which is why the practice is listed as banned by this site's Comments Policy.
[JH] Plus, it's a violation of the prohibition against excessive repetition.
-
Leto at 08:55 AM on 2 October 2013IPCC model global warming projections have done much better than you think
"Being on the high side 114 out of 117 times is indicative of a bias."
"if a model disagrees with nature then there is something wrong with the model."
"You're dealing with probability which is dependent on the sample size and a sample size of 1 is insufficient. However, if your math dictates that you should get a 10 of clubs 5% of the time but you do the experiment and draw 10 of clubs 20 times in a row off the bat, a probability that amounts to 0.05^20 = 9 * 10^-25 %...then it's probably time to revisit your model. But the key here is that the model is still ultimately judged by nature, which is how it's supposed to be."
engineer,
Some contrarians have implied that a single result at odds with a model falsifies the model, which is obviously wrong - like blaming a card-strategy program for not picking a single deal correctly. Your statements are more sophisticated and imply that the situation is instead one of repeated bias, predicting the 10 of clubs 5% of the time but instead getting it 20 times in a row. This card analogy breaks down, though, because there have not been 20 independent runs of the real-world climate. There have not been 117 runs either.
If the climate models made predictions about 117 independent runs of the real-world climate, and temperature estimates were high 114 times, then yes, the models would be wrong. That is not what has happened, though. We have had a single real-world "deal", which has produced surface temperatures within the predicted range. You can observe that process 117 times, or 117000 times, and it does not mean that the model has been falsified unless you choose time points that are truly independent. It is like watching a single bridge hand being played out, noting the progress of the hand 117 times, then saying the card-strategy being played was wrong because it had been tested 117 times and found wanting.
Not only that, as soon as we start to consider the factors that account for the variability (volcanoes, el ninos, etc), we see that the models are basically accurate, and the variables that were part of the unpredictable "shuffle-and-deal" are affecting global surface temperature in agreement with the models.
The ensemble mean does not represent any single model run very well - a fact well known to the modelers, but easily misunderstood by those predisposed to misunderstand. Personally, I think it would be useful if the models gave predicted intervals for "el nino years", "la nina years", and so on. Then we would see that, for the actual "cards dealt", the models have performed well.
-
Albatross at 08:45 AM on 2 October 2013IPCC model global warming projections have done much better than you think
Hi Mel @36,
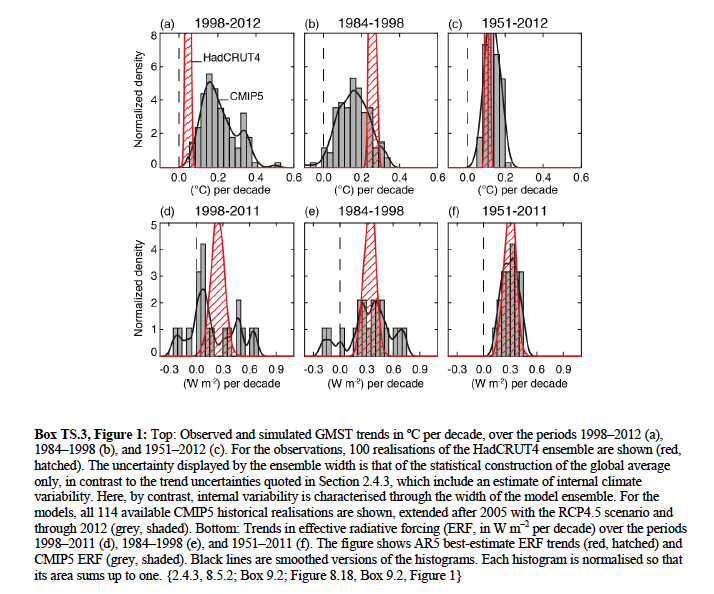
We at SkS are aware of the paper by Fyfe et al.. If you look at their figures and TS.3 Fig. 1 from AR5 that posted above, you will see that the AR5 figure was probably generated by one of the authors of Fyfe et al..
These short-term descrepancies are of little or no consequence for policy makers-- they are concerned with the long-term projections (which have thus far been very accurate). Importantly, Fyfe et al. also acknowledge that in the long-term the models have been almost spot on in predicting the amount of warming (see their Fig. 2).Studies such as the one by Fyfe et al. are of academic interest and for improving our understanding about the climate system's (and models') intricacies. Fyfe et al. looked at the 1993 through 2012 interval when the models were running cooler than the observations. Here is a science brief on Fyfe et al. that is easier to digest.
Ask yourself this Mel, why are the contrarians making all the fuss about the 1993-2012 window, but are completely silent about the 1984-1998 window when the models were running too cool?
I suspect that you know the answer, it has to do with confirmation bias and fake skepticism. -
Albatross at 08:33 AM on 2 October 2013IPCC model global warming projections have done much better than you think
Everyone,
Please, comments such as
"Let me ask you this, if a particle is discovered that can travel faster than the speed of light, is Relativity Theory wrong?"
are really not helpful. Debating "what ifs" does not address the subject at hand. If one wishes to play that game, then one should also entertain the distinct possibility that temperatures could rise a lot more than theory suggests.
The contrarians here have had the fact that the tempeature observations lie within the uncertainty bounds of the simulations explained to them several times now. Several figures showing the agreement between the models given the bounds of uncertainty have been offered. It has been explained to that no model is perfect-- yet that they insist on using trying to using this to make a straw man argument. Funny too how for contrarians the uncertainty is always biased to the low side.
This sort of behaviour is all too typical of contrarians. No amount of data, facts or explaining will change their "opinion", their "feeling" or their "belief".
While we fiddle, the energy imbalance arising because higher CO2 levels (from human activities) is adding the energy equivalent of four Hiroshima A-bombs a second to the planet's climate system.
-
Rob Honeycutt at 08:23 AM on 2 October 2013IPCC model global warming projections have done much better than you think
engineer @34... If the surface temps fall off the model mean, that does not suggest the models have a problem. That's what everyone here is trying to convey. What is expected is that surface temps will continue in the general direction of the mean but stay within the bounds of the model runs.
If surface temps started to track outside of the range of the model runs, then that would be an indication something was not being accounted for. But the whole point of the article here is, this is not what's happening. Surface temps are well within the bounds of where the models project they will be.
-
Mel at 07:58 AM on 2 October 2013IPCC model global warming projections have done much better than you think
Nature Climate Change recently published a paper entitled ‘Overestimated global warming over the past 20 years’ by Fyfe, Gillett and Zwiers. The paper compares CMIP5 results with observations and the general conclusion is pretty much summed up in the title. Could SkS please comment on these findings in relation to the discussion here.
I suspect this paper will be used to challenge the utility of climate models in general.
-
Kevin C at 07:54 AM on 2 October 2013IPCC model global warming projections have done much better than you think
Anyone played contract bridge?
So as declarer, I look at my hand and dummy and see that whether we make the contract or not depends on a finess, which depends on the card split in the opponent's hands. And on the basis of the statistics of the split I calculate that I've got an 80% chance of making the contract.
We play it out, and go down on a bad split. Was my calculation wrong? No, it was exactly right. I just got the 20% split. If we were to play the hand 100 times with all the known cards in the same places and the rest distributed randomly, we'd make the contract around 80 times.
Someone else will have to reframe that for poker or blackjack players.
So, climate.
Thought experiment: Imagine a system with a linear component which is varying slowly, and a large chaotic signal overlayed on the top. We can model the physics of the system. But when we run the real system the result we get will contain the linear component, plus a random realisation of the chaos. If we run the real system many times, we can average out the chaotic component and just see the linear part. But if we can only run the system once, we're stuck with that one run.
Suppose we have a perfect model. We run it once, and it also produces the linear response with the chaotic signal on top. We can run it lots of times and average, and we'll see just the linear signal. But that doesn't look like the real run, because the real run has the chaotic part too.
But neither do any of the individual runs of the perfect model look like the real run, because the chaotic component is different.
So even with a perfect model, we can't reproduce the real run either with an individual model run or with an ensemble of model runs. And yet that's with a perfect model, a model which is right.
That's exactly the problem we're facing here. Because weather (or more generally the internal variability) is chaotic.
-
engineer8516 at 07:48 AM on 2 October 2013IPCC model global warming projections have done much better than you think
@ Mammal_E
You're dealing with probability which is dependent on the sample size and a sample size of 1 is insufficient. However, if your math dictates that you should get a 10 of clubs 5% of the time but you do the experiment and draw 10 of clubs 20 times in a row off the bat, a probability that amounts to 0.05^20 = 9 * 10^-25 %...then it's probably time to revisit your model. But the key here is that the model is still ultimately judged by nature, which is how it's supposed to be.
It seems you disagree with my statement "if a model disagrees with nature then there is something wrong with the model." Let me ask you this, if a particle is discovered that can travel faster than the speed of light, is Relativity Theory wrong?
-
Mammal_E at 07:11 AM on 2 October 2013IPCC model global warming projections have done much better than you think
@Rob Honeycutt -- you interpret my comments correctly. I'll see if I can gin up something that is brief and clear. I see this issue a lot with people misinterpreting population simulations, e.g., projecting the fate of endangered species.
-
Rob Honeycutt at 07:03 AM on 2 October 2013IPCC model global warming projections have done much better than you think
Also, if I'm interpreting your comments correctly, you're saying what I was saying (albeit more precisely than me) about climate modeling being a boundary conditions problem. I'm equating boundary conditions to your statements about prediction intervals.
-
Rob Honeycutt at 07:00 AM on 2 October 2013IPCC model global warming projections have done much better than you think
I agree with Tom. Mammal_E, you're providing great insight into what are pretty common misinterpretations of what climate modeling is about.
-
Tom Dayton at 06:42 AM on 2 October 2013IPCC model global warming projections have done much better than you think
Mammal_E, I think it would be great for you to write a post expanding your explanation of prediction interval versus confidence interval, if it includes some graphs.
-
Mammal_E at 06:28 AM on 2 October 2013IPCC model global warming projections have done much better than you think
engineer --
"if a model disagrees with nature then there is something wrong with the model."
Let's say I have a model that simulates the outcome of process of drawing cards from a shuffled deck. I run the model once, and it generates a 3 of diamonds. I have an actual shuffled deck, and draw a 10 of clubs. The model and reality disagree. Is that sufficient information to conclude that something is wrong with the model?
-
Mammal_E at 06:24 AM on 2 October 2013IPCC model global warming projections have done much better than you think
franklefkin --
@19: Who specified that it had to be 90%?
@26: I think there may some confusion in terminology here. The range containing 95% of model realizations (from the 2.5th percentile to the 97.5th percentile, not -- as you might be thinking -- from the 0th to 95th percentile) corresponds to what is properly called a 95% prediction interval, not a confidence interval. Confidence intervals reflect uncertainty in estimated parameters (e.g., population mean), whereas prediction intervals denote uncertainty in individual observations (e.g., a single sample from the population). Since the behavior of the Earth system only happens once in reality, it should be compared with a model's (or group of related models) prediction interval.
The big difference is that a confidence interval always shrinks with more higher sample sizes (e.g., the estimate of the mean becomes less uncertain), but the prediction interval does not (although the interval boundaries do become more precise with higher sample sizes). Running more model runs will tighten up the confidence interval around the ensemble mean, but will not generally tighten up the prediction interval.If intervals are based on decent sample sizes, a very large fraction of observations will fall outside the confidence interval (for the mean) but within the prediction interval (for observations).
-
engineer8516 at 06:13 AM on 2 October 2013IPCC model global warming projections have done much better than you think
"Please dial the tone back a bit and try to see the value in the contents of the posts to which you are replying, rather than merely trying to refute them."
I think I'm being misunderstood. My comment was just directed at the statement, "This is why climate modelers don't make predictions; they make projections, which say in scenario 'x', the climate will change in 'y' fashion." I was commenting on a statement that looked like it was arguing differences in the definition of words as a way to gloss over inaccuracies in a model's predictions. I don't want to get into a philosophical discussion, but if a model disagrees with nature then there is something wrong with the model. And that applies to any model.
-
franklefkin at 05:35 AM on 2 October 2013IPCC model global warming projections have done much better than you think
DSL @21,
The link you have is to a REAL Climate graph that shows 95% of model runs. It is not a 5 - 95% confidence graph. There is a difference.
-
engineer8516 at 05:29 AM on 2 October 2013Models are unreliable
@ Scaddenp,
Of course, but I thought climate sensitivity can be considered constant for small changes in temp. ∆T = k * 5.35*ln (C/C0), where k is climate sensitivity. I graphed 5.35*ln(C/C0) and it looks approximately linear in the range for C: (275 ppm, 550 ppm) and C0=275ppm. Is climate sensitivity not supposed to be considered constant even for small changes in temp?Thanks.
-
Mammal_E at 05:19 AM on 2 October 2013IPCC model global warming projections have done much better than you think
Engineer -- The models of probability allow us to accurately calculate the chances of a blackjack player winning given a certain dealt hand and dealer card showing, given a particular playing strategy. Averaged over many random hands, this gives the long-run payoff of that strategy, as well as upper and lower bounds on what the player can expect to experience over a given number of hands. However, the models cannot predict WHICH cards will be dealt nor whether the player will win any given hand. Does that mean that the models are wrong or inaccurate, or unfalsifiable? No! It's just that shuffling the deck produces randomness that no model can possibly predict, and predicting what specific cards will be dealt is not the purpose of the model in the first place. Players that employ strategies that such models identify as having the highest payoff will, in the long run, do better than players using other strategies, even though they may will experience runs of losses and other players may will experience runs of wins.
A chaotic natural oscillation such as ENSO acts like a shuffling mechanism, preventing short-term prediction of particular years' conditions (without advance knowledge of ENSO behavior, volcanic eruptions, etc.), but allowing projections about the long-term trend as well as conditional predictions (e.g., if 2014 has a strong El Nino influence, mean surface temp is predicted to be higher than otherwise, given no volcanic eruption). The truly impressive accuracy of recent model hindcasts that are constrained to reproduce past ENSO behavior (which are analogous to predicting the winner of blackjack hands after you know the dealt and showing cards) point to the conditional accuracy of the models and lend confidence to their skill, despite their inability to predict short term randomness.
-
DSL at 05:06 AM on 2 October 2013IPCC model global warming projections have done much better than you think
Engineer, a prediction is understood to be a single best estimate. Climate models don't produce single predictions. You can average all model runs and get the ensemble mean, but the line will not be representative of the science. The variables involved have high-likelihood ranges based on existing research. The result is a projected outcome range, not a single line of prediction. A single line of prediction would be absurd given the complexity of the system.
-
Dikran Marsupial at 05:01 AM on 2 October 2013IPCC model global warming projections have done much better than you think
Engineer, you are missing the point "IF X, then Y", notice the "IF". That is the difference between a prediction and a projection, the accuracy of the Y is contingent on the accuracy of the scenario X. Please dial the tone back a bit and try to see the value in the contents of the posts to which you are replying, rather than merely trying to refute them. Projections fit Poppers prescription for what is and what isn't science perfectly well (please let's not get into a discussion of philosophy of science, we have all been there done that, and oddly enough the scientists that make the projections are quite familiar with it).
-
engineer8516 at 04:54 AM on 2 October 2013IPCC model global warming projections have done much better than you think
"This is why climate modelers don't make predictions; they make projections, which say in scenario 'x', the climate will change in 'y' fashion."
Wait what? It doesn't matter what you call it, predictions or projections. The fact is that scientific models are supposed to accurately predict natural phenomenon: as you stated given x, the outcome will be y. Besides, if a model doesn't make predictions then it's not scientific because it's not falsifiable.
-
DSL at 04:40 AM on 2 October 2013IPCC model global warming projections have done much better than you think
Frank, I'll re-post the link I included in the last post: link (hint: click on it). CMIP3, GISS (better coverage), 95%.
-
IPCC model global warming projections have done much better than you think
franklefkin - I would suggest you look at the draft report itself, where Figure 1.4 is clearly labeled:
For the AR4 results are presented as single model runs of the CMIP3 ensemble for the historical period from 1950 to 2000 (light grey lines) and for three scenarios (A2, A1B and B1) from 2001 to 2035. (emphasis added)
-
franklefkin at 04:13 AM on 2 October 2013IPCC model global warming projections have done much better than you think
DSL,
Its a 90% confidence range, and it depends on the data source for the observations.
separate question, CMIP3or5?
-
DSL at 03:26 AM on 2 October 2013IPCC model global warming projections have done much better than you think
Franklefkin: "The message is, no they haven't done better than I think!"
Frank, is observed GMST still within the 95% confidence range of the CMIP3 ensemble? Yes or no?
-
John Hartz at 03:16 AM on 2 October 2013IPCC model global warming projections have done much better than you think
Memo to deniers:
Your attempts to argue that the accuracy of GCMs undermines the entire body of scientific evidence about climate change is a "Dog that won't hunt!"
-
Albatross at 03:01 AM on 2 October 2013IPCC model global warming projections have done much better than you think
Franklefkin @14,
Don't believe everything that you think.
-
Albatross at 02:59 AM on 2 October 2013IPCC model global warming projections have done much better than you think
As expected the fake skeptics are now trying to undermine the models by suggesting that they are a cornerstone of climate science (they recycle this myth frequently). Climate science and theoretical models of how much warming will result from a doubling of CO2 (an arbitrary value, because we will far exceed a doubling of CO2 if fake skeptics get their way) have existed long before the first comuter climate models.
The obvious caveat is, of course, that no model is perfect. Yet models are valuable tools for not only objectively quantifying future climate states, but also for learning more about the workings of our climate system.
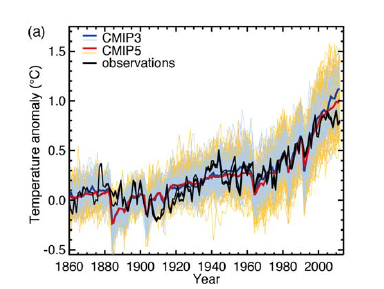
The figure below is from the fifth assessment (AR5) report (Fig. TS.9a). As a similar figure above shown by Dana (also from AR5) the models so an uncanny job of simulating the variability of the climate system, but only when one includes anthropogenic forcings in addition to natural forcings.
The other mistake that fake skeptics make is that they insist on comparing temperature trends (or sea-ice trends or ocean heat content trends) over periods of time that are way too short to have any statistical significance or meaning. They do this in a desperate attempt to undermine the models' credibility. However, it is well established that one of the areas that climate models are not good at is replicating the marked interannual variability because of ENSO, aerosols etc, or short-term variability (~<10 years). So they are making a straw man argument.
To illustrate, the Figure below (Box TS.3, Fig.1 from AR5) shows that between 1984 and 1998 the models as a whole were running to cool. In contrast, between 1998 and 2012 the models as a whole have been running too warm. But when one considers a longer period of time (say 1951 though 2012) or even 1979 through 2012 (as one should do), the models do a remarkably good job when compared with observations. The goal here is the long term outlook on a centennial scale.
That clearly indicates that the models are much better than fake skeptics would try and trick people into believeing.
-
franklefkin at 02:56 AM on 2 October 2013IPCC model global warming projections have done much better than you think
DSL,
So what message are you fishing for?
The article is titled "
IPCC model global warming projections have done much better than you think
"
The message is, no they haven't done better than I think!
-
Rob Honeycutt at 02:56 AM on 2 October 2013IPCC model global warming projections have done much better than you think
What I keep asking people who castigate the models is if they're expecting surface temps to follow the model mean. If so, then they're missing something very fundamental about climate modeling.
Models are never going to be able to predict short term surface temperature trends. That's just a fact. You have to get it into your head that climate modeling is a "boundary conditions problem." It's not about predicting the short term trend. Climate modeling is about estimating the boundaries we expect surface temps to fall for given forcing scenarios.
-
DSL at 02:40 AM on 2 October 2013IPCC model global warming projections have done much better than you think
franklefkin, we can play with short-term trends all day long. What's the trend for 1974-2008? 0.192C per decade, just about where it's expected. The trend from 2008 to present is flat. So what? There are at least three similar periods between 1974 and 2008. Didn't matter much for the overall trend, did it?
It seems like you're digging for approval for a specific message rather than trying to get a better understanding of the science. A period of flatness in the surface trend means what, exactly? Global warming has stopped? Not in the slightest. Global energy storage continues as projected.
So what message are you fishing for? General circulation models suck at projecting short-term GMST trends? Duh. General circulation models suck at projecting long-term GMST trend? Show me. Given everywhere the long-term trend could have reasonably gone (setting aside physics), CMIP3/5 modeling has done a remarkable job of confirming the strength of human-induced warming.
What do you think will happen when the next El Nino pops? We just had the warmest ENSO-neutral June on record. August was close. September, if the dailies are any indication, is going to set a record for ENSO-netural conditions. Ocean heat content has put the pedal to the metal in the last six months. PDO is also negative and has been since 2008. Solar, despite climbing toward the cycle peak, is also weak and has been for the last six years.
Yah, natural variation is putting a damper on things. No reason to rejoice, though. And certainly no basis for claiming that "global warming has stopped" or even paused. Surface warming has been weak since 2008.
-
franklefkin at 01:39 AM on 2 October 2013IPCC model global warming projections have done much better than you think
Tom C & Dana1981,
So, right now surface temps are lower than predicted a few years ago. So if we compare in another 15 years, predictions from say 2003, you are saying that those predictions should be lowered because actual temps are lower now. <-snip-> The predictions are what they are. Consider what was said in the AR4:
"
Since IPCC’s fi rst report in 1990, assessed projections
have suggested global average temperature increases
between about 0.15°C and 0.3°C per decade for 1990 to
2005. This can now be compared with observed values
of about 0.2°C per decade, strengthening confi dence in
near-term projections. {1.2, 3.2}
"
(from AR4 SPM pg 12)
In the Article above, DANA1981 quotes a fiqure of
"within the range of model projections of about 0.10 to 0.35°C per decade. As the IPCC notes,"
The AR4 report clearly states that the lower end is 0.15 per decade. Regardless of where the baseline occurs, observations are at the very lower limit of predictions.
The report goes on to state "
Best-estimate projections from models indicate
that decadal average warming over each inhabited
continent by 2030 is insensitive to the choice among
SRES scenarios and is very likely to be at least twice
as large as the corresponding model-estimated natural
variability during the 20th century"
(also from pg 12)
So unless natural variability has suddenly spiked, natural variability cannot be the reason for the models' over estimate of warming.
Moderator Response:[RH] Dial it down just a little.
-
dana1981 at 00:38 AM on 2 October 2013IPCC model global warming projections have done much better than you think
Andrew @8 - I addressed the Christy/Spencer TMT graph here (see Stage 2).
Prev 829 830 831 832 833 834 835 836 837 838 839 840 841 842 843 844 Next


