


 Arguments


Recent Comments
Prev 859 860 861 862 863 864 865 866 867 868 869 870 871 872 873 874 Next
Comments 43301 to 43350:
-
Andy Skuce at 05:50 AM on 26 July 2013Update on BC’s Effective and Popular Carbon Tax
When thinking about cross-border shopping, we have to separate out two different issues:
1) Has the carbon tax, by itself, driven the recent increase in cross-border shopping trips?
Short answer: a bit, but it is probably not the dominant factor.
The carbon tax has added about 8 cents per litre (about 30 cents a US gallon) to the cost of gasoline. A 60 litre/16 US gal fill up across the border would save $5 in avoided carbon taxes. Most BC drivers would burn more money than this in gas just driving to the US and back to fill up. It would take most people at least an hour to do the round trip. So, clearly, few people would be motivated solely by the gas tax to cross the border.
But added to the other incentives to shop in the US, including other taxes on gasoline and cheaper groceries, electronics, booze and cigarettes, the carbon tax adds a small extra incentive.
It is worth noting that cross-border traffic has recently increased in other non-carbon-taxed Canadian provinces also. In addition, the number of border crossing was higher everywhere in the early 1990's than today, which time also coincided with a spike in the value of the Canadian dollar, as Tom noted for more recent periods.
2) Does the recent increase in one-day cross-border trips account for the drop in BC fuel sales?
Short answer: it probably accounts for up to 10% of the measured drop in consumption. But it`s not possible to calculate this exactly.
There were 2.3 million one-day car trips by Canadians between BC and the US in 2007 and 5.7 such trips in 2011. Thats an increase of 3.4 million trips per year. That means that, averaged over the BC population of 4.6 million, there were about 0.74 extra car trips per capita per year. If you assume that the average person fills up a car gas tank 12 times per year and that every extra one-day trip to the US results in a fill up, that would mean about 6% of the fill ups made by BC drivers since the carbon tax was introduced might have been done in the US.
Alternatively, if every one of those extra cross-border trips resulted in an average 60 litre (16 US gallon) fill up, then that makes about 200 million additional litres of fuel purchased annually. On a per-capita basis that amounts to about 44 litres per person per year. The graph labelled Figure 1 in the original post shows that per-capita fuel consumption has dropped by about 0.4 cubic metres per year, or 400 litres per person per year. Therefore, estimated this way, the increase in cross-border shopping would amount to approximately 11% of the drop in fuel sales in BC.
Of course, some extra fuel is consumed in making all of these extra trips, at, let`s say, 8 litres per round trip, that would amount to 27 million litres, so not all of the fuel purchased in the US reduces net fuel sales in BC.
I plan to do a more detailed calculation and I`ll post it on my blog when it is done. I will provide a link here, in a week or so. These are rough calculations only and are dependent on my assumptions, so please treat them as provisional.
-
Rob Nicholls at 05:06 AM on 26 July 2013The climate change policy discussion I wish Andrew Neil would have on BBC
Plus ca change. I saw Andrew Neil repeatedly asking the UK's Green Party Leader Caroline Lucas "Why has there been no statistically significant warming for 15 years?" on a programme called "Hardtalk" in 2010. I wrote to the BBC at the time pointing out that the audience was likely to have been severely misled by this question, that the warming over the previous 16 years reached a conventional threshold of statistical significance (p<0.05), and that over a short timescale natural causes of variability (ENSO, volcanoes, the solar cycle) tend to predominate, so the short answer is "15 years is too small a sample to demonstrate statistical significance." (I had no idea at the time how much the ocean is warming and how high a proportion of the warming goes into the ocean). 2010 proved to have the highest measured global surface temperatures ever according to some data sets, but alas, still the line of questioning persists. (Short term variability really is the gift that keeps on giving).
If Andrew Neil knew more about the science he might understand 1) how biased a perspective his chosen lines of questioning sometimes give on AGW, 2) that the IPCC's (AR4) suggested range for climate sensitivity is in line with the large body of evidence on the subject, and 2) how out on a limb scientists such as Judith Curry and Roy Spencer are from the mainstream evidence-based consensus.
This is why Skeptical Science is so important. To the uninitiated with no grasp of the vast weight of science behind the consensus on climate change, Curry and Spencer sound completely reasonable (although if you're aware of some of the science and actually bother to do a little digging you find the context of where they're coming from and IMHO their credibility is somewhat lost). Without websites like SKS, far more people would be taken in by the denial of dangerous AGW.
-
Tom Curtis at 05:02 AM on 26 July 2013Update on BC’s Effective and Popular Carbon Tax
Here is the gassbuddy comparison chart for fuel prices between British Columbia and Washington State:
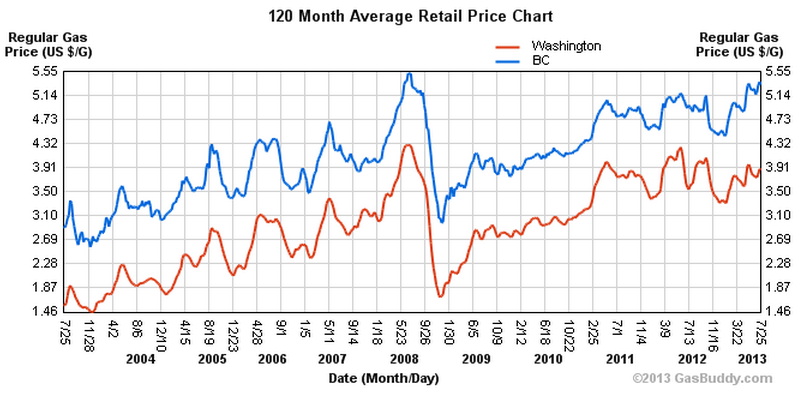
I should have included in the prior post, but plead tiredness and insomnia (the only reason I am posting at this time) as an excuse for my poor composition.
-
Tom Curtis at 04:57 AM on 26 July 2013Update on BC’s Effective and Popular Carbon Tax
Russ R @13, as of 2009 (most recent data), BC had 2.6 million light vehicles. They drove an average of 36,000 km per year, or 3,000 km per month. That is equivalent to about four tankfulls a month. In 2009, there were an average of 375,000 one day drive trips to the US from British Columbia, representing 14.4% of all vehicles (assuming for ease of calculation no more than one trip per vehicle). That indicates that approximately 3.6% of all fuel used by BC vehicles was likely purchased on return from a trip to the US, assuming nearly all vehicles did so. Let's call it 4%.
As the trips were for the most part not to get the fuel, and as fuels prices have been cheaper in Washington State than in British Columbia in US$ per gallon for the entirety of the last ten years (and by approximately the same margin), we can assume that that pattern has been consistent through time since before the introduction of the Carbon Tax. The effect of the Carbon Tax is not, therefore, the approximately 4% of fuel used by British Columbia cars that was purchased in the US, but rather the change in that figure. In other words, it is significantly less than 4% of total fuel use on British Columbia roads.
I have no doubt that fuel purchases in the US by British Columbians will have increased by some small margin due to the Carbon Tax. It is not as much as you suppose because the change in the price differential before and after tax is small (to small to pick by eye of a chart). Further, it is not as much as you suppose because US service stations close to the border probably have higher than average prices to exploit the BC market, and BC stations close to the border probably have lower than average prices to claw back market share against US competition. It is certainly much less than 4% of BC fuel use, and hence cannot account for the approximately 20% fall in fuel use* in BC over the period of the carbon tax**.
*Much of that fuel use would be for heating and power generation rather than for transport so it is not strictly comparable. Fuel use for private vehicle transportation may have fallen more or less than that 20%.
**Neither does the Carbon Tax, in that it was already falling before the introduction, although no doubt the carbon tax helped maintain and even accelerate that fall.
-
MA Rodger at 04:13 AM on 26 July 2013Levitus et al. Find Global Warming Continues to Heat the Oceans
dvaytw @42.
In the quote you present it says that somebody "thinks more energy is somehow transferred to the bottom of the ocean even though it isn't really warming it because there is so much volume there." Given the subject here is the 700-2000m layer (I assume, it being the deepest discussed in the Wattsupia link), that somebody's thinking would be at least partially correct. At present there is more OHC accumulating 700-2000m than there is 0-700m. The "so much more volume there" is only about 50% more and the "more energy" has since 2005 been not far short of being 50% more. Looking at the numbers, 0-700m OHC 2005ave - 2012ave OHC = 25.3ZJ. 700-2000m 34.9ZJ putting the average temperature increase 700-2000m at 92% of the 0-700m increase.
Of course the devilish mathematics practised by these denialist types is a good match for their devilish physics where there is "warming" which is irrelevant and proper warming which is very relevant. So it isn't impossible that the 92% is somehow the wrong sort of %.
-
KR at 04:06 AM on 26 July 2013Why doesn’t the temperature rise at the same rate that CO2 increases?
keitho - The oceans will not stop warming, will not magically maintain a cooler atmosphere in the presence of a GHG driven forcing imbalance. I hope you are not being disingenuous in that regard - you are, however, giving me that impression.
Ocean warming simply lags behind that forcing. Meaning that we will (with variations such as ENSO) continue to see atmospheric warming, and even if were to stop emissions instantly we would continue to see the oceans and atmosphere warm up until the Earth again radiates as much as it receives. It's just a long climate response time due to the high ocean thermal mass - not a 'get out of jail free' card.
-
Russ R. at 04:02 AM on 26 July 2013Update on BC’s Effective and Popular Carbon Tax
Tom Curtis,
Very good presentation of the data in context. I agree with your conclusion, the exchange rate movement is a better explanation for the increase in vehicle day-trips.
However, I would take a bet that on top of doing more single-day trips in general, British Columbians are bringing back more gasoline per cross-border day trip, simply because thanks to the added fuel taxes, the relative price differential on gasoline will have widened even more than the differential on other importable goods.
-
michael sweet at 03:57 AM on 26 July 2013Why doesn’t the temperature rise at the same rate that CO2 increases?
Keitho,
The ocean will not stop the atmosphere from warming. If the deep ocean absorbs a lot of energy it might slow warming down a little. If the recent slowing in the increase of surface temperatures is caused by ocean warming (as compared to just random variation), it might mean that we have an additional 10 years before 2C is exceeded. I would point out that with current climate change we have already experienced record climate damages in the past three years worldwide. It might be a good thing if the deep ocean gave us more time, but it is no panacea (especially if we use it as an excuse to waste another decade).
Heat always goes anywhere that heat is absent from. First the surface warmed, then the middle and now we are seeing the deep ocean start to warm. The question is how fast it will go to each location. The movements of heat are complex and that is why scientists are working to understand the heat fluxes better. If the heat currently accumulating in the middle levels of the ocean is somehow funneled under the Antarctic ice shelves that would be a big problem, because of sea level rise. As scientists learn more about the heat fluxes they can better estimate the chance of problems like that. It strikes me (without data) that while heating the ocean might make the surface temperature a little lower for a while, it would be more likely to melt Antartica. Since I live in Florida that would be bad. Which do you prefer?
-
Flakmeister at 03:51 AM on 26 July 2013Update on BC’s Effective and Popular Carbon Tax
Tom,
thx for following up on my skepticism. The exchange rate drives the cross border shopping and one can easily see that in early '09 the CAD went into the crapper (and has subsequently returned)...
-
Michael P at 03:47 AM on 26 July 2013Update on BC’s Effective and Popular Carbon Tax
The population of BC is approximately 4.4 million. On that basis, an additional 10% of population make day trips across the border, once a month. Assuming that every single one of those day trips includes filling the fuel tank, then we're talking one tank filling for 10% of the population. Assuming that the average person fills a tank approximately once a week, the most that the statistic could account for would be approximately 2.5% reduction in fuel usage in BC. There's still a lot of fuel reduction that cannot be explained on that basis. Now, even assuming that we only fill the tank once a month, there's still a 9% reduction that is not explained by the cross-border traffic. I would be interested to see data that shows the trend clearer, but a cursory view seems to show that the 19% reduction is not explained by filling up south of the line.
-
keitho at 03:04 AM on 26 July 2013Why doesn’t the temperature rise at the same rate that CO2 increases?
@Michael Sweet . . if the ocean is now keeping the atmosphere from warming and will do for centuries to come, why are we so worried about CO2? Surely if the cold ocean is keeping things from overheating now, even if it didn't in the recent past, then that indicates a stabilising feedback mechanism which is a good thing isn't it.
Also why does the heat prefer to be down deep? I understand that it can from what you say, but why would it do so.
-
Tom Curtis at 02:42 AM on 26 July 2013Update on BC’s Effective and Popular Carbon Tax
And for additional information, here is the history of the US dollar/Canadian dollar exchange rate:
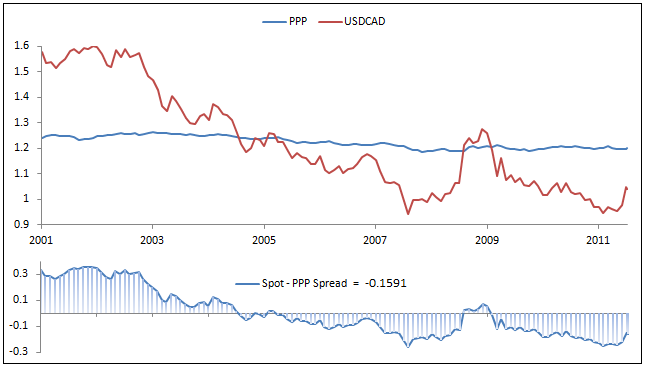
The similarity to the inverted shape for Canadian one day trips strongly suggests that currency flucuation is the real cause of the changes in Canadian day trip patterns.
-
Tom Curtis at 02:33 AM on 26 July 2013Update on BC’s Effective and Popular Carbon Tax
For completeness, the normalized trend for Canada minus BC is 0.7 StDev per annum.
-
KR at 02:33 AM on 26 July 2013Levitus et al. Find Global Warming Continues to Heat the Oceans
dvaytw - Energy is the central issue, energy drives the temperatures.
"Warming has only to do with temperatures" - Incomplete, warming has to do with temperatures, and volumes, and thermal mass.
Increasing greenhouse gases cause a top of the atmosphere (TOA) imbalance in energy, which can only be rebalanced (preserving the first law of thermodynamics) by the climate warming, and radiating enough additional IR to balance what energy is coming in. The energy going into the oceans (~5x10²² Joules per decade over the last 50 years) is a measure of that imbalance and energy accumulation.
Additional energy will accumulate until the climate warms enough to rebalance at TOA. The increasing ocean heat content (OHC) is the spin-up of the climate flywheel. Temperatures of deep ocean constrain, over the long run, surface temperatures. Both are rising; your opponent should be concerned. See this post, show him those graphs.
-
Tom Curtis at 02:27 AM on 26 July 2013Update on BC’s Effective and Popular Carbon Tax
Russ R @1, from your data source, here are the returning one-day trips in automobiles for Canadian residents only from the US. I assume that Canadians will not fly to the US to fill up their car, nor spend nights away to do so:

The data has been normalized by standard deviation to allow easy comparison of rates of change between provinces.
You will notice that British Columbia (lime green) had fewer such one day trips immediately following the introduction of the carbon tax, although the rate of decline was less than that for other provinces and for Canada as a whole. You will further note that from early 2009 the increased rate of Canadian one day trips is a Canada wide phenomenon, and that the rate of increase in BC is less than that for Canada as a whole. Over the entire period of the Carbon Tax, the trend for BC (0.66 Standard Deviations per annum) is less than that for Canada as a whole (0.72 Standard Deviations per annum), though I do not know whether that difference is significant.
We can conclude from this that the carbon tax is not the cause of the increased day trips to the US from British Columbia, and that if anything, it has reduced the trend to increasing day trips compared to the rest of Canada (but may well have had no influence).
-
Philippe Chantreau at 02:21 AM on 26 July 2013Levitus et al. Find Global Warming Continues to Heat the Oceans
That's the equivalent of a 3 years old covering his eyes in an attempt to make what he sees go away. Seriously, I would advise staying away from the buffoonery that masquerades as reasoning at Watts' site. Any time spent on that pile of nonsense is wasted.
-
dvaytw at 02:13 AM on 26 July 2013Levitus et al. Find Global Warming Continues to Heat the Oceans
PS my opponent in the discussions response to your critiques was the following:
"Total energy values are of interest to him because it shows the deep ocean is "warming," when it isn't warming. Warming has only to do with temperatures. He may be interested in this because he thinks more energy is somehow transferred to the bottom of the ocean even though it isn't really warming it because there is so much volume there. But Watt's argument is that El Nino and La Nina events are constantly charging and discharging waters, they are moving around, so volume has little to do with it. For example, if water is being warmed on the surface, and then that warmer water is moved down to the deep ocean due to trade winds during La Nina, changing equations to volume and total energy is unnecessary."
-
Russ R. at 02:11 AM on 26 July 2013Update on BC’s Effective and Popular Carbon Tax
Alexandre:
Do you have any data showing the significance of this side effect on the province's overall fossil fuel consuption?
That would require data on how many liters of vehicle fuel were "imported" back into BC from Washington, Alaska, Yukon, and Alberta border crossings. I'm pretty sure that no such data exist.
If you'd like a ballpark number, a good place to start would be with the Business Council of British Columbia who estimate that $2.0-2.6 billion in retail revenue is now being lost to cross border visits annually, of which a sizeable amount is gasoline (http://www.bcbc.com/content/879/PPv20n2.pdf). Obviously not peer reviewed, so take with a grain of salt.
From those figures, Willis Eschenbach estimates the imported gasoline volume at around 100 million gallons annually, or more than 50% of the reported reduction in total domestic fuel sales (http://wattsupwiththat.com/2013/07/12/fuel-on-the-highway-in-british-pre-columbia/ and http://wattsupwiththat.com/2013/07/13/the-real-canadian-hockeystick/). Again, grain of salt.
I personally think he overestimates the actual amount due to some aggressive assumptions, but even if he's off by a factor of two, it would still be a significant amount of leakage that should not be ignored, especially since people are burning extra gas (and emitting more GHGs) to realize those cost savings.
I'd guess it just applies to cases where you have very near towns on both sides of the border, quantitatively very marginal.
I assume you're not from BC, because the distance from the biggest city in the province (Vancouver) to the nearest US border crossing (Point Roberts), happens to be only 25 km (17 miles) from the Oak St. Bridge in Vancouver to the Shell Station in Point Roberts. Traffic is usually terrible, but if you're on passing through the Tsawassen Ferry Terminal (to get to or from Vancouver Island), then Point Roberts is just around the corner.
-
michael sweet at 01:50 AM on 26 July 2013Why doesn’t the temperature rise at the same rate that CO2 increases?
Keith,
The upper ocean has warmed (a lot) more than the deep ocean. As KR points out, the heat can also move through the upper ocean to the deep ocean with little change in the middle.
The ocean and the atmosphere were in equilibrium before man started adding so much greenhouse gas to the atmosphere. With increased greenhouse gas the atmosphere started to warm. Once the atmosphere was warmer, the ocean started to absorb more energy so that the ocean/atmosphere system stays in equilibrium. Currently, the atmosphere is relatively warmer than the ocean so the ocean is absorbing most of the energy. The ocean will continue to absorb energy for a long time (centuries) until a new equilibrium is established.
Why is this important? The rate that energy is transferred to the deep ocean affects the rate at which the surface heats up. If more energy is transferred to the deep ocean the surface warms a little slower. If less energy is transferred the surface warms a little faster. The more we understand the transfer of energy to the deep ocean the better we can project future temperatures. We can also determine which climate models give the most accurate projections for heating of the deep ocean and relate that to the accuracy of their surface temperature projections.
-
numerobis at 01:40 AM on 26 July 2013Update on BC’s Effective and Popular Carbon Tax
Another thing that has happened at the same time is that the US dollar fell in the decade since 1999. Daily trips Canada-wide were slowly growing beforehand already (except for a giant step down in September 2001). The USD particularly fell in early 2010, which made all goods much cheaper down there. Also, the daily duty-free limit went up recently.
BC's population is particularly close to US population centers, so BC residents can more easily take advantage of the low cost of most goods in the US than can Toronto-area or Montreal-area residents.
tl;dr there's lots of reasons for cross-border shopping to have increased in BC, try harder to show the carbon tax dunnit (or, more precisely, try to tease out how much is due to the new gas taxes).
-
bvee at 01:30 AM on 26 July 2013The Economist Screws Up on the Draft IPCC AR5 Report and Climate Sensitivity
don't spend anymore time on graph, it's over-reaching.
-
KR at 01:28 AM on 26 July 2013Levitus et al. Find Global Warming Continues to Heat the Oceans
dvaytw - There are some interesting graphical tricks in that post, such as plotting the layers energy changes as separate overlaid plots rather than as a cumulative sum as in the opening Levitus graph. That minimizes apparent visual extent and changes.
The last graph, temperatures of layers with different thicknesses, is particularly misleading - the large rise in surface temperature (very little energy involved) shown over the deep layer temperature changes (a huge amount of energy) is a case of apples/oranges. Energy is the proper comparison. In an energy consideration to be consistent with the 0-100m layer depiction the 100-700m line should be 6x larger, the 700-2000m line 13x larger, and SST has no place whatsoever in an energy comparison without a specified layer thickness and thermal mass.
Regardless - temperatures are not flat, not even on Eschenbachs misleading chart. Energy is the relevant criteria, all observed layers are accumulating energy at a rate near 0.5-0.6 W/m2 globally over the last 50 years, and that imbalance is warming the entire climate.
-
Composer99 at 01:19 AM on 26 July 2013Update on BC’s Effective and Popular Carbon Tax
Russ R:
If decreasing greenhouse gas emissions is the goal, then assuming what you describe is a problem worth addressing (which it may not be even if it is a real problem), the solution would be to convince Washington state to adopt a revenue-neutral carbon tax (or equivalent pricing system).
-
KR at 01:12 AM on 26 July 2013Why doesn’t the temperature rise at the same rate that CO2 increases?
keitho - How? Circulation, to be short.
Consider the vertical temperature profile of the oceans (warmest at the surface, coldest at the deeps), and note that if under increased circulation 100-700m water moves into the cold deeps, while warmer 0-100m waters move into the 100-700m range, the effect will be a cooling surface and warming deep water without changing mid-level temperatures.
Given circulated energy E:
- Surface energy - E -> colder sea surface temperatures, colder air
- 100-700 +E - E -> potentially no change in temp, depends on amounts
- gt. 700 + E -> warmer, as per observations
Increased greenhouse gases warm both oceans and air - with circulation changes such as ENSO affecting the relative amount of energy going into those two compartments. And given the relative thermal mass of oceans and atmosphere, a small percentage change in ocean warming rate translates into a large change in atmospheric warming rates. But the average energy uptake hasn't stopped, warming is still occurring, and short term variations like ENSO will cancel out over time.
Don't get distracted by short term noise.
-
CBDunkerson at 01:04 AM on 26 July 20132013 SkS Weekly News Roundup #29B
The city of Palo Alto California recently went to a 0% carbon emissions policy. Most of the time they generate 100% of their electricity from renewable sources, but if they have to pull in 'dirty electricity' from the grid they will purchase carbon offset credits.
Total added cost to residents of the city? About $3 per year.
So yes... some transmission infrastructure costs come into play as the amount of renewable energy used increases. However, they are nowhere near the massive prohibitive barrier portrayed.
-
dvaytw at 00:59 AM on 26 July 2013Levitus et al. Find Global Warming Continues to Heat the Oceans
Thanks for the feedback guys and this again just shows these discussions are over my head and sadly it often falls to guys like me to argue with guys equally as clueless about these topics! But that's just how it goes, so as always I appreciate your feedback.
Now to double check, if I understand what you're saying, it is that in fact temperature isn't the relevant criterium here, so Eschenbach's chart showing ocean floor temperatures as flat is irrelevant? Is there an easy way for you to explain to me why this is so?
-
keitho at 00:52 AM on 26 July 2013Why doesn’t the temperature rise at the same rate that CO2 increases?
Perhaps someone here can give me a simple explanation of how the heat gets from the atmosphere to the deep ocean (700m) without warming the upper 700m first. Also what changed to make the man made CO2 warm the ocean rather than the air, and how long will it be till it changes back?
thanks
-
Flakmeister at 00:50 AM on 26 July 2013Update on BC’s Effective and Popular Carbon Tax
Russ,
that is good observation, but before we get all excited there are a few things to consider. I lived for 5 years in Vancouver (near the airport), the nearest US gas was Point Roberts. This required a round trip of roughly 35 miles in typically brutal traffic. The spread in price had to be large to make it worthwhile to make the trip given that you burned ~10% of your tank and wasted a good 1/2 hour just going through customs. The other driving factor was the USD-CAD exchange rate..
So while there are no doubt people arbitraging the taxes, you have a bit of work to do to show it is a significant fraction of the decreased consumption.. BTW, taking two monthly meausurements ~5 years to define a trend is known to be poor analysis, esp. given that this the SKS website....
You should also be able to correlate it with changes in gas consumption in WA state....
-
Alexandre at 23:29 PM on 25 July 2013Update on BC’s Effective and Popular Carbon Tax
I'm keeping an eye on this BC experiment, and I think it deserves far more attention than it's had.
Do you guys have plans to add a Facebook "Like" button or Tweet to the articles?
-
Alexandre at 23:28 PM on 25 July 2013Update on BC’s Effective and Popular Carbon Tax
Russ R.,
Do you have any data showing the significance of this side effect on the province's overall fossil fuel consuption? I'd guess it just applies to cases where you have very near towns on both sides of the border, quantitatively very marginal.
And even so, it does not invalidate the tool. It just stresses the known downside of doing it in an isolate manner from the neighbour provinces. That's why they have to keep the carbon tax in a low level - even so, with encouraging results.
-
MA Rodger at 22:39 PM on 25 July 2013Why doesn’t the temperature rise at the same rate that CO2 increases?
grindupBaker @17.
This post calls itself a 'basic' level rebuttal so we may be tending off topic with these calculations. Your "OHC gradient" number looks a little high given the manner you are using it. I wonder if the 0.9 W/sqM figure is for the area of the ocean and not for global area. Ice is not an insignificant addition to ocean heating, increasingly so in recent years (the same years that saw less increase/less significance in surface temperature). But the biggest omission is the other anthropogenic forcings. (See for instance Skeie et al 2011.). The other positive ones are reasonably easy to quantify and sum to a similar size as CO2. The negative ones are less easy to nail down. And additionally there are the natural forcings. So there's lots requiring adding into the calculation, which if you think about it isn't a surprise. This calculation is effectively calculating climate sensitivity and everyone would love to nail that baby.
-
CBDunkerson at 22:34 PM on 25 July 20132013 SkS Weekly News Roundup #29B
JasonB, while I generally agree with you, there is a transmission cost issue to be considered with rooftop solar PV if there is something like a 'feed-in-tariff' scheme in place.
That is, if the solar generated electricity is used by the house which generated it then comparing solar generation cost to grid generation and transmission costs is an apples to apples comparison for that house... in both cases we are looking at the total cost of getting the electricity for that house.
However, if solar power generated by the house in excess of what the house is currently using is then distributed to neighboring houses through the grid an argument can be made that the cost of solar power to those houses is the solar generation cost plus transmission costs.
Granted, transmission distance is generally going to be much less for rooftop solar than traditional centralized grid power and the transmission infrastructure is already in place so there isn't really any significant additional cost to transmit rooftop solar power over it. However, the more rooftop solar power is generated the less money the power companies make. At a certain point this would impact their ability to maintain the power grid and thus impact costs to people receiving transmitted solar generated power. You can't go 100% solar (or even 50%) without adding in some cost for distribution and/or storage.
That said, I am very surprised by the claim that grid maintenance costs three times as much as grid power generation. I'd think it was closer to the other way around. If transmission infrastructure is really that massively expensive why haven't we switched to a system where we generate twice as much power and lose half of it through wireless transmission? That would come out to half the total price. Indeed, microwave transmission efficiency is usually over 80%, so the 50% assumption I used provides plenty of wiggle room in that estimate.
Looking at it another way... if 75% of the cost of grid power is transmission infrastructure then increases in fuel costs should have very little impact on total power cost. Yet that isn't the case. Electricity costs rise when fuel costs do and utility profits rise when fuel costs fall. For example, the fracking boom in the US caused a steep drop in natural gas costs and record profits for utility companies (since they didn't lower electricity costs). If generation is only 25% of total cost, and fuel therefor only some fraction of that, the impact should have been minimal.
In short, it doesn't seem to add up.
-
Russ R. at 22:16 PM on 25 July 2013Update on BC’s Effective and Popular Carbon Tax
This article makes no mention of the increase in British Columbians driving just across the border in Washington to fill their gas tanks. (http://bc.ctvnews.ca/tax-gap-has-b-c-ers-driving-south-for-gas-watchdog-1.1285011)
According to Statistics Canada, the number of same-day return trips by BC drivers across the US border has increased by more than 100% since the carbon tax was implemented, from 421,665 per month in June 2008 (the last month before the carbon tax), to 868,915 as of May 2013.
Source: Statistics Canada. Table427-0005 - Number of international travellers entering or returning to Canada, by province of entry, seasonally adjusted, monthly (persons), CANSIM (database). (accessed: 2013-07-25)
Yes, carbon taxes will change people's behaviour... thought perhaps not as intended.
-
michael sweet at 22:14 PM on 25 July 20132013 SkS Weekly News Roundup #29B
JvD,
When you use strong words like "deliberate lies" you are much less convincing. It makes you look especially bad when you accuse others of deliberate lies and then it is pointed out that your statements are contradicted by the Saudi gevernment. Who is the deliberate liar here? It appears to me that you are the deliberate liar, and not the environmentalists. If you want to convince others to listen to your position you need to change your tune. You may have a point, but I will not read your posts as long as you make wild accusations about others that can easily be pointed back at you.
-
JasonB at 21:12 PM on 25 July 20132013 SkS Weekly News Roundup #29B
JvD,
What they (deliberately!) neglect is that the conventional retail electricity price contains not only the cost of generation (which is about €5 ct/kWh), but also the cost of transmission and distribution.
How is that a problem? One minute you're saying that "the cost of production" should be the only measure, the next you're saying that it's unfair to compare the "cost of getting electricity into my house" between two technologies because one manages to bypass the cost of transmission and distribution by virtue of the fact that it's already at my house!
The fact that rooftop PV doesn't have transmission and distribution costs is an actual benefit that means it gets to compete with end-user retail prices rather than wholesale electricity prices.
Anyway, back to your cost of production bugbear:
Yes I am. The only sensible way to determine the competitiveness of different energy options is to compare the cost of production of those sources. If the Saudi's were to raise the domestic price of oil to the international level, that would tilt the playing field domestically to other sources, but it would not change the basic fact that oil is far more cost effective than those other sources.
The cost of production is irrelevant. Yes, Saudi Arabia has the world's lowest oil production costs, but taking advantage of that to sell oil cheaply domestically instead of selling that same oil at the going market rate is not only a real cost, it enourages inefficient resource allocation!
Scenario A: Saudi Arabia produces a barrel of oil for $6, and sells it domestically for $6. Citizens benefit from cheap oil, with those more able to consume oil benefitting the most. (Note that I'm actually taking your word for it that they really are selling it at "production cost", since I haven't actually seen any evidence of the "true production cost" vs domestic retail price, and I have doubts that the "true production cost" is even publicly known; it would also depend heavily on how it is accounted.)
Scenario B: Saudi Arabia produces a barrel of oil for $6, and sells it at the going market rate of $100. The extra $94 is used to give tax breaks, education, health services, welfare, etc. Citizens pay more for their oil, but avoid paying $94 through tax or reduced services that they would have had to pay somehow otherwise. The benefits of that $94 can be targetted to achieve desired outcomes. The higher cost of oil encourages more efficient use (e.g. not burning it for electricity!) and encourages the use of alternatives that will allow the oil reserve to last longer and ultimately derive more revenue.
As has been pointed out to you repeatedly, the Saudi government calls it a subsidy; I do not think it is appropriate to accuse others of deliberate lies to misinform the public just because they don't adhere to your personal definition of the word. You're also picking the country in the world with the cheapest production cost and the best chance of retailing their oil above that production cost to dispute all subsidies.
To me, an apples-to-apples comparison is between true market values of each commodity before any taxes or subsidies have been added. This means, for example, that when comparing wind to fossil fuels, then any tax breaks or special benefits that wind receives should be removed and any excise taxes on fossil fuels should be removed and then the two compared so that the true cost can be ascertained. But how does it help to compare the retail price of wind power in my country with the retail price of domestically-sold oil in Saudi Arabia? Can I buy that oil at that price? No? Then it's irrelevant. If the Saudi's want to forgo the extra revenue that they would get if they sold all their oil at market rates then that's their problem; it makes no difference to me.
Likewise, if I put solar PV on my roof, I don't care that the electricity generator is generating power at half the price — I can't buy it for that price! It needs to get to my house, which makes it twice as expensive. What it costs me is what counts.
And, of course, once we start adding in externalities to get the true costs of burning those fossil fuels, the point becomes moot anyway...
-
JvD at 19:53 PM on 25 July 20132013 SkS Weekly News Roundup #29B
As another egregious example of camparing apples to oranges as a result of wrongly accounting for energy taxes and subsidies, consider the level of discussion in my country - the Netherlands - concerning the so-called 'grid-parity' of rooftop solar versus conventional generation. All of the so-called 'green' groups in my country are lobbying hard for promotion of rooftop solar. They are doing this by claiming that rooftop solar is "already cheeper than conventional electricity". They are claiming that since rooftop solar costs about €20 ct/kWh, and retail electricity prices are a few €ct/kWh greater than this, that rooftop solar is 'competitive without subsidies'.
What they ( -snip-) neglect is that the conventional retail electricity price contains not only the cost of generation (which is about €5 ct/kWh), but also the cost of transmission and distribution. Moreover, it contains the high taxes on electricity that are applied in my country. So when these taxes and costs are included, it is obvious that rooftop solar is 400% as expensive as conventional electricity. Yet these 'green' groups are claiming continuously that if my countrymen would switch wholesale to rooftop solar that this would result in significant financial savings for the country! (-snip-)! Since we use about 100 TWh of electricity per year in my country, if we would switch to rooftop solar it would cost at least €15 billion per year extra, even ignoring the very high cost of additional transmission, backup and storage needed to run completely on intermittent renewables such as solar power.
The green groups are ignoring this. Shockingly, they are even turning around and saying that the retail price of €20 ct/kWh is going completely to the 'big bad'energy companies. Now, I know that these green groups realise that of this €20 ct/kWh only about €5 ct actually goes to the energy companies, and that the rest is taxes and gridcosts. (-snip-).
Moderator Response:[DB] Inflammatory snipped.
-
JvD at 19:08 PM on 25 July 20132013 SkS Weekly News Roundup #29B
You seem to be insisting a special definition of subsidy. Lets not get hung up on definition. How about the claim then that goverments are providing $600B of various kinds of price support that, if removed, would increase consumer cost of fossil fuel, making other sources more competitive. Are you contesting this statement?
Yes I am. The only sensible way to determine the competitiveness of different energy options is to compare the cost of production of those sources. If the Saudi's were to raise the domestic price of oil to the international level, that would tilt the playing field domestically to other sources, but it would not change the basic fact that oil is far more cost effective than those other sources.
Certainly, it would change nothing in the cost effectiveness of oil versus alternatives in countries outside Saudi Arabia. In anything, reducing oil demand in Saudi Arabia by raising domestic prices by 600% (which is what it would take to achieve international prices level domstically) could increase the amount of oil available to the international market, which could reduce the international price of oil, thereby reducing the competitiveness of alternatives globally. Even if the international price of oil would not change, then there is no reason to assume renewables would really take off in Saudi (although efficiency of oil use would likely improve). If the domestic price of crude were to be raised, then international coal would be the next-best economic choice for Saudi, increasing the co2 emissions of the country rather than reduce them. We now know of course that Saudi is investing heavily in nuclear energy, which alleviates the risk of Saudi turning to coal. Solar energy might seem a no-brainer in sunny Saudi, but it turns out that desert environments are not especially favourable for solar, due to the increased burden of dust and high operating temperatures.
In order to maintain clarity in comparing the economics of different energy sources, I believe it is necessary to judge them based on cost of production only, including all indirect costs, but excluding as much as possible any subsidies and taxes. (-snip-).
(-snip-). In my own experience, I chastised my local chapter of Greenpeace (of which I am still a donating member) from bringing this very same lie several years, and they have backed-off from it (grudgingly, though not completely). (-snip-).
Moderator Response:[DB] Inflammatory snipped.
-
Tom Curtis at 17:37 PM on 25 July 2013The Economist Screws Up on the Draft IPCC AR5 Report and Climate Sensitivity
ianW01 & jdixon1980,
1) I modified the graph in question so that all three red circles align with 2100, and added a trend line from the end of the observational data to 2100 for each. Here is the result:

You may think there is a gain in visual clarity, but I do not.
2) The original graph does not cause any confusion if you do not assume graphs can be interpreted independently of their accompanying text. In the case, the accompanying text, ie, the legend, clearly states:
"Measured and Projected temperature to 2100"
That legend precludes interpretations in which the red dots are considered to indicate temperatures other than at 2100.
3) In that regard, ianWO1's interpretation of the graph (@16) as showing the time to equilibrium temperature is entirely unwarranted. In fact, in scenario RCP 6.0, forcings do not peak until about 2150 and temperatures are still rising at 2300. Beyond 2300, whether or not temperatures will reach, exceed or fall short of the equilibrium for the Charney Climate Sensitivity depends on a number of factors outside the scope of the scenario. Further, depending on those factors temperatures may be unstable for millenia, although rates of change are unlikely to match those in the twentieth century, much less the twenty-first.
4) I also like jdixon1980's suggestion for an animated gif and think it would be a superior presentation. On the other hand, I am not prepared to prepare it myself, and therefore am disqualified from criticizing other people who have voluntarilly surrendered their own time to prepare the original graph for not spending more of their own time to make the superior product. Perhaps jdixon would volunteer?
-
grindupBaker at 16:31 PM on 25 July 2013Why doesn’t the temperature rise at the same rate that CO2 increases?
@Me#16 Correction because delta-radiation ~proportional to delta-t for these <.01 dt ratios even though proportional to t**4. Seems to me that 75% +ve feedback is what's been added average (presumably increasing). +0.8C thus far balances 3.75 wm**-2 * 0.8 / 1.2 = 2.50 wm**-2. OHC gradient looks like 0.85 wm**-2. CO2 forcing 5.35*ln(10/7) = 1.91 wm**-2. So, (2.50 + 0.85) / 1.91 = 1.75 (75% +ve feedback). Right ?
-
grindupBaker at 15:48 PM on 25 July 2013Why doesn’t the temperature rise at the same rate that CO2 increases?
To the extent that basic CO2 forcing formula is accurate and the reanalysis OHC is accurate and Dr. Randall was accurate saying 3.75 wm**-2 is balanced by +1.2C then it seems to me that 42% +ve feedback is what's been added average (presumably increasing). +0.8C thus far balances 3.75 wm**-2 * 0.5 = 1.87 wm**-2 (0.5 per t**4 at ~287-289 degrees K). OHC gradient looks like 0.85 wm**-2 (Dr. T says it's 0.9 wm**-2). CO2 forcing 5.35*ln(10/7) = 1.91 wm**-2. So, (1.87 + 0.85) / 1.91 = 1.42. What am I misunderstanding ?
-
grindupBaker at 15:26 PM on 25 July 2013Why doesn’t the temperature rise at the same rate that CO2 increases?
@DAK4Blizzard #3: Extra info. Dr. Kevin Trenberth says in SFU lecture video posted as "The Role of the Oceans in Climate" oceans mix well to 20m depth in summer, 100m in winter - can take 90m as average and will delay response by 6 years. KT says 3.5m depth = all atmosphere heat. Dr. Randall says top 6.5m land is what's considered (insulates well) and equivalent to 3.25m ocean depth but I recall a lady climate scientist saying only ~2m ocean depth = all land heat (my memory vague on that latter).
-
Tom Curtis at 14:38 PM on 25 July 2013The Economist Screws Up on the Draft IPCC AR5 Report and Climate Sensitivity
Richard Lawson @19, I would be interested in how you found that "slew" of papers. A search of google scholar for "climate", "sensitivity" post 2008 returned 282,000 hits. I doubt you have read even 10% of them so as to be able to determine that they are dominated by low sensitivity results. I suspect that you may have read about the "slew" of papers on some denier site where (if they are like Patrick Michaels or WUWT), they only report the few papers returning a low climate sensitivity and not those many others reporting a high climate sensitivity. Thus they will not have reported on Haywood et al, (2013) which reports climate sensitivities from 2.7 to 4.1 C per doubling of CO2 from a comparison of the output of eight models with pliocene conditions (table 2). Nor on Eagle et al (2013), which report a high regional climate sensitivity in central China. Nor on Li et al (2013), which report a climate sensitivity of 5.4 C per doubling of CO2. Nor (finally) on Previdi et al (2011), who report that the Earth System Sensitivity, ie, the climate response allowing for slow feedback such a the retreat of ice sheets etc, may well have an impact in periods short enough to be relevant to policy.
However, it is not true that all recent low climate sensitivity estimates have been based on simple energy budget models, nor that their use are the cause of the low estimate. Schmittner et al, for example, use the Uvic earth system model, but reach their low sensitivity estimate because of the (probably unrealisticly) low estimate of the difference in temperature between the LGM and the present. Nic Lewis's recent two recent efforts (only one of which was peer reviewed) have low sensitivities at least in part because they do not allow for the effects of recent La Nina's (which will cause the estimated climate sensitivity to be low).
-
Tom Curtis at 13:37 PM on 25 July 2013Skeptical Science Study Finds 97% Consensus on Human-Caused Global Warming in the Peer-Reviewed Literature
OneHappy, the most thorough and extensive attempt to review Cook et al, 2013 for potential errors was done by Cook et al 2013. This was done by contacting authors of papers and asking them to independantly rate their own papers. Curiously, the resource this independent vetting of the result provides has been ignored by "skeptical" critics of the paper. That is because if you simply ignore the abstract ratings, Cook et al could have reported that 96.57% of climate science related papers that state a position are rated as endorsing AGW by their authors. And that is the result they do not want to accept.
With suitable caveates, the author self ratings can be used as a check on the error rates in the abstract ratings. If we do so by simply treating them as basic error rates, after correcting for errors we will simply reproduce the statistics for the self ratings (which is not interesting). We can compare ratio of particular types of errors in particular categories and find some interesting facts. Doing so, we find that among papers rated by both authors and by abstract, 1.98% of papers rated as endorsing the consensus by the abstract raters were rated as rejecting the consensus by the authors. In contrast 30% of papers rated as rejecting the consensus by abstract raters were rated as endorsing the consensus by the authors. If we correct the headline result on that basis, it reduces the 97% endorsing the consensus to about 95%.
As an alternative, we can assume that any paper rated as rejecting the consensus by either author or abstract rater actually rejects the consensus; and that any paper not rated as rejecting the consensus by either, but rated as neutral by either is actually neutral. If we do this, we still find that 90.6% of papers that state a position endorse the consensus.
It should be obvious that the assumptions in the last example are ridiculous, and that consequently the result is lower than any concievable result from a reasonable analysis of the data. Yet still the result shows >90% of papers endorsing the consensus. I believe this supports the position I have stated previously (before I had access to the detailed data on author ratings) that the level of endorsement is almost certainly greater than 90%, and is most likely greater than 95%.
-
grindupBaker at 13:29 PM on 25 July 2013The climate change policy discussion I wish Andrew Neil would have on BBC
Andrew Neil blogs "The recent standstill in global temperatures is a puzzle. Experts do not know why it is occurring...". Most likely he's never heard about oceans or been to the seaside. Oceans are a double-edged sword. ~5,900 Zj for just 1 degree average rise is a huge buffer with ~8 Zj p.a. being added the last decade or so but once the heat is in the oceans it'll be tricky getting it out. ~10,000 Zj energy needed to melt all land ice off Antartica and Greenland. But the earlier potential effects such as frozen methyl hydrates release seems somewhat pressing. I haven't seen a climate science estimate of reasonably safe additional ocean heat.
-
JasonB at 12:04 PM on 25 July 2013Skeptical Science Study Finds 97% Consensus on Human-Caused Global Warming in the Peer-Reviewed Literature
OneHappy,
I suggest reading through earlier comments, there was some discussion on the exact ratings applied to some papers and suggestions on how Cook et al might be meaningfully "audited". In particuar, any bias in how the papers are chosen (e.g. simply checking the papers of known sceptics) will invalidate attempts to extrapolate the error rate to the sample as a whole — if you don't want to recheck every rating then you need to choose a random sample of papers and see what error rate you get with those, taking into account both the papers that you didn't disagree with and those that you did. And don't forget the self-ratings of the authors!
The bottom line, however, is that nobody has come up with a huge hoard of papers that did not endorse the consensus yet somehow escaped that categorisation in Cook et al. You can always find errors in any human endeavour (and the paper itself specifically quantified disagreements between Cook et al raters, though remember that a disagreement in rating doesn't automatically translate into a disagreement in endorsement/non-endorsement) but the real question is, what impact does that error rate have on the result?
Given the overwhelming numbers involved, even gross errors would not sway the results very much. For example, as Tom Curtis pointed out previously regarding the author self-ratings, in order for the original authors' level of endorsement to drop to 94.5% — a figure I would still consider overwhelming — you would need to believe that half of the original authors mistakenly assessed their own papers as endorsing the consensus when they should have been rated as neutral.
Now, it's true that some (e.g. Richard Tol) managed to mis-rate their own papers (thereby incorrectly claiming Cook et al were wrong) but half? And that would still make the headline look much the same. Why? Because there really are bugger-all papers in the literature that actually dispute the consensus. What's even worse is that when you examine those papers, certain opinions about quality and rigour invariably form. In other words, not only are there very few papers disputing the consensus out there, but most of those are also rubbish with obvious errors that make you wonder how they got published in the first place. (Actually, not really — it's painfully obvious how they got published in most cases; it's just sad.)
There's no need to have doubts, the assessments are all online. Check for yourself!
-
OneHappy at 11:01 AM on 25 July 2013Skeptical Science Study Finds 97% Consensus on Human-Caused Global Warming in the Peer-Reviewed Literature
On reflection I think if there are 4 mistakes in over 4,000 abstracts rated then 0.1% is an acceptable rate of error, but still interested in other opinions on this.
-
chriskoz at 10:08 AM on 25 July 2013The Economist Screws Up on the Draft IPCC AR5 Report and Climate Sensitivity
Richard@19,
You're correct.
For example, simple Energy Budget models ignore the albedo change from sea ice/ice sheet melt, also the permafrost melt and methane clathrate release is ignored. That's because the machanics or the extents of those feedbacks are unknown. However, with more data about recent sea ice melt, I expect the sensitivity figures will be updated upwards in the near future.
-
Andy Skuce at 08:50 AM on 25 July 2013BC’s revenue-neutral carbon tax experiment, four years on: It’s working
usbuyer:
There's certainly some truth to what you say, whenever I drive across the border (about twice a year) I always fill-up. But I always have done that, even when I used to live in Alberta. And there has been in an increase in Canadians making cross-border shopping trips in the past few years, not only in BC, but in the other provinces also. It's unclear how much of this increase has been driven by the ~8cents per litre carbon tax, which might save an additional $5 per fill up. As you know, a lot of other goods are cheaper in the US.
I am working on crunching some numbers on this and will post a link here when I have finished. On a preliminary basis, I think that this might account for about an apparent 2% reduction in BC's per-capita fuel consumption. The latest figures, in a peer-reviewed study, show that BC fuel consumption has fallen by about19% relative to the rest of Canada since the carbon tax was introduced. So, perhaps 10% of the reduction might be attributable to cross-border shopping rather than other behaviour changes spurred by carbon taxes. But I need to check the calculations first.
-
usbuyer at 06:31 AM on 25 July 2013BC’s revenue-neutral carbon tax experiment, four years on: It’s working
Don't have an opinion on whether BC carbon tax is good or not. Do know that I used to spend about $2500 year buying gas in BC - now go across the border - fill up (and play a round of golf) - spent less than $200 on gas in BC last year. Many of my neighbors go to US on the weekend - shop - and gas up. Of 6 families around my place, I would estimate that gas buys in BC were around $15000 year, now not more than $1000 year. Don't know of any neighbors driving less - just going south for gas to save money. Need to look at all the impacts (lost sales, etc) when contemplating higher taxes.
-
KR at 05:42 AM on 25 July 2013Levitus et al. Find Global Warming Continues to Heat the Oceans
MA Rodger - Oh my, I missed that throwaway line the first time through. Eschenbach (somehow) dismisses CO2 in a sentence completely unrelated to anything else in the blog post, with no supporting evidence whatsoever.
So: a discussion that adds nothing to Levitus 2013, with unsupported aspertions on OHC data accuracy and a complete non sequitur regarding CO2 tacked on the end. I believe that sums up that Eschenbach post - in my opinion it's not worth the time to read.
Prev 859 860 861 862 863 864 865 866 867 868 869 870 871 872 873 874 Next


