


 Arguments


Recent Comments
Prev 867 868 869 870 871 872 873 874 875 876 877 878 879 880 881 882 Next
Comments 43701 to 43750:
-
bouke at 18:18 PM on 10 July 2013Empirical evidence that humans are causing global warming
What scientists have seen over the last few decades is a gradual decrease in the amount of energy being re-radiated back into space.
I always thought it was too difficult to measure this accurately enough. Could you provide a reference to this?
-
JasonB at 17:19 PM on 10 July 2013Empirical evidence that humans are causing global warming
guinganbresil,
Ignoring the fact that the total emission is out of balance with the incoming energy, it's not true to say that if there were not an energy imbalance at TOA then AGW would be "all bunkum". AGW predicts that if the forcing were to stop increasing then the energy imbalance would shrink until the climate reached a new equilibrium. All the energy imbalance tells us is that the climate is not yet in equilibrium with the current change in forcing.
-
Dikran Marsupial at 16:48 PM on 10 July 2013Empirical evidence that humans are causing global warming
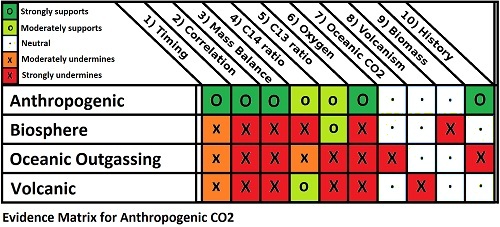
stbloomfield That the rise in atmospheric CO2 is anthropogenic is quite unequivocally established by the fact that atmospheric CO2 is rising more slowly than anthropogenic emissions, which means that (unless conservation of mass is violated) the natural environment is a net carbon sink and removes more CO2 from the atmosphere each year than it puts in.
It is obviously more than just a correlation as we have direct observations of the causal mechanism, we know we are putting CO2 into the atmosphere by burning fossil fuels!
-
Peeve at 15:23 PM on 10 July 2013The Consensus Project self-rating data now available
Rob Honeycutt @7. It doesn't surprise me that you are not getting a response. I was enjoying commenting on WUWT, and to give them there credit, they allowed me to have my say - up to a point. i think it gave them an opportunity to attack me personnally (including threats of violence). In the end it must have been too embarrassing for them as they have banned me from ever commenting again.
-
guinganbresil at 14:05 PM on 10 July 2013Empirical evidence that humans are causing global warming
DSL, I disagree that TOA energy imbalance is merely hard to measure corroborating evidence - it is critical to the whole theory. A change in the shape of the OLR spectrum does not by itself cause a change in temperature - the total emission needs to be out of balance with the incoming energy...
-
DSL at 13:44 PM on 10 July 2013Empirical evidence that humans are causing global warming
Another version of Brian: all of those things have happened at the same time in the past, and there was a physical mechanism in place that explains their occurrence. All of those things are happening now, and no natural mechanism is available to explain them. An extremely fit explanation is the theory of the enhanced greenhouse effect. Are we responsible for the enhancement? Weigh the evidence, Terranova. Or ignore it, but the ignorance is then your own, personal, conscious responsibility.
-
DSL at 13:38 PM on 10 July 2013Empirical evidence that humans are causing global warming
guinganbresil, I'd say that the system has a form of hysteresis. There is a systemic lag between input and output, and the mechanisms that cause that lag are themselves integrated in a complex way. I should perhaps rather have said, "That there is a measurable delay in response highlights the difficulty in using the TOA imbalance trend to say anything more than 'GW continues.'" Of course, the theory of the greenhouse effect is not dependent on the TOA energy imbalance. It's physics. TOA imbalance provides corroborating evidence, but the difficulty in making a meaningful reading of TOA imbalance and quantitatively connecting it with the enhanced GHE (with feedbacks), with natural forcings (and their feedbacks) separated, is difficult (as Trenberth and climate modelers would undoubtedly point out).
-
chriskoz at 13:14 PM on 10 July 2013Climate Change Denial now available as Kindle ebook
c.change,
Following your suggestion that the book should be available for free for those who canot affords otherwise, I sugest you go to your local library, and suggest them to purchase a copy if they haven;t done yet: that's a great way to propagate knowledge in your community. Accordingly, the libarary in my council purchased this book following the suggestions:
library.ryde.nsw.gov.au item search
Thank you, City of Ryde.
-
John Hartz at 12:49 PM on 10 July 2013Empirical evidence that humans are causing global warming
Terranova:
Problem is that when those events occurred in the past, they gnerally occurred over a geological time scale.
-
guinganbresil at 12:42 PM on 10 July 2013Empirical evidence that humans are causing global warming
DSL @ 5
I concur - the TOA energy imbalance is the root of the matter. If it is there, AGW. If not, it is all bunkum.
It is clear that a change in the concentration of greenhouse gases in the atmosphere will cause a change in the spectrum as seen from space, but that does not necessarily mean that there is an overall energy imbalance. Throw in a process with hysteresis and all bets are off.
-
Rob Honeycutt at 11:09 AM on 10 July 2013The Consensus Project self-rating data now available
Peeve @6... It's been asked many times of Andrew, who and how many scientists did he email? His response has been that he won't divulge that information because it's part of a piece of work that he's doing.
I've told him numerous times that his issues with Cook13 are addressed within the paper itself. But thus far my comments have fallen on deaf ears. It should be a little more difficult for him (and others) to ignore this obvious fact now that John has made this post.
-
Brian Purdue at 10:56 AM on 10 July 2013Empirical evidence that humans are causing global warming
Terranova @ 17
Yes, they have happened before but always because the global climate was forced to change.
What is your reason for it changing this time? Please check out the myth section of SkS before replying.
Science says there is a new forcing agent on the block – human activity and specifically the burning of fossil fuels.
-
Terranova at 10:19 AM on 10 July 2013Empirical evidence that humans are causing global warming
John at 15
Are you saying that none of those have happened before? That is untrue and weakens your position.
-
Peeve at 09:38 AM on 10 July 2013The Consensus Project self-rating data now available
Just checking the WUWT site where the seven scientists actually had to say about the way their papers were assessed. The quest poster 'Andrew from Popular Technology' says 'To get to the truth, I emailed a sample of scientists whose papers were used in the study and asked them if the categorization by Cook et al. (2013) is an accurate representation of their paper.'
I am not sure of Andrew's statistical skills but seven is hardly a representative sample of scientists reviewed By Cook. But putting that aside, I read a few of the comments by these seven scientists and i was surprised to read they openly ADMIT their papers support AGW. The deception was the use of the word 'accurate'. They all went on to discuss the other effects that would account for tHe warming, but all stated there was something else was causing the increase in themperature and didn't deny it was humans who were responsible.
As an aside, when looking for 'Andrew from Popular Technology' post, I noticed many WUWT posts actually imply that the world is warming. But the gist of their posts is that it is 'good'. For instance, less Artic ice has caused the polar bear population to increase. it is obviously getting harder and harder to ignore the obvious.
-
Tom Curtis at 09:34 AM on 10 July 2013Empirical evidence that humans are causing global warming
stbloomfield @11, I am not clear which correlation you are referring to, and hence which link between human activity and global warming you are calling into question.
Do you call into question the link between anthropogenic emissions of CO2 and the rise in CO2 concentrations? In that case you need to examine the ten lines of evidence that conjointly make it certain that humans are in fact the cause of the recent rise in CO2 concentration. The evidentiary support of those lines of evidence for various alternative hypotheses is summarized in the chart below. Curiously, I have never seen a "skeptical" scientist discuss all ten lines of evidence, or indeed more than one or two, and then not the relevant ones compared to the hypothesis they prefer. (The one, honourable exception is Ferdinand Engelbeen who has always been quite clear on the overwhelming nature of the evidence that humans are responsible for the CO2 increase, and actively corrects people making these errors on major "skeptical" blogs.)
Or is it something else you are questioning?
-
John Hartz at 07:30 AM on 10 July 2013Empirical evidence that humans are causing global warming
stbloomfield:
There are no known natural cycles which explain the following changes in the Earth's climate system.
-The disappearing Arctic sea ice
-The melting Greenland ice sheet
-Melting alpine glaciers
-The warming and expanding troposphere
-The warming global ocean system
-The cooling and shrinking stratosphere
-The melting permafrost in Canada, Alaska, and
Siberia-Rising sea levels
The above listed observed and measured changes are all being caused by the enhanced greenhouse effect caused by mankind's continuing release of greenhouse gases into the Earth's atmosphere.
-
DSL at 07:06 AM on 10 July 2013Empirical evidence that humans are causing global warming
True, stbloomfield, but then again you have no empirical evidence that the food you eat each day provides you with energy. Sure, theoretically it's possible and highly probable, yet you can't directly observe the process. Eating and energy availability are only strongly correlated. So why eat? It's really expensive.
Am I being silly? Sure, but every day you intuit and act on correlations that are much, much weaker than the connection between human emitted CO2 and the rise in atmospheric CO2. If you choose to deny the connection, I'm curious as to how you erase human-sourced CO2 from the physical equation.
-
Composer99 at 06:52 AM on 10 July 2013Empirical evidence that humans are causing global warming
stbloomfield:
You'll have to forgive my asperity, however saying humans are behind the recent global warming is a bit like saying the ocean is full of water.
- Humans have been emitting increasing amounts of carbon dioxide since the start of the Industrial Revolution (if memory serves, we now produce CO2 in sufficient quantity to increase the proportion in the atmosphere by 3 ppm per annum) by burning fossil fuels or changing land use.
- No other source of CO2 has been shown to exist that can account for the observed rise while simultaneously sequestrating away all the human-emitted CO2.
- As shown in the OP, CO2's atmospheric greenhouse properties are well-validated by physics theory, experiment, and observation.
Bluntly put, in order for humans to not be responsible for global warming, an enormous body of atmospheric and radiative physics, atmospheric chemistry, and empirical measurements would have to be completely upended.
-
jeff_from_ky at 06:50 AM on 10 July 2013Empirical evidence that humans are causing global warming
stbloomfield
Did you miss the second figure in the post?
-
stbloomfield at 05:22 AM on 10 July 2013Empirical evidence that humans are causing global warming
I'm missing the link to humans in this article. The rise in the last 150 years is only a correlation and is not necessarily caused by humans.
-
MA Rodger at 03:59 AM on 10 July 2013The anthropogenic global warming rate: Is it steady for the last 100 years? Part 2.
KK Tung.
I must admit to an error I made @170. The inter-annual wobbles from HadCRUT4 that I show on the graph linked @170 do not mysteriously feature on Tung&Zhou2013 Fig 5B. The data actually was scaled from Fig 2B from your first SkS post on this subject. I apologise for this error. (The appearance of the HadCRUT4 inter-annual wobbles in Fig 2B still remain unexplained but it is less 'mysterious' occurring on that graph than on Fig 5B.)So I have double-checked and hope I make no error now, as I introduce another graph showing the data from Tung&Zhou2013 Figs 5A&B. It presents quite a few questions but I will kick off here by asking about the wobbles in the blue trace. This blue trace is the 10-year rolling average of residuals from the MLR obtained by subtracting the QCO2(t) function (introduced in your first SkS post) from the data presented in Fig 5B, and obviously re-based for clarity's sake.
According to Zhou &Tung 2013 which covers your MLR analysis more fully than T&Zh13 "The residual ... should only consist of climate noise if the MLR is successful..." This conforms to my understanding of it.
Yet the blue trace showing the residuals from the MLR analysis in Tung&Zhou2013 shows a lot more than "noise." There are distinct wobbles and these are not small wobbles being 43% that of the original HadCRUT4 wobbles (red trace). The reiduals thus contain a very significant part of the HadCRUT4 signal which the MLR analysis has failed to attribute.
A cynic would point to such wobbles within the residuals as being indicative of curve-fitting.
For myself, I am more charitable and rather see the problem being that these wobbles have gone unreported in Tung&Zhou2013. Indeed, a very similar trace can also be derived from Fig 1B Zhou&Tung2013 yet that paper says of the data in Fig 1B "The global-mean temperature adjusted this way shows mostly a monotonic trend with some scatter." This blue trace is definitely not "scatter."
(Note that the graph below features data derived from your Fig 5A&B in Tung&Zhou2013 as there are other feature beyond the blue trace that I see requiring explanation & which I hope we can address in later comments.)
Could you thus explain why this wobble is present in the residuals and why its presence has remained unreported?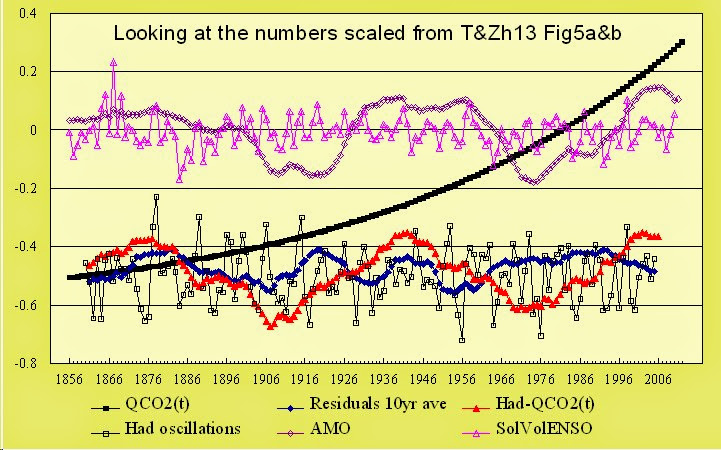
-
rockytom at 02:35 AM on 10 July 2013Climate Change Denial now available as Kindle ebook
John, you might want to mention that our textbook, "Climate Chance Science: A Modern Synthesis" is also available in a Kindle edition. Of course, we authors have no control over the price which is set by the publisher. An amazing amount of work goes into publication of a book. The authors, publisher, editors, formatters, "typesetters", printers, and distribitors go through many iterations before release. Then we must sort through all the personal attacks from deniers, etc. It's not always fun but well worth the effort. Our textbook could not have been done without the internet with yours truly in New Mexico (USA), you in Queensland (and traveling to the US, around Australia and Europe), Springer in The Netherlands, the printers in India, others in Germany, and distribution throughout the world. One earns every cent derived from the sale of the books one writes.
-
DSL at 02:14 AM on 10 July 2013Empirical evidence that humans are causing global warming
From the paper: "The contribution of water vapour to the increase in greenhouse radiation has not been included since it is a part of the natural climate feedback. There is some argument to suggest that tropospheric water vapour has already increased by several percent; hence, the corresponding flux contribution may need to be included, but this effect is beyond the scope of current models."
WV is filtered out probably to isolate the effects of the long-residence, well-mixed, and/or human-increased GHGs (WV is none of the above).
-
DSL at 02:02 AM on 10 July 2013Empirical evidence that humans are causing global warming
Terranova, this may be what you're looking for.
Moderator Response:[RH] Tweaked URL for page formatting.
-
Terranova at 01:50 AM on 10 July 2013Empirical evidence that humans are causing global warming
GPWAYNE,
Why is the greenhouse effect from water vapor filtered out? I tried to follow the link to Evans, 2006, but is does not work.
Moderator Response:[GPW] Sorry about the link: fixed now.
And thanks to DSL for answering the question.
-
David Lewis at 01:24 AM on 10 July 2013Live Feed of the AGU Chapman Conference on Climate Communication starting... now!
I've listened to a few of the recorded sessions the AGU put up on Youtube that referred to what John Cook had to say - for instance, Richard Alley's talk. Did the AGU not record John's presentation?
-
DSL at 01:03 AM on 10 July 2013Empirical evidence that humans are causing global warming
I'll add that I like the detective slant. You could add a tab to the "it's not us" myth that extends the metaphor. It wouldn't take much to re-write Tom's Climate Change Cluedo to fit this crime scene narrative (it's already 3/4s of the way there). Of course, the outcome is obvious and we have no alibi. The question is the crime and intent: assault and battery, murder, manslaughter, harm through negligence, torture, kidnapping, or something else.
"Part of me loved her. Part of me wanted to force her to my will. Part of me wanted her to take care of the daily routine so I could be the superstar the public wanted me to be. What I did to her, though, was an accident. It was an accident. It had to be an accident. No matter what her kids say. Our kids. She'd better be there for me. Her friends say she's going away. Filthy liars! She loves me. She'll be back. It's not my fault!"
-
silence at 00:50 AM on 10 July 2013Empirical evidence that humans are causing global warming
The WMO has decided that the 1922 Libya temperature record was a result of observational error, rather than the hottest temperature on record. You may want to use the Death Valley record as the hottest temperature on record.
Moderator Response:[GPW] Thanks for that - now updated accordingly
-
DSL at 00:47 AM on 10 July 2013Empirical evidence that humans are causing global warming
And understanding that tiny imbalance is critical to a good understanding of the process. It represents the system's delayed response, and it represents the idea of an ongoing process. Whenever I talk with people about the TOA situation, they assume a static system and expect a large imbalance. No - it's ongoing: the system is progressively storing energy and radiating at a higher temperature at the same time. That there is a measurable delay in response highlights the difficulty in using the TOA imbalance to say anything more than "GW continues." The systemic delay is not uniform. That's a jump off point for explaining transient climate response and the way that energy moves through the system. TOA imbalance is also one step away from the physical mechanism of the greenhouse effect.
So while it might be confusing simply to mention the imbalance, it's also an excellent starting point to work from while explaining the whole shebang.
-
Tom Dayton at 23:43 PM on 9 July 2013Empirical evidence that humans are causing global warming
Paul S, it is true that "looking at the planet from outer space, you would see less energy coming out," as long as there is an energy in/out imbalance. That "tiny amount" is sufficient to cause enough warming to cause serious problems.
-
PaulS8950 at 23:38 PM on 9 July 2013Empirical evidence that humans are causing global warming
"What the science says: Less energy is escaping to space"
Well, only a tiny amount less. The energy balance at the top of the atmosphere is still pretty close to zero, isn't it? The simplicity of "less energy is escaping to space" is appealing, but it will take hours to explain whay you mean by that, and along the way you come up with a misleading concept that looking at the planet from outer space, you would see less energy coming out.
-
Eric (skeptic) at 23:25 PM on 9 July 2013Two Expert — and Diverging — Views on Arctic’s Impact on Weather ‘Whiplash’
Thanks for fixing the links above. I will practice doing them correctly with a paper describing the "old" theory, SH oriented: http://journals.ametsoc.org/doi/pdf/10.1175/3221.1 which states: The resulting zonal mean response demonstrates a strengthening of the meridional gradient in extratropical H500 and H200 and thus increased zonal mean geostrophic winds.
The "new" theory, applied to the NH is from this paper: http://marine.rutgers.edu/~francis/pres/Francis_Vavrus_2012GL051000_pub.pdf which states: The strength of the poleward thickness gradient determines the speed of upper-level zonal winds. As the gradient has decreased with a warming Arctic, the upper-level zonal winds during fall have also weakened since 1979 (Figure 3, right), with a total reduction of about 14% (>95% confidence).
Hopefully the links work this time and illustrate the contrast. The SH paper briefly describes the modeled NH changes and shows in figure 1 that the change from AGW is seasonal with an increase in the gradient in NH summer (dashed line showing greater warming at low latitudes than high latitudes) but a large decrease in the gradient in NH winter (solid line). That is consistent with the NH paper's statement about the NH fall.
-
Nichol at 23:17 PM on 9 July 2013The Consensus Project self-rating data now available
My direct reaction is how small the difference is between 1990 and now. How far would you need to go back to the time when there was still a reasonable controversy over climate change among climate scientists?
-
c.change at 22:21 PM on 9 July 2013Climate Change Denial now available as Kindle ebook
Hi jdixon1980 @ 3. You're absolutely right. They deserve every penny they get. Please note my comment was not regarding helping their website but rather appealing to their altruistic motives in order to get their valued message to a wider audience, which after all is the whole point in writing the book. Either way - it's a great thing that this book is available at all and certainly not worth arguing about!
-
Eric (skeptic) at 21:06 PM on 9 July 2013Two Expert — and Diverging — Views on Arctic’s Impact on Weather ‘Whiplash’
AAO shows less cyclical variation: than AO:
I have found that the monthly plots above obscure some week-long negative excursions that correlate well to extreme weather. But the plots can be used more generally as an index for the polar jets, red being faster and less meandering, blue being slower and meandering.
Moderator Response:[RH] Hot linked URL's that were breaking page formatting.
-
Barbara W at 19:27 PM on 9 July 2013The Debunking Handbook: now freely available for download
Hello, the link to the english version of the debunking handbook does not seem to work for me? cheers
Moderator Response:[DB] Curious. Try this one:
-
Richard Lawson at 18:59 PM on 9 July 2013No warming in 16 years
Thanks Tom. And, having now read Church et al 2011, I see that they included all ice melting energy in their calculations, so it seems I was on a wild goose chase. Apologies.
-
MichaelK at 18:49 PM on 9 July 2013Empirical evidence that humans are causing global warming
In the first paragraph after the first graph the chemical formula for methane is wrong.
Also, I don't think the Smoking Gun argument comes across as convincing. I know what you are saying, but to state CO2 traps specific wavelengths but then say it radiates at the same wavelengths could be confusing for the target audience. I feel few more sentences of explanation may be useful.
-
Tom Curtis at 18:49 PM on 9 July 2013No warming in 16 years
Richard Lawson @11, by my calculation you misplaced a decimal point when converting from Joules per annum to Joules per second (Watts). The correct value for the full caculation is 0.006 W/m^2 of energy used in ice melt given your initial values. That is approximatly 1% of the TOA energy imbalance.
-
JasonB at 18:48 PM on 9 July 2013The Consensus Project self-rating data now available
Tom,
At least 3% of self ratings were inconsistent (ie, had at least two self ratings that disagreed). That is a much lower "error rate" than with the abstract ratings, which does not surprise given that the authors had acces to the full paper, not to mention knowledge of their intentions from which to assess their rating.
Another two points:
1. Unlike the abstract ratings, all of which had at least two raters (and therefore an opportunity for inconsistency), my understanding is that at least some (perhaps the majority?) of the self-rated papers would have been self-rated by only one author. To compare rates of inconsistency we would need to know what percentage of self-rated papers that were rated by two or more authors gave inconsistent ratings (together with assurances that the authors didn't compare notes before responding).
2. We're inferring incosistent self-ratings by fractional averages, but of course if two self-ratings disagreed by two levels (for example), the average would be a whole number and we would mis-classify that as not inconsistent.
-
Richard Lawson at 18:24 PM on 9 July 2013No warming in 16 years
But it may affect the *rate* at which we increase global surface temperatures.
It is clear that energy is taken up by melting Arctic ice. I am not quite clear as to whether this is already accounted for in calculations of ocean heat content, or is it additional to OHC?
If it is additional, what proportion of the forcing has gone into melting Arctic ice? Could it be a significant co-factor in the slowed rate of increase in land surface temperatures over the last decade?
There now follows my attempt to answer this question. It comes with health warnings, as I am not a physicist, and am not even very confident with exponentials, so my conclusions may be way out.
Over 10 years 2002-2912, 10 e21 Joules have been absorbed into the Arctic ice melt.
So each year, 10e20 Joules were absorbed.
Since there are 3.15 x 10 e7 seconds in a year, that is equivalent to 3 x 10 e13 Joules per second, in other words, 3 x 10 e13 watts go to melt the ice.
The earth's surface is 5.1 e 14 square metres. Therefore the quantity of watts per square metre relating to Arctic ice melt is about 6 e-2, or 0.06 w/m2
The current level of radiative forcing due to GHGs, according to the IPCC AR4, is 1.6 watts per square meter (with a range of uncertainty from 0.6 to 2.4).
Therefore the effect of the Arctic ice melt is to reduce the effectiveness of the radiative forcing due to enhanced greenhouse gases by 3.75% (range 2.5 - 10%).
If this calculation is correct, it would seem therefore that the Arctic ice melt, if it is indeed not already accounted for in the OHC figure, is a significant component of the reduction in the rate of surface warming, and very significant al lower estimates of GHG forcing.
If all planetary ice losses (from glaciers, Greenland, and the Antarctic) were included, the contribution would be even more significant.
-
Tom Curtis at 18:09 PM on 9 July 2013The Consensus Project self-rating data now available
Here are the overall stats:
Abstract ratings (columns) vs Self ratings (Rows) 1 2 3 4 5 6 7 1 8 55 87 75 1 0 0 2 3 78 171 299 0 0 0 3 3 48 141 348 2 0 0 4 3 34 144 597 0 0 0 5 0 1 4 14 4 1 0 6 0 0 3 3 0 0 0 7 1 2 1 3 2 0 0 At least 3% of self ratings were inconsistent (ie, had at least two self ratings that disagreed). That is a much lower "error rate" than with the abstract ratings, which does not surprise given that the authors had acces to the full paper, not to mention knowledge of their intentions from which to assess their rating. That some errors still existed is probably due to ambiguity or misunderstanding of what is meant by "endorse". At least one author's self ratings disagreed with the abstract ratings due to misinterpretation of the meaning of "endorse" to mean "is evidence of". Another managed to disagree with the abstract rating by redefining "the consensus" to mean that approximately 100% of warming since 1900 has been due to anthropogenic factors, something few if any climate scientists would agree with and the IPCC has never claimed. Therefore it is wrong to assume that any instance of disagreement is due to an error by the abstract raters.
-
Rob Honeycutt at 17:56 PM on 9 July 2013The Consensus Project self-rating data now available
I find interesting the papers that flipped from endorsement to rejection, or vice-versa, in the process of self-rating.
Eleven went from endorsement to rejection, and 3 went from rejection to endorsement. Endorsement to rejection jumped an average of 3.4 points. Rejection to endorsement averaged 2.7 points.
But, overall, these are such a tiny fraction of the total number of papers as to be meaningless.
-
Tom Curtis at 17:52 PM on 9 July 2013Climate Sensitivity Single Study Syndrome, Nic Lewis Edition
dana, the process is that they select the equilibrium climate sensitivity that, in the model gives the best match to the effective climate sensitivity, but then report the equilibrium climate sensitivity. So they are comparing effective responses, but reporting equilibrium climate sensitivity.
-
BillWalker at 14:53 PM on 9 July 2013Empirical evidence that humans are causing global warming
Proofreading note: the second paragraph after "The Earth is wrapped in an invisible blanket" has a repeated sentence and sentence fragment. Please feel free to delete this comment.
Moderator Response:[GPW] Good call Sir. I decline to remove the comment, since it would also remove my thanks. Thanks too to Michael (next post).
-
dana1981 at 14:14 PM on 9 July 2013Climate Sensitivity Single Study Syndrome, Nic Lewis Edition
I believe what you're describing is an effective sensitivity calculation and calling it equilibrium sensitivity, Tom.
-
JasonB at 14:13 PM on 9 July 2013The Consensus Project self-rating data now available
Interesting. There were three papers that were rated as "1" by Cook et al but were self-rated as "4" by the authors, and one paper (in 2006) that was rated as "1" by Cook et al that was self-rated as "7" by the author!
I know you've attempted to maintain the confidentiality of the authors but there were only six papers rated "1" in 2006 and I think I can make an educated guess which one was self-rated as "7" just by looking at the names of the authors and without even reading the papers involved.
There were 37 papers rated as "2" that were self-rated as "4" or higher (numerically speaking), and 148 papers rated as "3" that were self-rated as "4" or higher.
If we narrow it down to papers that were rated as endorsing the consensus but were self-rated as not endorsing the consensus (i.e. not neutral), then there was only one paper rated as a "1" (mentioned above), three papers rated as a "2", and eight papers rated as a "3". Not bad.
It's interesting to see the fractional numbers that indicated authors disagreeing on the self-rating of their papers. It's instructive to realise that self-ratings aren't a gold standard that cannot be wrong, demonstrated by the fact that different authors on the same paper rated it differently.
-
johnrabbit at 11:38 AM on 9 July 2013Two Expert — and Diverging — Views on Arctic’s Impact on Weather ‘Whiplash’
Is the Antarctic Jet Stream unchanged? Because of the differences between them (Southern Ocean not land mass, land at the pole etc) I would expect that the Antarctic Jet Stream should be unchanged. If it has also slowed and increased its meandering then I would reconsider the causes of the Arctic Jet Stream.
-
Tom Curtis at 10:06 AM on 9 July 2013Climate Sensitivity Single Study Syndrome, Nic Lewis Edition
An ammendment to my post @42. I clearly became confused between the paper on which Lewis based his method and Aldrin et al. Nevertheless, the methods are very similar so that the method reports an equilibrium climate response is still correct.
-
Tom Curtis at 09:49 AM on 9 July 2013Climate Sensitivity Single Study Syndrome, Nic Lewis Edition
dana@ 41, Lewis is correct that the paper reports equilibrium climate sensitivity. The method in the paper is to run a simple model with a tunable climate sensitivity, and from this to develop a PDF of the best prediction of transient response. The climate sensitivity needed to give that best prediction of transient response is then the result of the paper. The paper states (section 3.1):
"The equilibrium climate sensitivity is a prescribed parameter in the model that represents the feedbacks of the climate system. Although the climate system is presently not in equilibrium because of the long timescales needed for transport of heat to the deep ocean, the equilibrium climate sensitivity can still be estimated on the basis of the transient response of the model. The model is constructed so that the temperature increase will be equal to the climate sensitivity when the model is run to equilibrium with a forcing corresponding to a doubling of the CO2 concentration."
In fact, the approach used by Aldrin really represents a model based estimate of climate sensitivity, the main difference from more conventional model based estimates being that he uses the simplicity of the model to do multiple runs and thus generate a PDF. As a model based estimate, it is no more reliable than the model used. In this case the model used has surface water downwelling in polar oceans and abyssal water upwelling in the tropics, entirely contrary to the thermohaline circulation. Given that, and that the estimate is an outlier, it must be considered dubious.
Prev 867 868 869 870 871 872 873 874 875 876 877 878 879 880 881 882 Next


